Categories
Featured How to & Advice

A Beginner’s Guide to Stochastic and Stochastic RSI

Stochastic and Stochastic RSI are some of the most commonly used indicators of all time. Used by various traders, these indicators are oscillators that oscillate between 0 and 100 to change from periods of oversold to periods of overbought levels. They help determine the strength of the move and can give different entries and exits depending upon the scenario.

What are Stochastic and Stochastic RSI?

Stochastic and Stochastic RSI (let’s call them Stochastics collectively for simplicity’s sake) have two lines: the Stochastic line, commonly called as %K which measures the strength of the current move relative to the range of the previous n-periods, and a second line called %D which is a simple moving average of the %K.

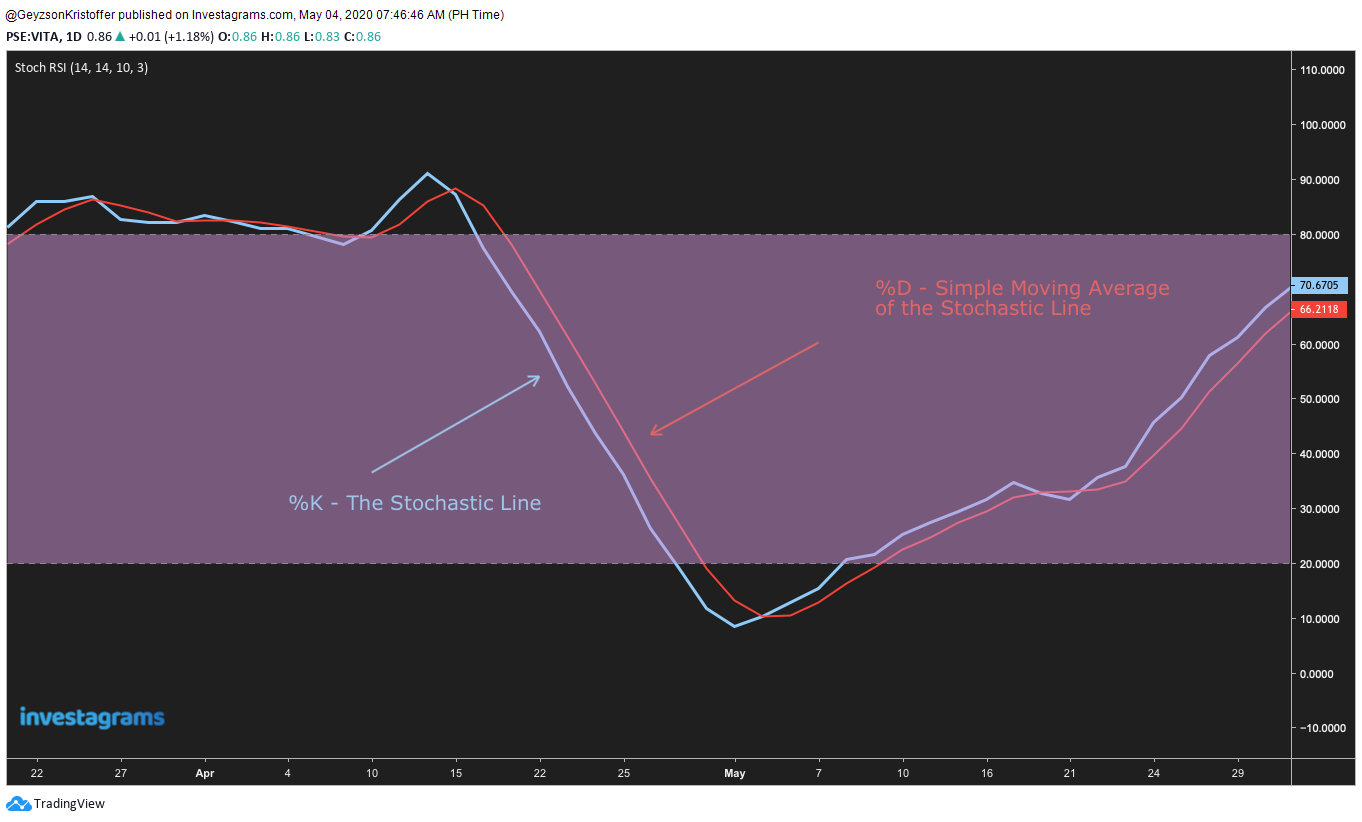
In addition, levels of interest are oversold levels which are values below 20, and overbought levels which are values above 80.

The standard configuration of a Stochastic Oscillator is a 1-period Stochastics line computed for the last 14-candles with a 3-day simple moving average on top of it. If you want a detailed computation of the values, click here.

The Difference between Stochastic and Stochastic RSI

The difference between them is that the Stochastic measures the strength of the current CANDLE relative to the previous candles, while the Stochastic RSI measures the strength of the current RSI VALUE relative to the previous RSIs.

Popular uses of the indicator:
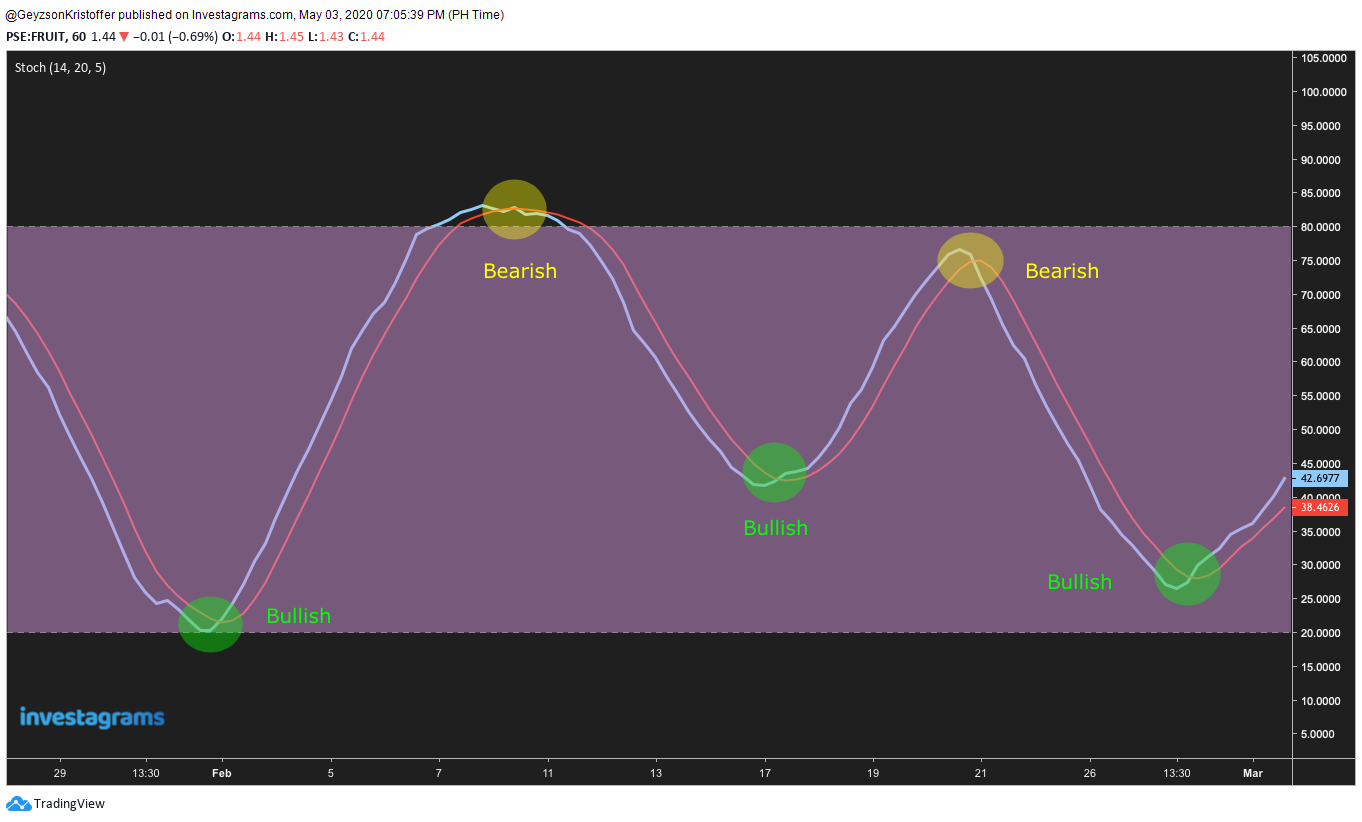
1. THE CROSSOVER

A crossover happens when %K and %D intersects one another. If %K crosses ABOVE %D, the setup is considered bullish, but if %K crosses BELOW %D, the setup is bearish. Here is an example:

I personally don’t trade using this strategy as this gives way too much signals. In trading, you want your signals just to be on that sweet spot where it gives many signals, but not too much that you get in and out of trades too quickly. Balance is key.

2. DIVERGENCES

Divergences happen if there is a disparity between the movement of the price to the movement of the oscillator.

A bullish divergence occurs if the price makes a lower-low while the oscillator makes a lower-high.

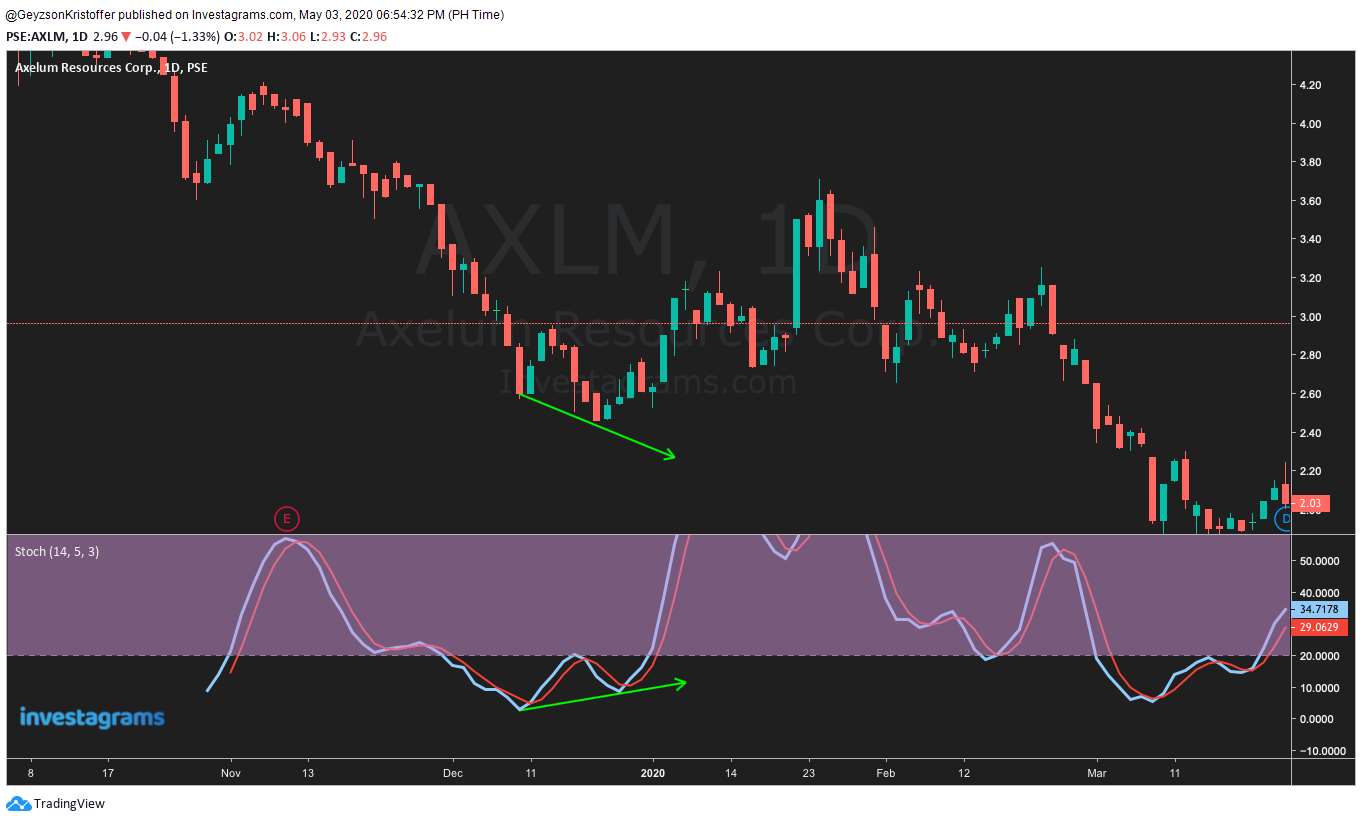
A recently IPOd stock, $AXLM formed a lower-low while the Stochastic formed a lower-high – A bullish divergence.

On the other hand, a bearish divergence occurs if the price makes a higher-high while the oscillator makes a lower-high.

Example:

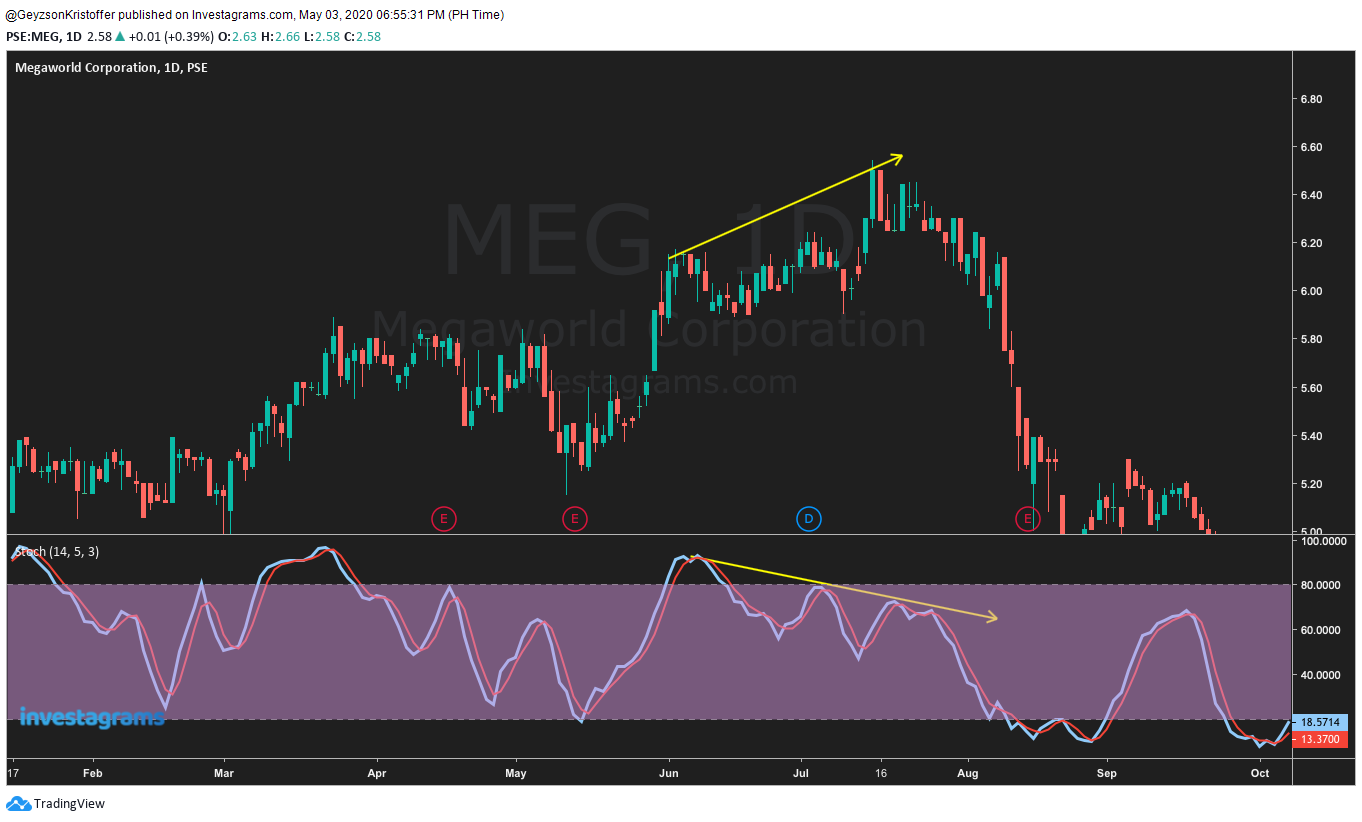
$MEG made a bearish divergence last June 2019 after the prices made their higher-high and the Stochastic made a lower-high.

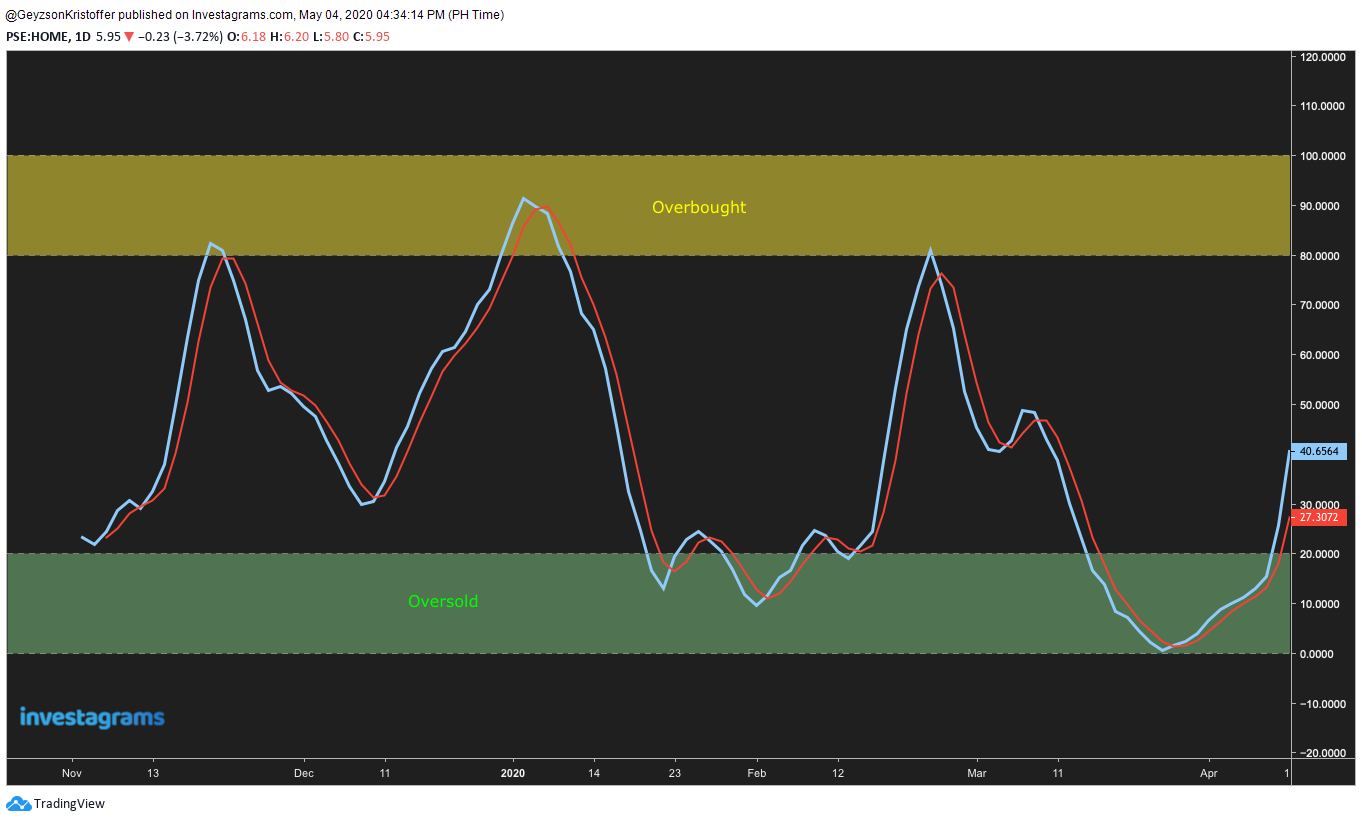
3. OVERBOUGHT AND OVERSOLD LEVELS

Stochastics have levels where the prices are considered overbought or oversold. A Stochastic value of 80 and above is at overbought levels, while 20 and below is at oversold levels. Traders use these levels for buying and selling, that is, they buy when the prices start to go out of oversold levels and sell when they start to go out of overbought levels.

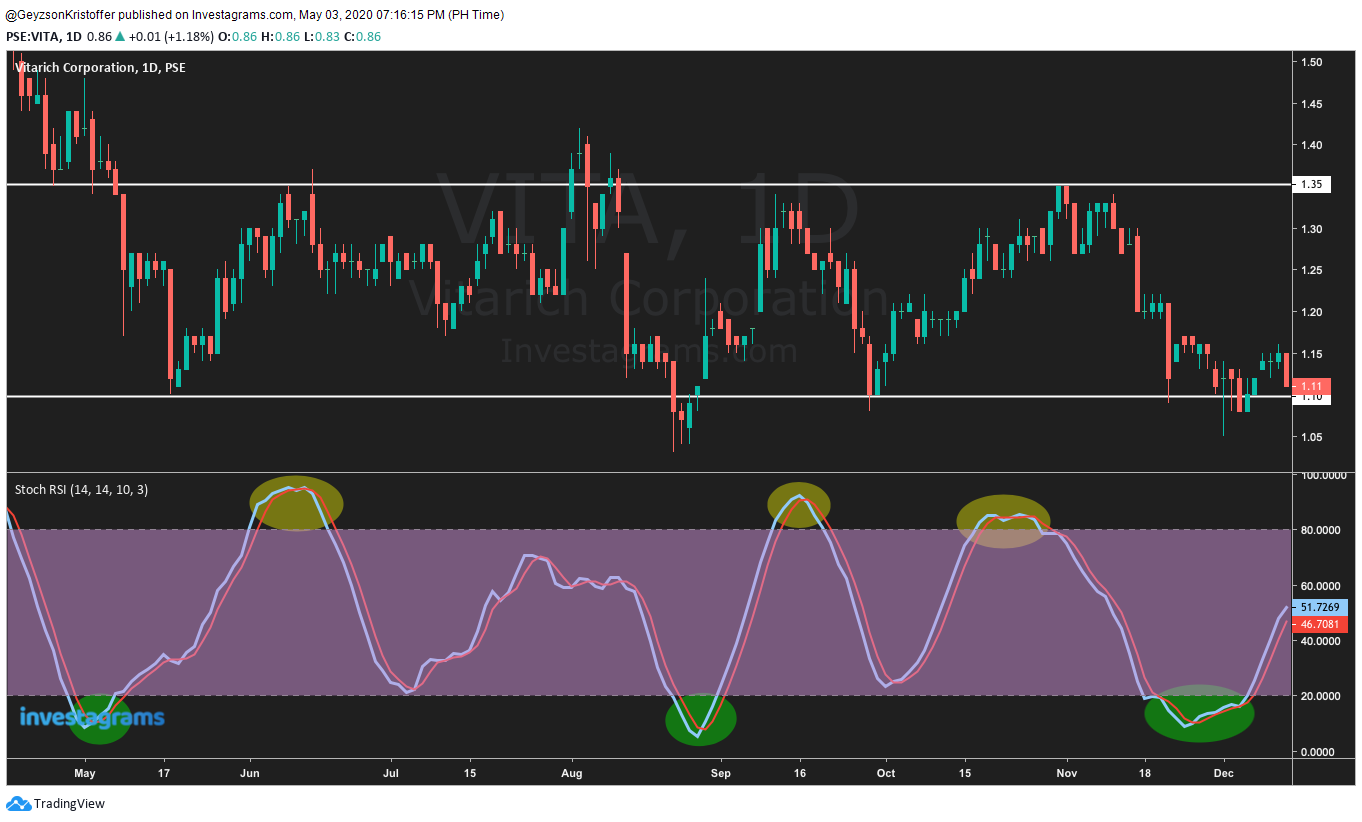
$VITA with a range-bound price action seems to reverse after hitting oversold and overbought levels.

But be cautious as this strategy appears to be only effective in a ranging price action. Since the markets are on a trend most of the time, using this strategy might become fatal overtime.

Below is an illustration about overbought stocks still going up by a significant amount and oversold stocks still diving down deeper.

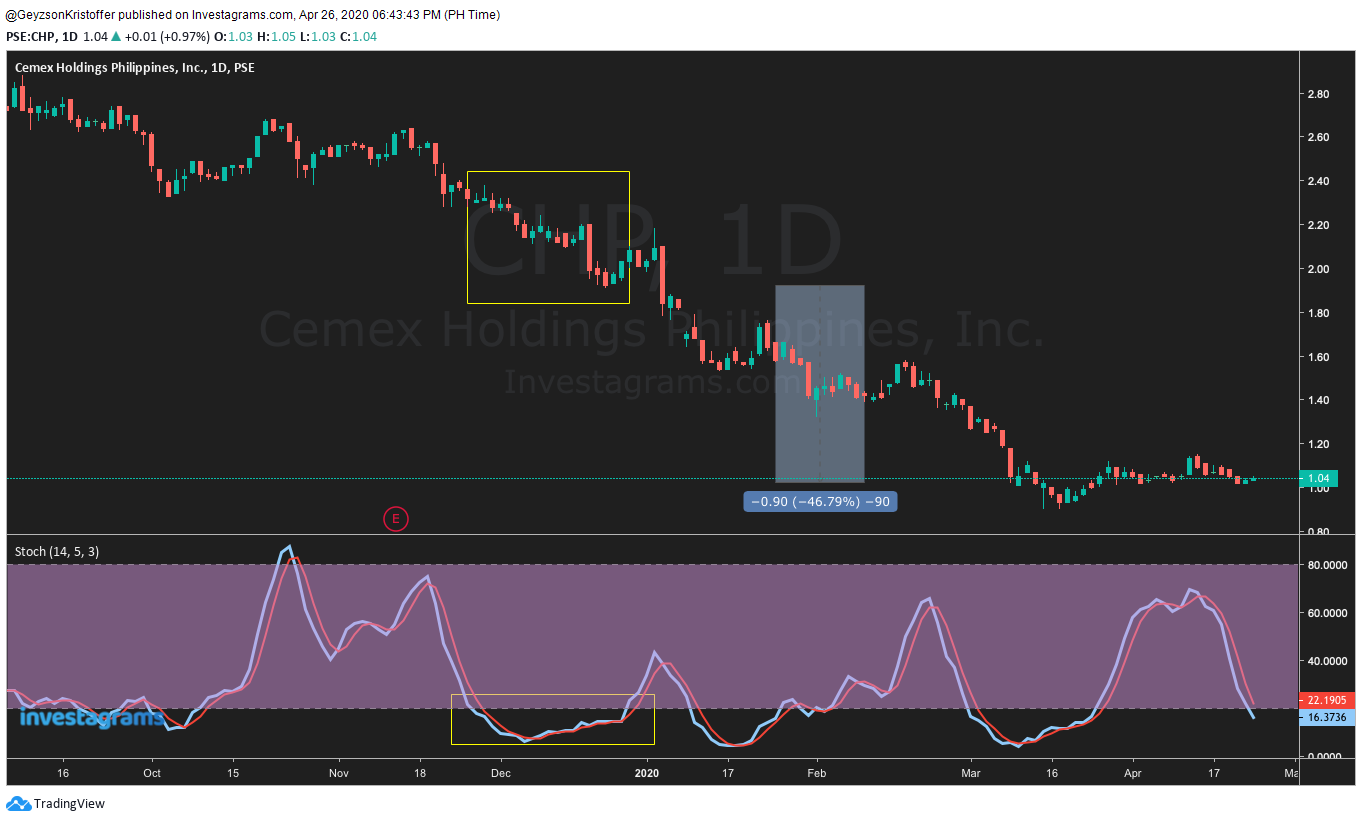
Oversold? After hitting oversold levels, $CHP continued to show weakness with more than a -40% move.

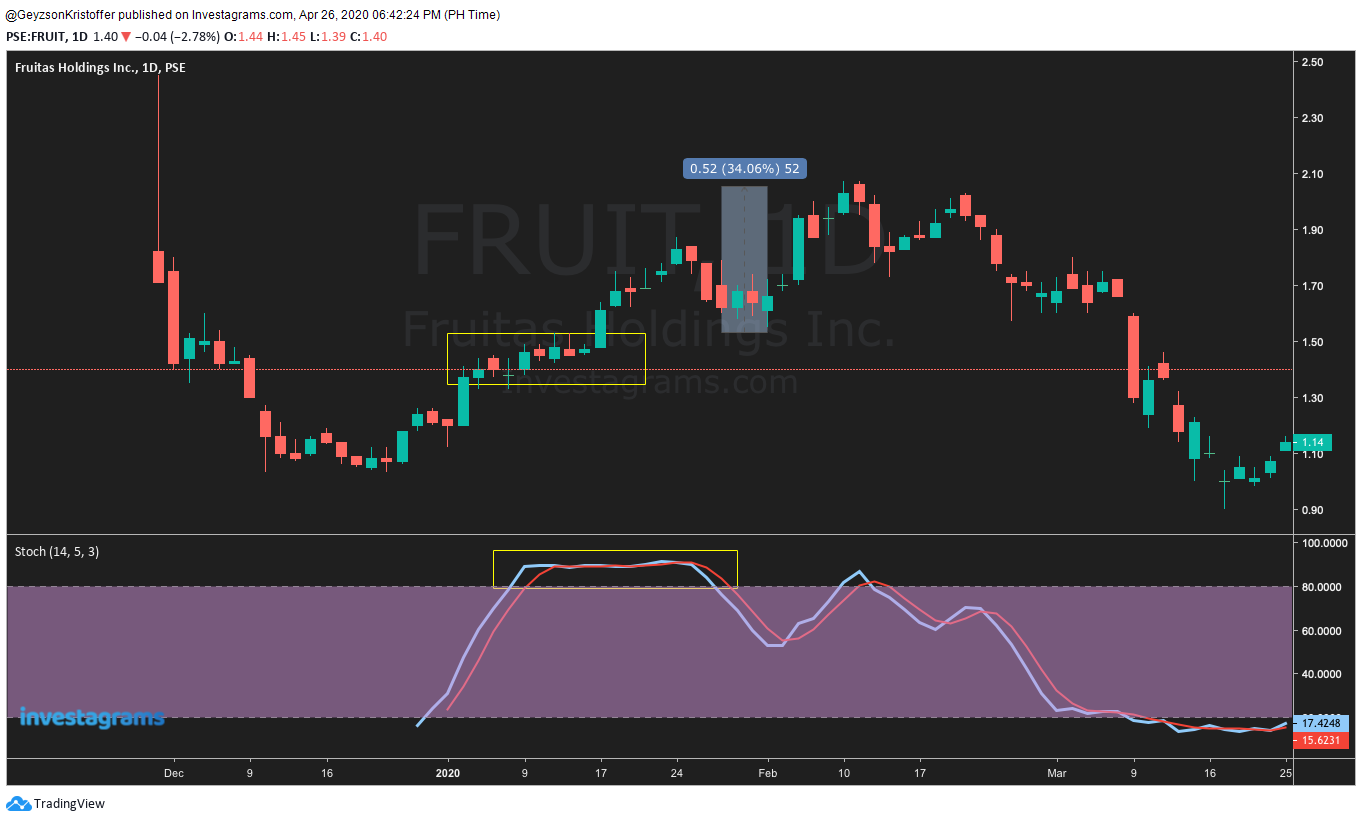
Overbought? $FRUIT went on and made new highs after hitting overbought levels. Showing that there are no overbought stocks for aggressive buyers.

This means buying when it is oversold and selling when it is overbought might cost you a chunk of money.

A better way to use Stochastics

Stochastics are computed based on the strength of the current price to the previous n-candles (or current RSI to previous n-RSI values), which means that Stochastic and Stochastic RSI are strength indicators. Using this information, we can infer the following:

  1. 1. Stochastics value above 50 shows strength and is in a bullish scenario.
    2. Since a value above 50 shows strength, a value above 80 shows extreme strength.
    3. Stochastics below 50 shows weakness and is in a bearish scenario.
    4. Since a value below 50 shows weakness, a value below 20 shows extreme weakness.

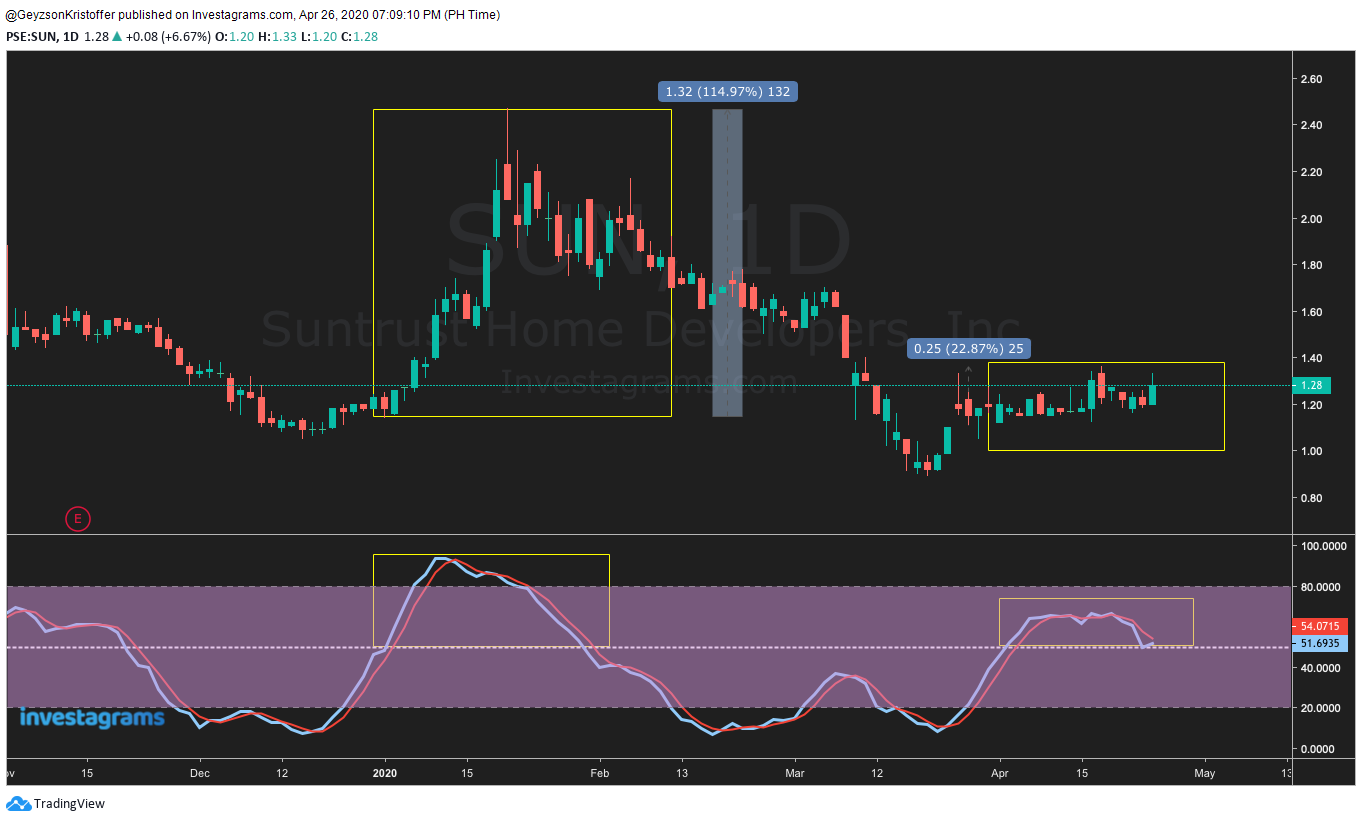
What does this mean? It means that you can consider buying only if the stock’s %K and %D are above 50.

Here are some of the examples:

1. $SUN – A massive 114% gain for $SUN after it broke the 50 level plus another 20ish% up-move.

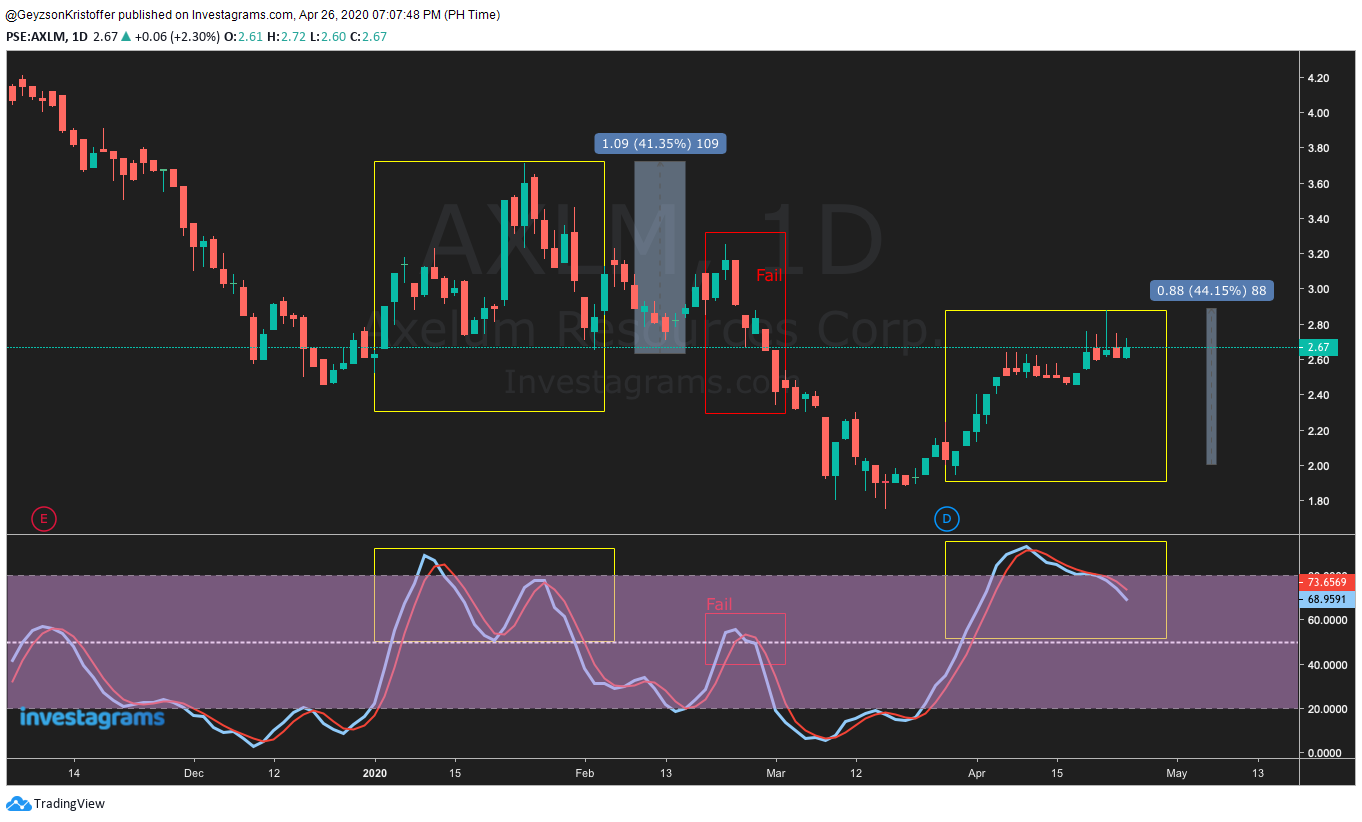
2. $AXLM entered above 50 levels 3 times, 2 of which made a move greater than 40%.

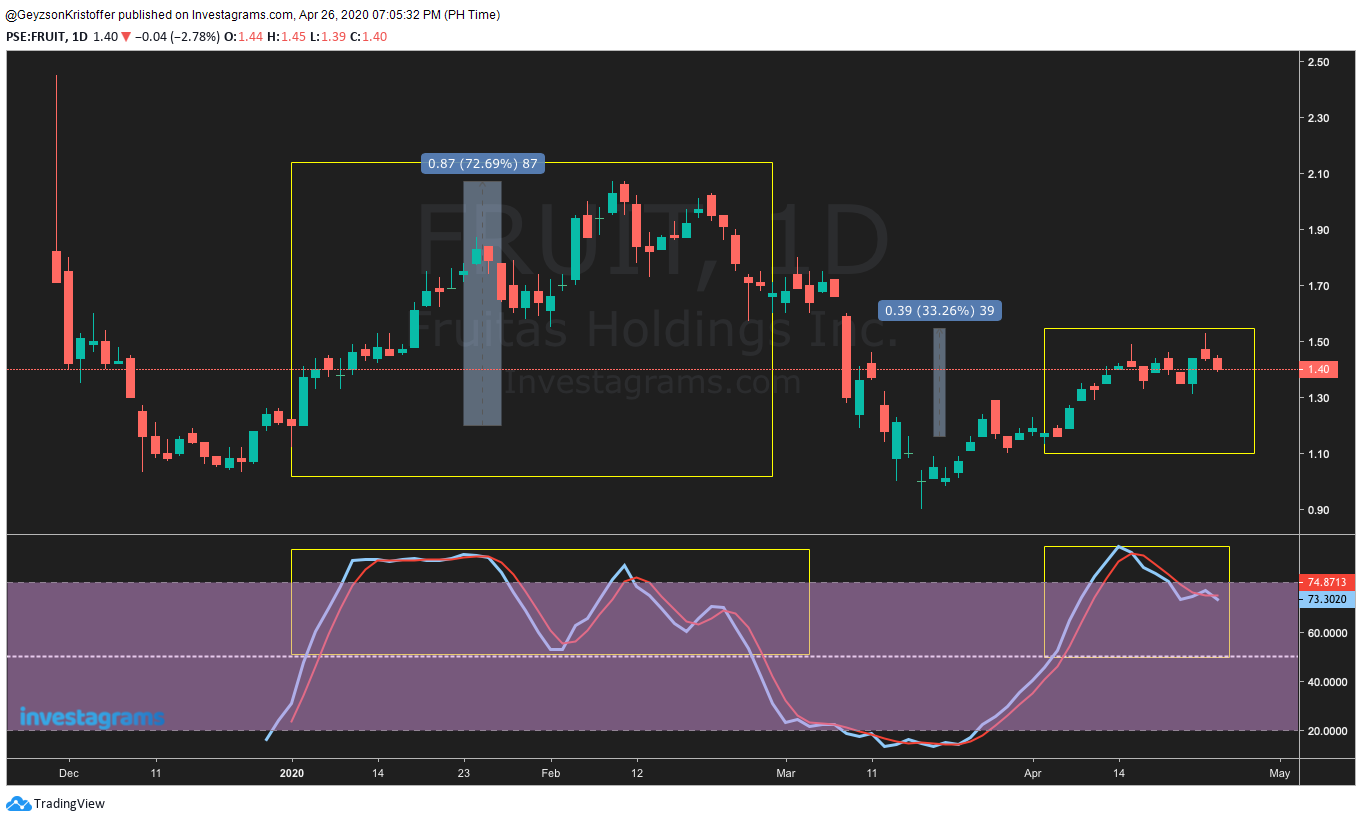
3. One of the hot IPOs, $FRUIT made a 72% and a 33% gain after being above the 50 levels.

And more…

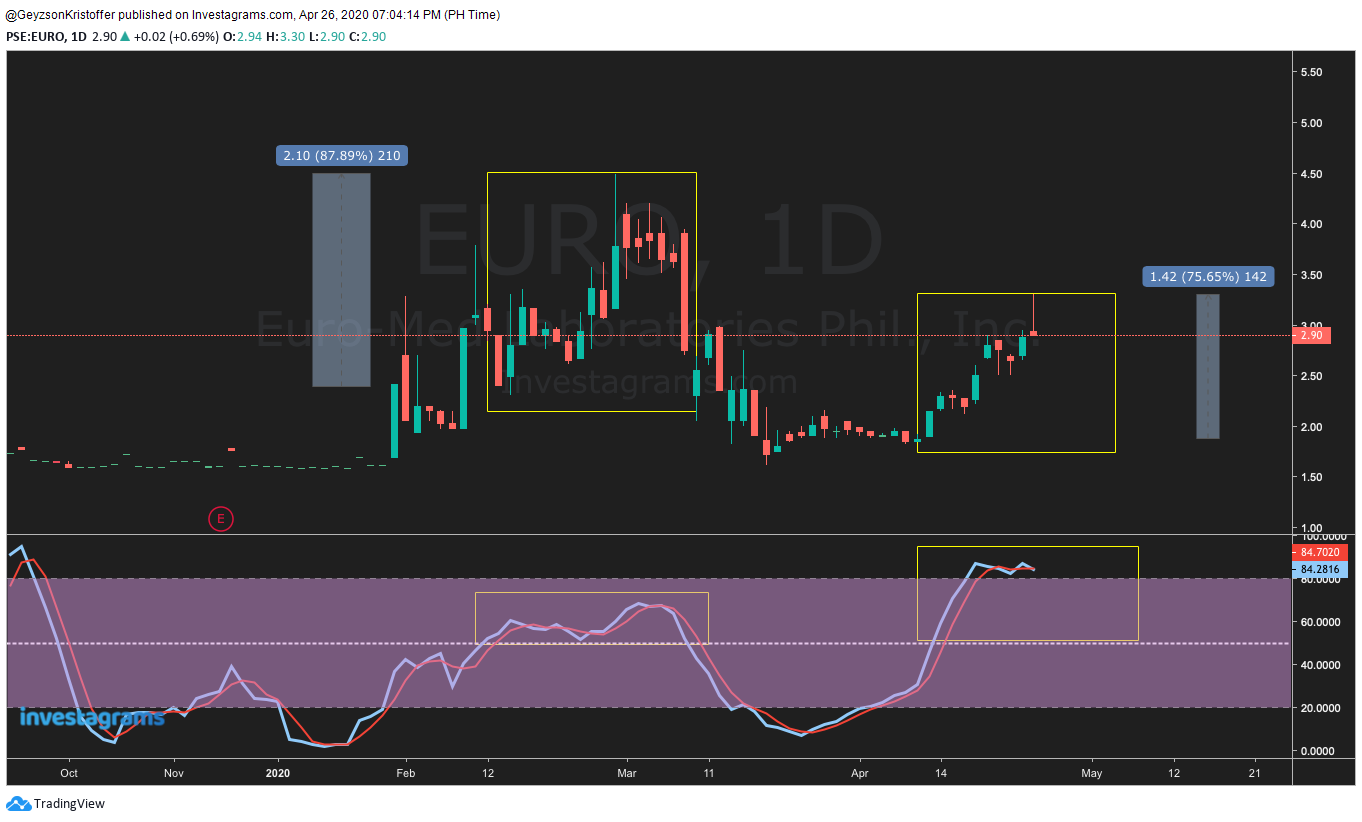
4. $EURO – 87% and 75%. Periods of extreme strength show high volatility and it’s up to the trader’s discretion whether to reduce or hold onto his positions.

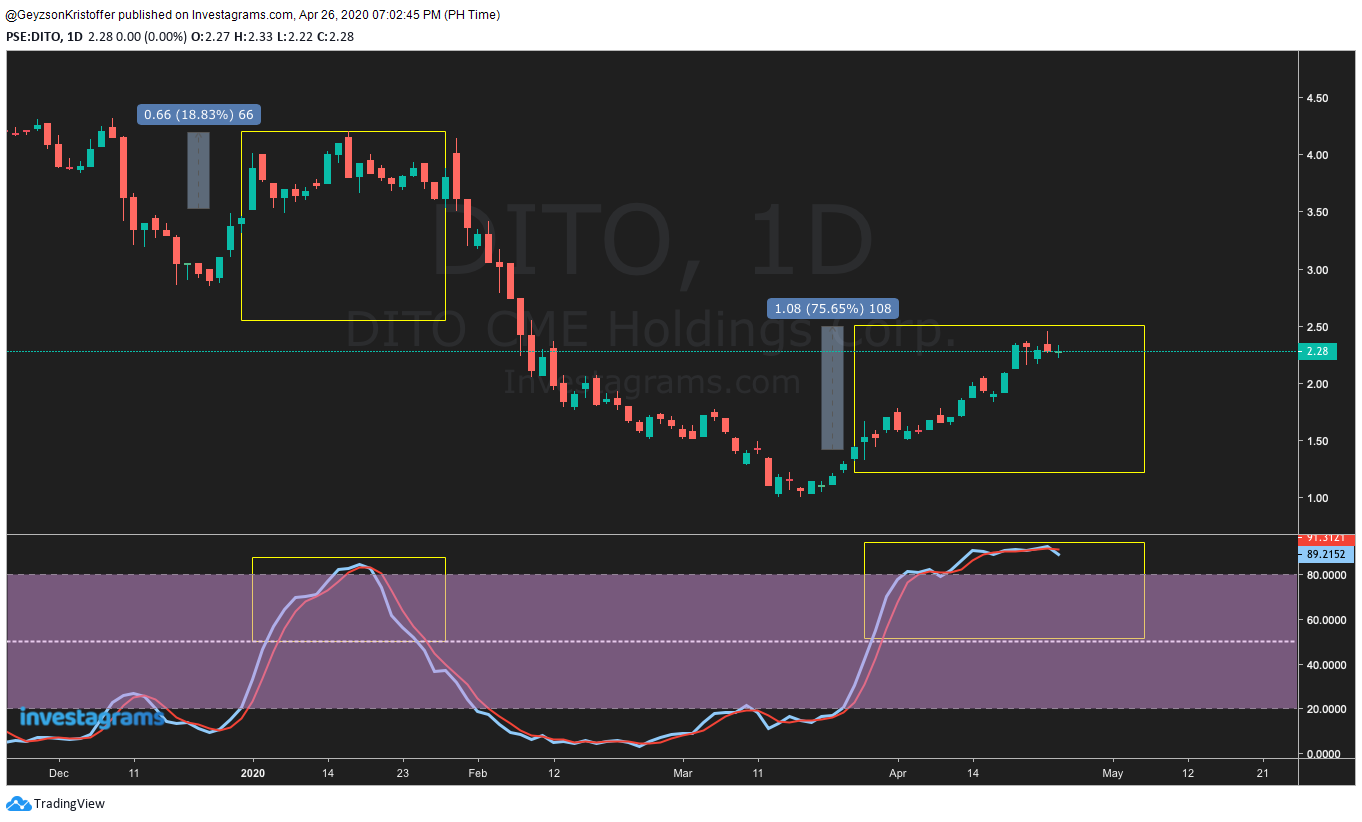
5. 3rd telco $DITO with an 18% and a 75% gain.

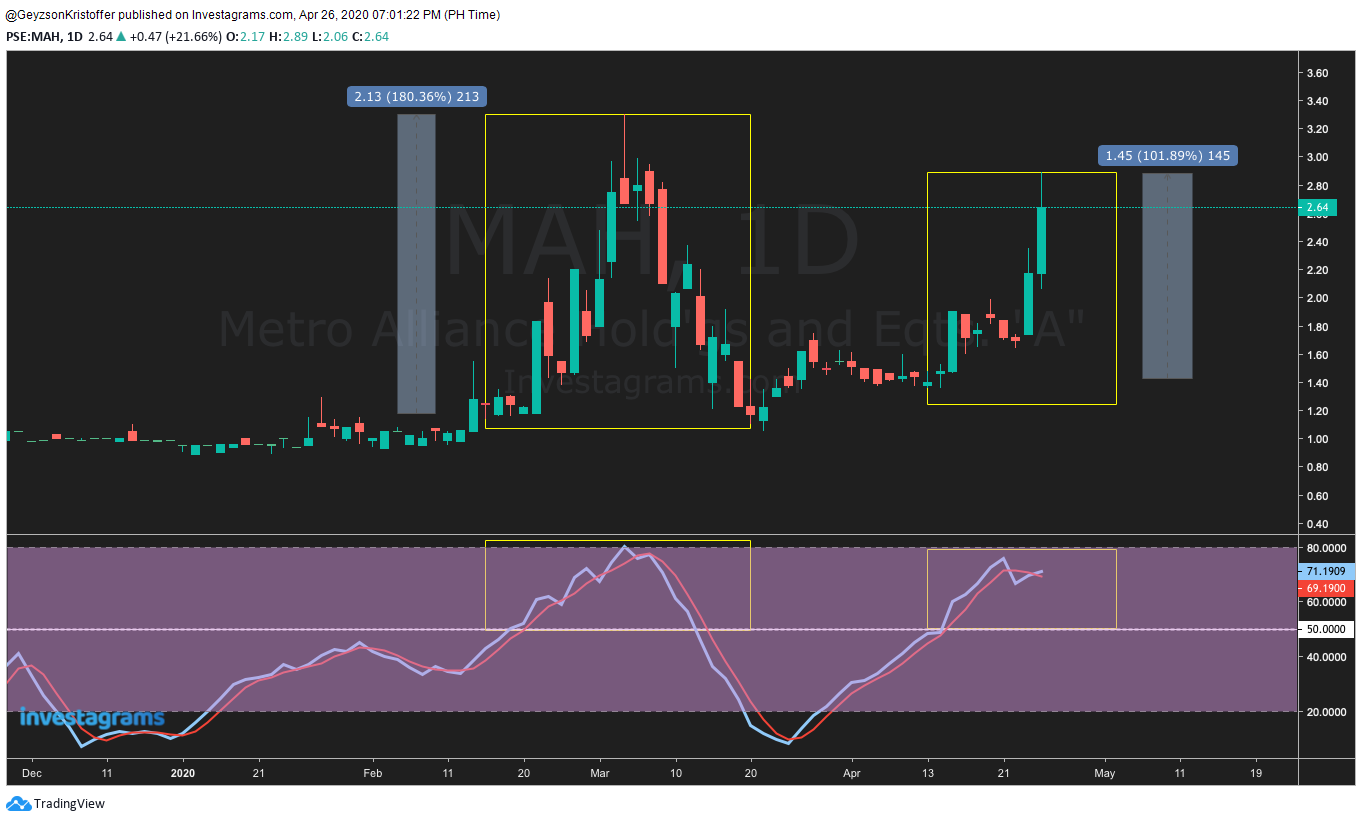
6. $MAH a super volatile stock with a 180% and a 100% gain.

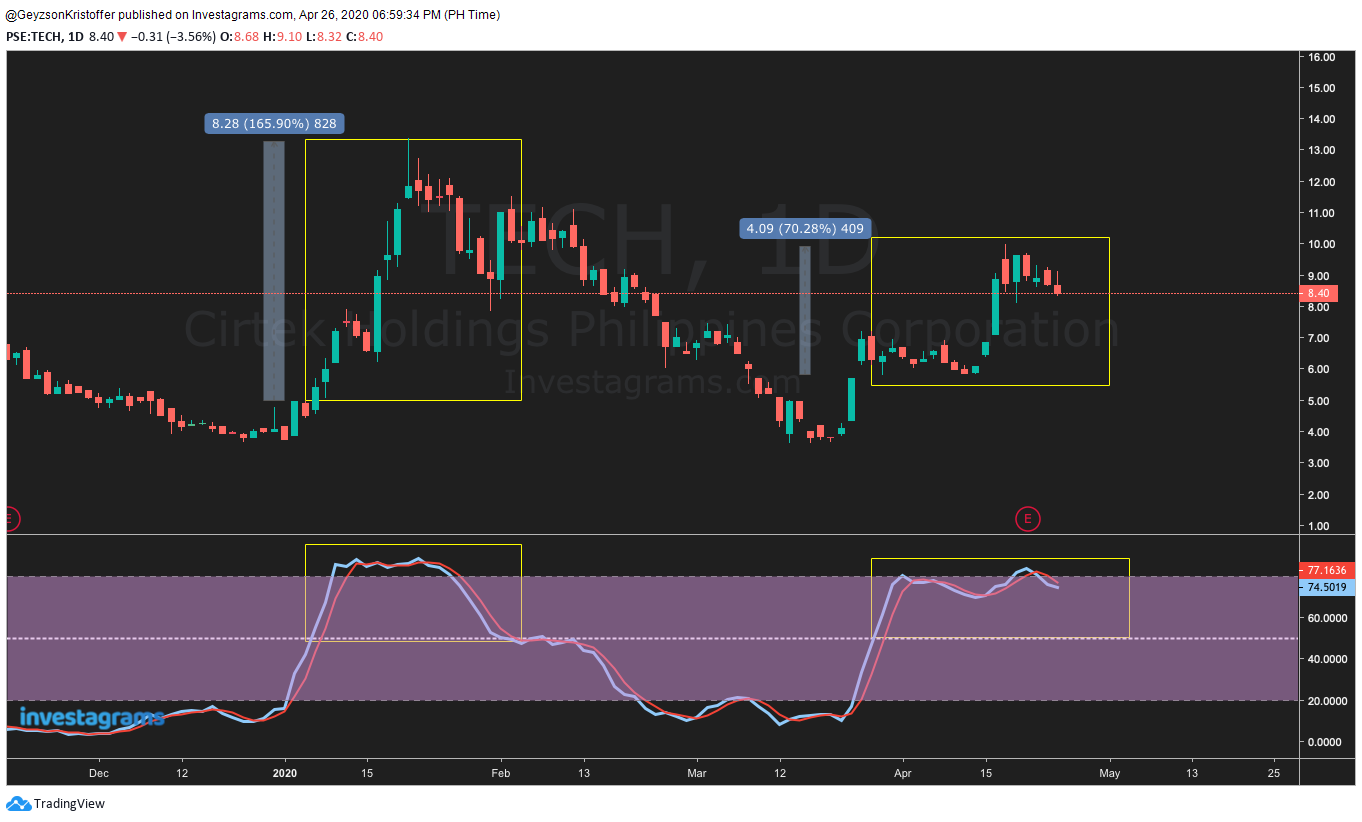
7. And finally, everyone’s favorite – $TECH with a 165% and a 70% gain.

After filtering, the only thing left for you to do is to find an entry and exit trigger!

In Conclusion

Stochastic and Stochastic RSI are strength indicators that oscillate between a period of weakness to a period of strength. To use this to your advantage, only trade stocks when their stochastic value is above 50. That will give you an assurance that what you bought has an underlying strength in it. As we all know, no indicator is fail-proof, Stochastic and Stochastic RSI are no exception, that’s why we should always use proper risk management to stay in the game and have our winners make way bigger money than our losers.

“Success usually comes to those who are too busy to be looking for it.”
– Henry David Thoreau


Contributor:

Full Name: Geyzson Kristoffer S. Homena
Investagrams username: @GeyzsonKristoffer

Channels:
www.facebook.com/GeyzsonKristoffer
www.investagrams.com/Profile/GeyzsonKristoffer

About the Contributor:

An Applied Mathematics graduate and a full-time teacher, Geyzson Kristoffer is a part-time trader who has been an active user of Investagrams since 2017. He spends his mornings, afternoons, and evenings learning about trading and reading books: Alexander Elder’s Trading for a Living being his favorite. Cohering to his passion and profession, he set his heart on teaching and helping newbies, but only the dedicated ones.


Categories
Featured How to & Advice

New Ways to Earn During the New Normal

This pandemic is a global disruptor. COVID-19 changed our lifestyle. We are now more health-conscious. We are giving more attention to our hygiene and to the food we eat.

It also changed our perspective about life. We are still horrified about the increasing number of infected people. In just a few months, we saw how easily our loved ones can be taken away. Thus, we are now giving more value to life and to our relationships.

Along with all these drastic changes, another daunting fact about this pandemic is how it affected our livelihoods. In just several days, many workers were laid off. Many businesses closed down. Many are now depending on the government welfare program.

A pandemic removed our freedom and our agency — to move and to create wealth.

Now that this is our new normal, we must also do new things to cope. Because if we don’t innovate, we evaporate. If we don’t adapt, we die.

Here are some simple ways to earn during ECQ. And as we enter the new normal, perhaps these are the future of doing business.

Mobile Palengke or Pasabuy

We were almost paralyzed when the public transport was cut in the hopes to restrict the infection. Unfortunately, not everyone has a private vehicle. Therefore, only a few can run errands and buy their food supplies. This may be a depressing problem, but it can be an opportunity to earn.

If you have a private vehicle, why not be the mobile palengke of your neighborhood. If you and your neighbors have a group chat, initiate the “pasabuy”.

As you buy your own stash of food, ask them if they also want to buy something and you can deliver the product straight to their doorstep. You can charge a fixed rate for every errand or you can mark-up the goods.

Your neighbors will understand that they are paying you a small amount of convenience fee and hazard pay for braving the streets despite the virus.

Mobile Drugstore

For sure, you have neighbors who are retirees or senior citizens. Because our beloved seniors are the most vulnerable to this virus, they can’t go out to get their maintenance medicines.

You can help them by getting their prescriptions and by going to the drugstore for them. This business idea adopts the concept or the model of the mobile palengke. So, you can also charge a small fixed rate whenever you run their errands.

Internet for Rent

Because most offices are closed because of the pandemic, many have switched to the work-from-home (WFH) setup. However, not all have an internet connection. Many WFH employees resort to availing expensive yet limited data plans.

If you have internet at home and if you want to help your neighbors transition from office to home, why not consider renting out your internet connection. You can compute how much they spend on data and charge them less than what they are originally spending.

If your connection does not reach your neighbor’s home, why not consider having a home computer shop. Your neighbor can bring his laptop or gadgets at your home and connect to your internet. If you have a spare laptop, you can also rent it out so you can help your neighbor still work on his shift and avoid being laid off.

Food on Demand

Restaurants may be closed for now, but celebrations do not stop. Many have already celebrated their birthdays while on quarantine. Many are also craving for restaurant-quality food to just have a break from the ordinary “lutong bahay”. This craving can be another opportunity to earn.

Post your menu on social media. Use mouth-watering visuals to further lure your customers. Do not forget to indicate that you can deliver the food to their homes so that home quarantine cannot hinder them to celebrate life events.

Even if there are no celebrations, you can market your food for simple gatherings such as home quarantine movie night or weekend e-numan.

Online Professional

We have seen offices closed down because of one move from Mother Nature. Therefore, people are now realizing that having an office job is not enough. We really need multiple streams of income to help us financially secure our families.

As businesses close, we have seen the power of the internet. We have realized that most work can be done online. We have witnessed that there are unlimited opportunities on the internet, we just need to have the eye to spot them.

If you have an internet connection at home, try getting into online jobs. If you know how to write copies or articles, try being a copywriter or a blogger. If you have strong clerical skills, consider being a virtual assistant. If you know how to teach, there are many online tutoring companies that are currently looking for online teachers.

Learn to Invest for the Future

ECQ is also the best time to learn about the stock market. You have all the time in the world to read and watch informative videos about the market. The stock market has closed for some days in the first month of the ECQ, but we have seen that it is one of the spaces that are still fighting and helping people earn in the midst of a virus and an economic crisis. We just need to learn how it works and how to make a profit from it.

This is the new normal. Tough times, but we must be quick in adapting into the changing times, or else our families will not survive. Remember that a crisis can be disheartening, but it also offers a lot of opportunities. We just need to be attentive to where the crisis is leading the market and be ready to seize those opportunities.

Do you want to know how to quickly cope with the new normal? Do you want to financially protect your family from any crisis? Join the Investa Online Summit today. Register here: www.investagrams.com/investasummit

Categories
Featured News & Features

Investagrams’ Most Helpful Trader of the Week: Billy

“Tulungan tayo sa Investa.”

Sense of Community — this is something that we would love to instill in Investa. We would love to see newbie and experienced traders interact and help each other. No shaming, no hyping or bashing, just learners passionate to learn together and from each other.

With this, we want to acknowledge those traders who have been fervent in their learning. For this week, we want to congratulate Billy a.k.a. @billyverse for being an eager learner that stands out in the Investa Community.

Billy is just a month-old on the platform, yet he shows a distinguishable hunger for learning that inspires newbies like him to be proactive in their trading process.

While he boldly asks around for stocks, books, company info, and other recommendations, he also suggests informative resource materials to guide novice traders in their journey to be, one day, confident in their trading executions.

He takes advantage of the free learning tools available in Investagrams platform. He devours information from InvestaDaily and InvestaLearn to sharpen his skills so he can be a better trader.

“Ask around sa mga bihasa na anong good books to read or video training dito sa @investagrams para un [yung] pera mo hinde maging tuition fee… Kaya un [yung] gigil mo ilagay mo sa pag-aaral then for sure mahit mo din.”

“Ask the experts about which good books to read or the video trainings to watch here in Investagrams so your money will not become your tuition fee… Put your passion on learning to hit your goals,” said Billy in one of his posts about the newbies riding the hype instead of persevering in learning the ropes of the stock market.

Billy’s goal is to reach his first Billion Pesos in less than 20 years. He understands that what he wants is not an easy thing to do. It entails a lot of hard work, yet he is willing to sacrifice his time to learn and practice his craft.

To help you, Billy, achieve your goal, Investa is giving you a month-long InvestaPro access. We hope that you will continue to be hungry for learning and be an inspiration to others to be passionate learners as well.

Good luck and Godspeed!

Categories
Featured How to & Advice

The Importance of Backtesting

As we started our trading career, our focus is all about making profits. We searched for the What, When, and Where rather the How and Why of trading and investing. As we progress and dig deeper, we eventually stumble to this word which many veterans mostly talk about — BACKTESTING.

What is Backtesting?

Backtesting is simply testing a trading/investing strategy, plan, and rules in the historical data.

Why is Backtesting Important?

As you might already know, one of the components to be a consistently profitable trader is you must have an edge on the market. A trading plan if repeatedly executed will yield a constant profit on your desired timeframe. Some traders can achieve this through a repetitive process of losing money, experimentation, and switching mentors/coaches. Through time, they gain the experience and knowledge that can personalize the summation of the process then compile it to become their own edge.

However, this might take years and an ample amount of tuition fees that you will be giving to the market.

Backtesting will help to minimize that learning curve by testing the trading plan in the historical data of the market. No matter where the strategy came from, it is best that you test it first to check if it is in accordance to your personal goal, style, and availability. This will give you confidence and conviction that your trading plan might yield positive results in the future.

How Does Backtesting Work?

1. You need a precise trading plan that you must commit in testing.

For example:
Entry: Buy at the end of the trading day whenever a Hammer Candle bounce at EMA50
Trail Stop/Profit: Sell 1% below the lowest resistance area
Cutloss: Sell whenever Price is 3% below the EMA50
Risk to Reward Ratio: At least 2
Portfolio Sizing: Max 20%

Note: Any changes in the rules will reset your backtesting process.

2. Open a chart, select a market, and select a date when you will start your testing. It is highly advisable that you check more than 5 years of historical data so that you can capture different kinds of market trends and cycles.

3. Refrain from having a bias at any point of the testing. It is much better to have a bias in finding trades that will disprove your trading plan.

4. Record the data you acquired from your testing process.

5. If you are satisfied with the profitability and accuracy, you can now start to test it out in the actual market by virtual trading or putting on small bets. If not, do the process all over again until it satisfies your desired edge.

Note: It is good to start with a single and simple strategy then slowly adding your desired indicators to filter out your set-ups.

3 Ways of Doing Backtesting

1. Manual Backtesting

The most common way in testing the market. You will manually check the charts of the desired market and list down the data that you will gather in the process.

Advantages:
1. By running through the charts, you will be able to recognize the patterns, DNA, and fractals of the market.
2. It will help you get familiar with the weaknesses and strengths of your trading plan.
3. It will help you gain more confidence in trading the actual market.
4. This will help your approach to trading to be as automated as possible.

Disadvantages:
1. You might have a bias to your strategy especially if you are tempted to check the later part of the chart.
2. This is a long process that might take you months or years to master.
3. Prone to biases and errors.

Tip: You can use the InvestaJournal to store your backtested data.

2. Automated Backtesting

There are applications or programs that will do the testing on your behalf. Some might require you some skills in programming language to be able to test your desired strategy or specific trading plan.

Advantages:
1. Quick way to check if the strategy has an edge.
2. Precise and accurate based on the exact data you input.
3. You will be free from bias and errors.

Disadvantages:
1. You might not recognize the market’s patterns, DNA and fractals.
2. Most of the applications are costly.
3. Requires programming skills.
4. Most softwares are for Forex or Foreign Markets.

3. Semi-Automated Backtesting

There are applications or programs that will assist you in your backtesting process. Some programs may either record data of your manual testing, giving you the feel of the actual market fluctuations or automatically compute your strategies’ edge. One example of this is Investagrams’ Backtest.

Advantages:
1. Same advantages as Manual Backtesting.
2. Faster than Manual Backtesting.
3. Biases and errors will be lessened.

Disadvantages:
1. Slower than the Automated Backtesting.
2. Has scenario restrictions depending on the program.

In Conclusion

Backtesting is one out of countless steps to becoming a consistently profitable trader. This is a good foundation in building your confidence in executing your trading plan especially in times of drawdown.

Past results are not determined by future results, but history repeats itself especially in the market because it is driven by human emotions. Equipping yourself with the edge of Backtesting will at least give you the stamina to finish this marathon.


Contributor:

Full Name: Jan-Angel Echano
Investagrams username: @Soral
Channels:
www.investagrams.com/Profile/soral
www.facebook.com/soraltrading
www.twitter.com/SoralTrading
www.instagram.com/jan_soral/
www.anchor.fm/soral
www.youtube.com/c/SoralTrading

About the Contributor:
A passionate trader who aims to share the reality, the HOWs and the WHYs in trading. My goal is to help traders and investors like me to continuously improve and refine our skills to the path of mastery.


Categories
Featured How to & Advice

How to Create a Trading Plan

Whether you’re a newcomer or a veteran in the markets, no one is excused from not having a trading plan.

As traders, we are operating in a boundaryless and limitless environment where we have the opportunity to create our own wealth and achieve financial freedom, but there is also the possibility of financial ruin. Not creating a trading plan can be one of the factors that can lead to continuous losses and forced trades.

It may sound cliche, the need to create a trading plan, this is something we’ve been hearing everywhere since the early stages of our journey. You see it in books, blogs, articles and you hear people talk about it in videos, seminars, and so on. The reason why it’s such a cliche, just like cutting your losses small and letting your winner run, is because that’s how it works and it’s about consistency over the long run.

ADVANTAGES OF CREATING A TRADING PLAN

Creating a trading plan allows you to mentally prepare yourself for what may happen in the coming days. Remember, you will need to create your trading plan for a specific stock at least the night before you plan to trade it. This is so once the times come when the price reaches your entry points, all you have to do is execute your plan. If you plan the trade on the spot, you’re basically making impulse decisions.

The only way to make a trading plan meaningful is to actually execute on it, there’s no point in creating a plan if you always bypass your own rules. Executing on your plan without reservation or hesitation builds discipline over time, and you will definitely need this if your plan is to stay in the markets for a long period of time.

Another thing you need to remember is to “plan your trade, and trade your plan.” If you don’t create a trading plan for a stock and it suddenly goes up 20%, even if it’s part of your strategy, you should have the self-control not to trade it. This will build the discipline to always scan thoroughly for opportunities the night before.

DISADVANTAGES OF NOT CREATING A TRADING PLAN

Now, what happens when you fail to create a trading plan? You get a lot of forced trades, unnecessary losses, and a ton of impulse moments which will lead to you making emotional trading decisions; and we already know that you shouldn’t let your emotions affect your trading.

Some of you may be thinking or have experienced first hand buying a stock that didn’t have a trading plan and having it go up 20%, 50%, or even more. But here’s the thing, do you want to be rewarded by doing bad habits? The market may bail you out a couple of times, especially if we’re in a bull market, but eventually, those who don’t do the right things will be humbled.

You will experience occasional equity spikes from a few lucky trades that go up significantly, but if you continue to take impulse trades then over time your equity curve will continue on its downtrend. The consistency all traders seek in the market will not come to you if you don’t have a solid plan to take advantage of opportunities. Trading success is not a sprint, it’s a marathon. You don’t have to be a millionaire next week.

HOW TO CREATE A TRADING PLAN

The following are the key points you will need in your trading plan:

1. ENTRY. This is the price where you will make your purchase. You can have more than one entry (buying in tranches).
2. STOP LOSS. This is where you will sell your position at a small loss at a predetermined area.
3. POSITION SIZE. This is how many shares you will buy.
4. TARGET PROFIT / TRAIL STOPS. This is a predetermined price where you will sell your shares at a profit. You can also set a trail stop to take advantage of bigger moves.
5. RE-ENTRY CRITERIA. Some stocks may stop you out, but this may just mean you’re a bit too early. Have a re-entry plan just in case the stock meets your buy parameters again.

CONCLUSION

There you have it! Mga ka-Investa, always remember that having the discipline to create a trading plan is a necessity for future trading success and consistency. At the end of the day, we need to properly prepare ourselves to take advantage of the opportunities in the market the right way to achieve consistency in the long term.

Categories
Featured News & Features

Featured Forecaster: Napster a.k.a. @napconmigo

When Investagrams was just starting out, the social feed was full of analyses of countless traders on different charts. But through the years, our social network aspect of the platform has been an avenue for traders and investors of all levels to share their thoughts, inputs, and analysis on different stocks and recently on different asset classes like Cryptocurrency and Forex.

As we continuously find ways to further improve the platform, our team is also looking on how we can improve the social networking side of the platform. Seeing that majority of the users share their thoughts on different stocks, we believed that a great way to further develop the social feed was to track the analyses posted to see if it would have actually yielded a profit, and at the same time tracking the trade statistics of their posts.

This is why we developed the Investa Forecast.

All you have to do is to input which stock you would like to forecast, the entry price, cutloss, target profit, and recommended position size. Then select the duration of the forecast; if you’re seeing only a short swing on a specific stock the duration can be as short as a few days, and if you’re seeing a medium-term swing then you can set it to a few weeks or months. You can also choose between putting on a long or a short position.

In this example, we forecasted that $ALI would potentially reach our target price of 38.50 by the end of April 2020. The entry price is 33.50 with a stop placed at 31.50, with a recommended position size of 15% of the portfolio. To further explain the forecast, you can add more insights on top for everyone to see.

Once you’re done inputting all the necessary information, simply click ‘POST’ then this is what will be seen on the social feed. Now the other people in the community can also vote if they agree with your forecast, all they need to do is click ‘HIT’ if they agree and ‘MISS’ if they disagree.

Then once you’ve done a good amount of forecasts, you can see your statistics on your profile. You will know your average win/loss percentage, net profit, and hit rate. So aside from your own actual trading, knowing your forecast statistics is also a good way of identifying if your strategy is working well in the current market environment. You can also check the forecast statistics of other traders in the community (see example above).

For our first featured forecaster, we like to give a huge shoutout to Napster a.k.a. @napconmigo who has been actively using the forecast feature this past couple of weeks. One of his recent forecasts was a success in $URC, which yielded him an 8.74% gain, and the stock is still continuing to go up. This was definitely a great spot as $URC has gone up nearly 50% since the $PSEi hit near 4,000 levels.

Bluechips have definitely been the stocks to focus on these past two weeks. After bouncing for falling close to 80 pesos per share, $URC created a consolidation pattern which showed two potential entries. If you position yourself during the consolidation at around 100 pesos, you would’ve been up 21% by today. If you waited for the confirmation of the breakout, you would be up more than 10%.

Again, kudos to Napster a.k.a. @napconmigo for successfully forecasting the short term movement of $URC and for consistently using the Investa Forecast feature. As a reward, we will be crediting 100 Php to your InvestaWallet. For those who would like to be our next Featured Forecasters, simply use the Investa Forecast consistently and keep an eye on your forecast stats.

Categories
Featured News & Features

Investagrams Trading League 2020 Competition Rules And Mechanics

OVERVIEW

Welcome to the FOURTH YEAR of Investa Trading League!

Today we present to you another GREAT OPPORTUNITY to hone your trading skills while getting the chance to compete and win awesome prizes.

Investa Trading League is FREE and OPEN TO ALL. For this year’s competition, it will run for two (2) trading weeks from April 27 to May 8, 2020.

How to win the Investa Trading League?

The goal of this trading game is simple. After the first Stage of Investa Trading Grounds (ITG) Competition, each daily winners who were able to reach the TOP 10 DAILY LEADERBOARD from April 13 to April 26 will be added to the TRADING COMPETITION ROOM and they will be part of the Investa League Competition. Find opportunities and trade your best to gain the most profit and have the highest total account value at the end of two (2) trading weeks!

Winners and Prizes:

The top three (3) participants with the highest account value at the end of the trading round will be announced as the winners.

Each league’s winner will receive a corresponding cash prize as follows:

1st Place: Free Basic Ticket to Investa Online Summit | 5 months access to InvestaPro
2nd Place: Free Basic Ticket to Investa Online Summit | 3 months access to InvestaPro
3rd Place: Free Basic Ticket to Investa Online Summit | 1 month access to InvestaPro

MECHANICS

1. Trading League will be accessed through the Investagrams Virtual Trading Platform (https://www.investagrams.com/vTrade) and participants will start with Php 100,000 virtual money to trade.

2. Participants can only trade liquid and actively trading stocks (we have filtered out which stocks fit this criteria) and have taken out illiquid names that have wide spreads that can be easily abused. The whole stock list can be accessed once you are accepted in the competition. The tradable stock list can be changed

3. Upon buying a stock, you can only sell it after 20 minutes. This will protect the competition against ‘rinse-and-repeat’ abuses on illiquid stocks that are not realistically in-line with real market mechanics.

4. To promote diversification, maximum exposure in a single stock can only be 1/3 or 33.33% of the portfolio. This requires the participant to buy at least 3 different stocks should they want to fully invest their portfolio. The system won’t allow you to allocate more than 33.33% in a single stock.

5. Buying and Selling Conditions. Participants now have two options when transacting. The first option is to transact using the current price of the stock and use market orders to buy and sell specific stocks at their real-time prices. The second option is to transact using our new LIMIT ORDERS. By using Limit Orders, you won’t need to watch the market the whole day in order to transact in the market.

  • Buy – You can buy the same stock multiple times within a day.
  • Sell – You can only sell the same stock two (2) times in a day. This will be strictly observed in order to avoid abuse. This includes selling in TRANCHES. Example: If you bought 1000 shares of $SMPH at 39 then sold 300 shares at 39.10, then you have only one (1) sell transaction left for $SMPH within the day.

6. Holding period for all stocks

  • Initially the twenty (20) minute time lock was only for stocks PHP 3.00 and below. However, due to the illiquidity of the market and behavior of some participants, we will now be applying the twenty (20) minute time lock for taking profits to ALL STOCKS. Again, this is to avoid widespread and rinse-repeat trades. There are instances where specific names are simply bought due to the 2-2.5% widespread sold after 5 minutes once the stock has been ticked up.
  • There will be no timelock or restrictions when selling at a loss.

7. Revision of Tradable Stocks. Investagrams has the right to remove any stock from the list should it suddenly become too illiquid, abusable and/or delisted. Furthermore, Investagrams may also add new stocks on the tradable list as new stocks become more active and tradable in the market. All changes will be announced before implementation.

In such cases that a stock is to be removed, we will follow this process:

  • Investagrams shall notify all the participants via the Investagrams Platform before the market opens.
  • If you still have the stock in your portfolio, you can sell it at any point in time at your discretion.

8. For stocks that will be detected by our WIDE-SPREAD DETECTION SYSTEM (WSDS). The Wide-Spread Detection System’s main condition is that the first (1st) best bid and ask should never be more than 2% at any moment during open market session.

Fig 1. Real-time Market Depth / Orderbook showing the first (1st) best bid-ask data.

Example: $ATN (Refer to Fig. 1)
Given:
1st best bid = 1.11
1st best ask = 1.14
Formula:
X = (1st best ask – 1st best bid) / 1st best bid
Condition:
If X is greater than 2% then WSDS detects that the stock is wide-spread and can be abused.
Solution:
X = (1.14 – 1.11) / 1.11 = 0.02700 x 100% = 2.70%

Verdict:
Since X is greater than 2% then the stock is wide-spread as computed by the system.

  • The participant will be given a prompt that the detected stock is not tradable upon executing a buy or sell transaction.
  • The stock will again be tradable once the system detects that the spread of the 1st best bids/asks are below 2%.

9. Trading Halt. Stocks that are on a trading halt will not be tradable during the halt and will be tradable again during the announced lifting time.

10. Trading Hours: Weekdays from 9:30AM – 1:00PM (This is the current PH trading hours and will be changed once the enhance community quarantine is lifted. Meaning, you can’t trade during off hours and on weekends.)

11. Participant rankings are constantly updated every 10-minutes and automatically ranked by Investagrams system according to net profit gain/loss.

12. At the end of the competition, the participants with the highest net profits will win. The top 1 to 3 participants shall be announced the official winners.

13. Joining the Investagrams Trading League 2020 means that you agree with all the clauses mentioned above.

Good luck, traders!

Subscribe to our Newsletter

Join our mailing list for investing tips and stock market advice
to help you reach your first million.

You have Successfully Subscribed!