@myholdings takes the spot for this week’s featured trader! A member since 2021, our featured trader is currently seen actively navigating the markets and saw a potential breakout on $SMC wherein support and resistance (or S/R) were used to see a falling wedge pattern. Further confirmation of the downward price momentum slowing can be seen through the Relative Strength Index (or RSI) as well.
With $SMC having multiple signs of a bullish direction, the stock had a successful breakout and has seen an increase of about 23% in the past week.
Let’s take a look at how @myholdings used this reversal pattern to his advantage.

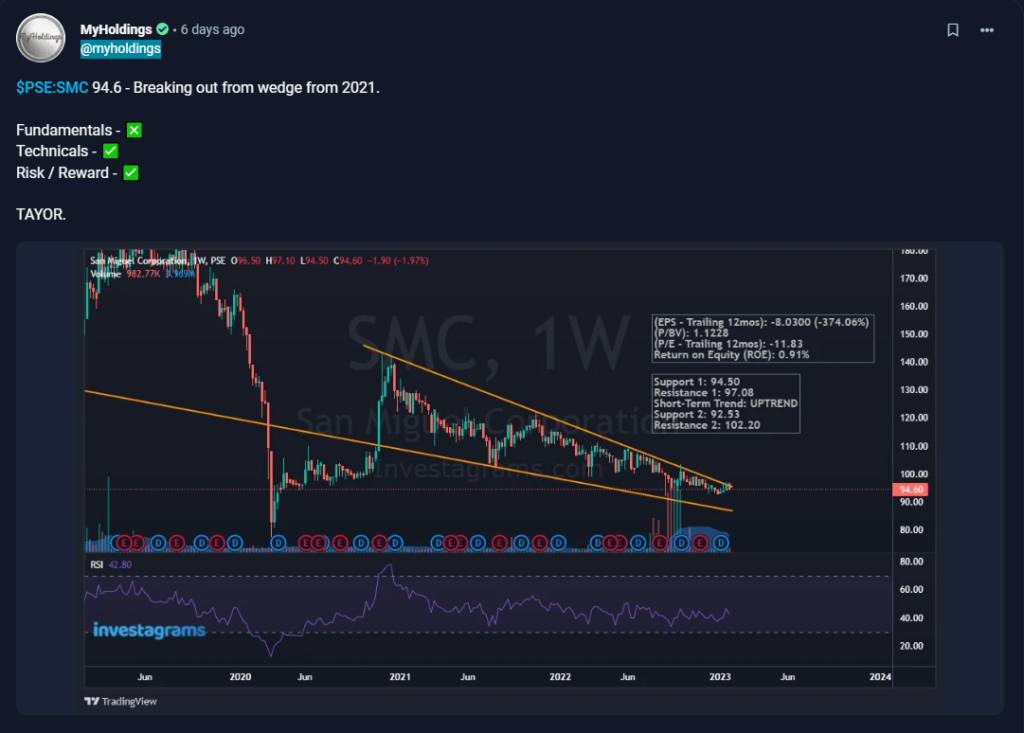
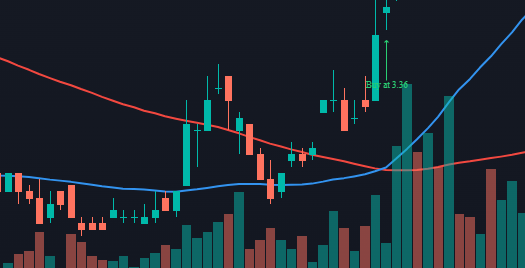
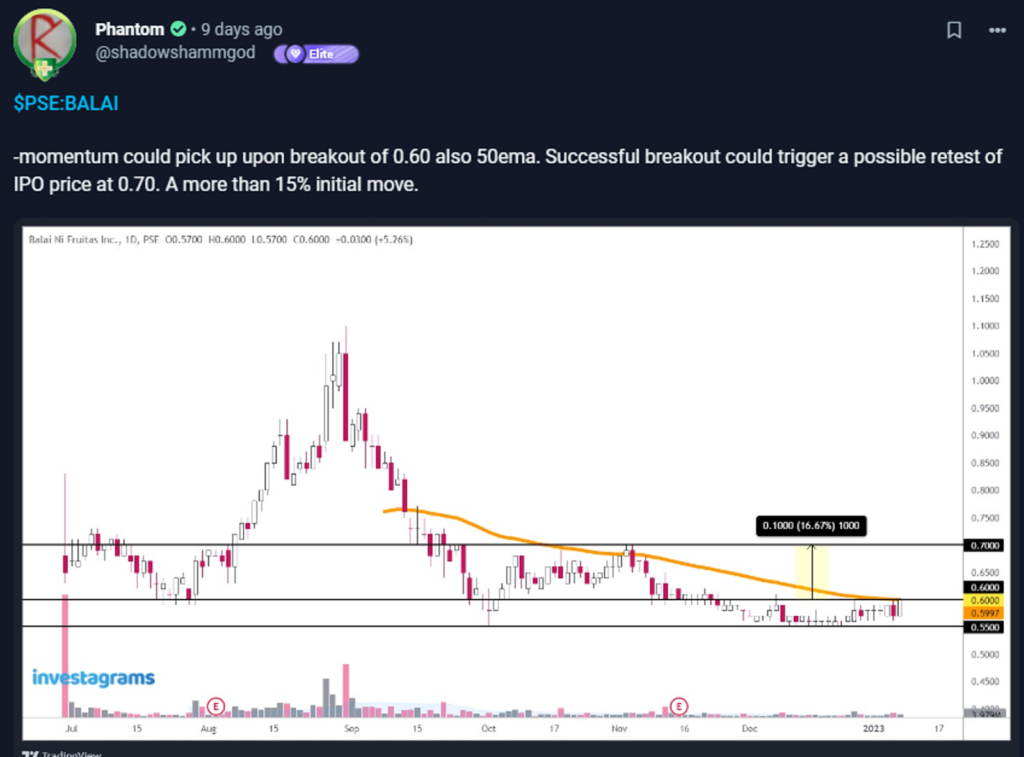
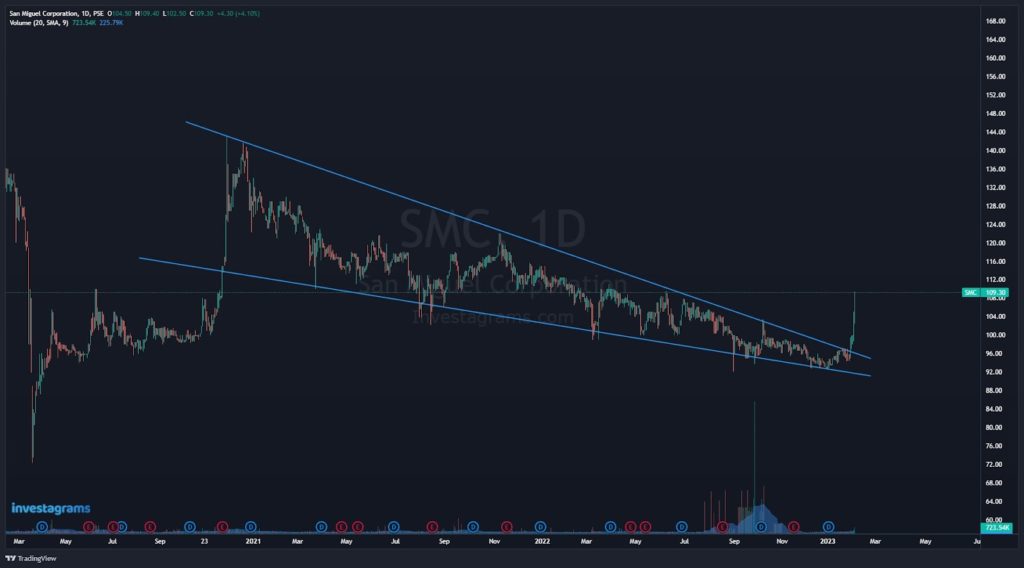
@myholdings used S/R to detect $SMC’s falling wedge pattern. Its potential breakout can also be backed by the relatively low RSI. The post also indicates other helpful details such as added fundamental and technical analysis, which provides great help and additional insights. At the time of @myholdings’ post, $SMC is priced at the 94.60 level and was trying to break through the local resistance at the 97 level. With its current successful breakout, $SMC is now trading at around the 116 level and has seen an increase of about 23%.
TECHNICALS OF THE TRADE

A falling wedge is a form of reversal pattern that happens when a stock’s price action continues lower, with the trend lines converging as the price approaches the bottom. This confluence of trend lines is interpreted as a bullish indicator, indicating that the stock is expected to reverse direction and move upwards. The falling wedge is a bullish pattern because it indicates that the downward momentum is decreasing and a possible upswing is brewing.
As we can see, patterns in stock trading are essential in technical analysis because they may assist traders and investors in identifying trends and making educated trading decisions. Traders can make accurate forecasts about future price changes by spotting patterns in prior price movements and planning their transactions appropriately.
@myholdings paired this with a low RSI reading which suggests that the $SMC has been oversold and that the downward price momentum may be slowing. Traders and investors may interpret this as a potential buying opportunity and consider entering into a long position.
FUNDAMENTALS OF THE TRADE
The most recent post of San Miguel Brewery Inc. (SMB), the flagship beer business of San Miguel Corporation, indicated a 15 percent growth in net income to P16.2 billion from the P14.1 billion earned. SMB reported strong domestic results, with further relaxation of restrictions beginning at the end of March 2022, paving the way for the re-opening of on-premise outlets.
This was aided by efficient volume-generating initiatives and marketing campaigns implemented by its many brands across traditional and modern trade channels. As a result, overall domestic sales in 2022 reached P88.4 billion, up 19 percent from 2021.
SMB’s overseas businesses also continued to operate well, with greater volumes in the first nine months.
This was attributed to consistent volume gains in its Thailand, Indonesia, and Export operations, despite pandemic restrictions in the Hong Kong, South China, and Vietnam markets.
WHAT SHOULD BE MY NEXT MOVE
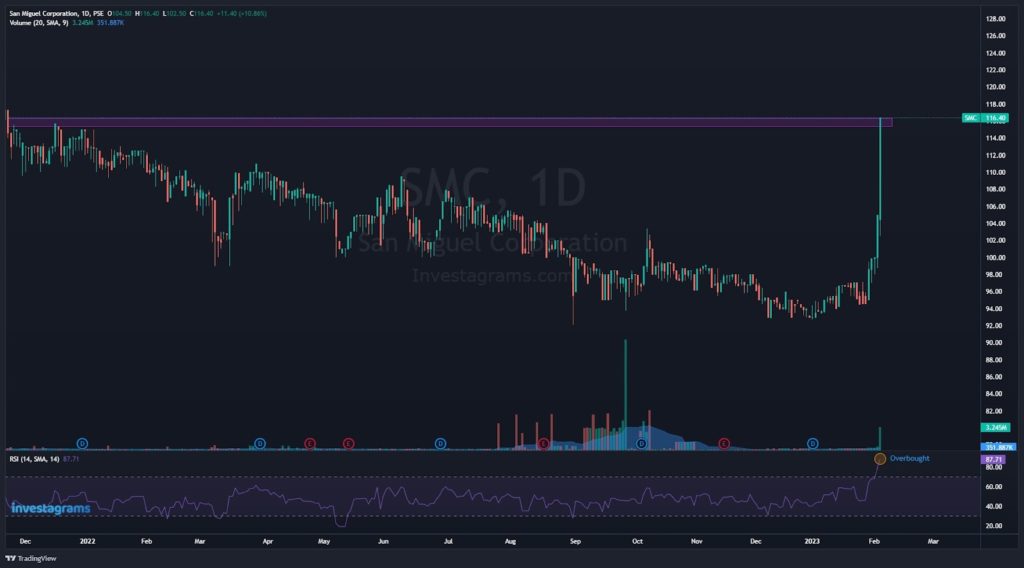
At the time of writing, $SMC is currently bumping on a resistance level around the 116 levels. Since the RSI is indicating overbought signals, a potential pullback may happen. It’s crucial to remember that pullbacks can lead to greater declines, so it is advised to utilize proper risk management techniques, such as setting stop-loss orders, to prevent possible losses.
Once again, KUDOS to @myholdings for being this week’s featured trader! Enjoy your 14-day InvestaPrime Access and continue to be an inspiration to the trading community.
Find your next big trade using INVESTAPRIME’S LEADERSHIP RANKING
No more need to spend countless hours scanning through multiple markets to find the strongest stocks or tokens. You can now easily find the outliers in the PSE, Crypto, Forex, Commodities and US markets. Get full real-time access by subscribing to InvestaPrime.