As Larry Williams once said, “Simplicity is the hallmark of a great trader”.
Godlike, a.k.a. @imperno, takes the spotlight for this week’s featured trader! Read how she used simple support and resistance (or S/R) to not only spot a potential breakout in $DITO, but also to determine a clean exit point.
Let’s take a look at how Godlike used this indicator to her advantage.


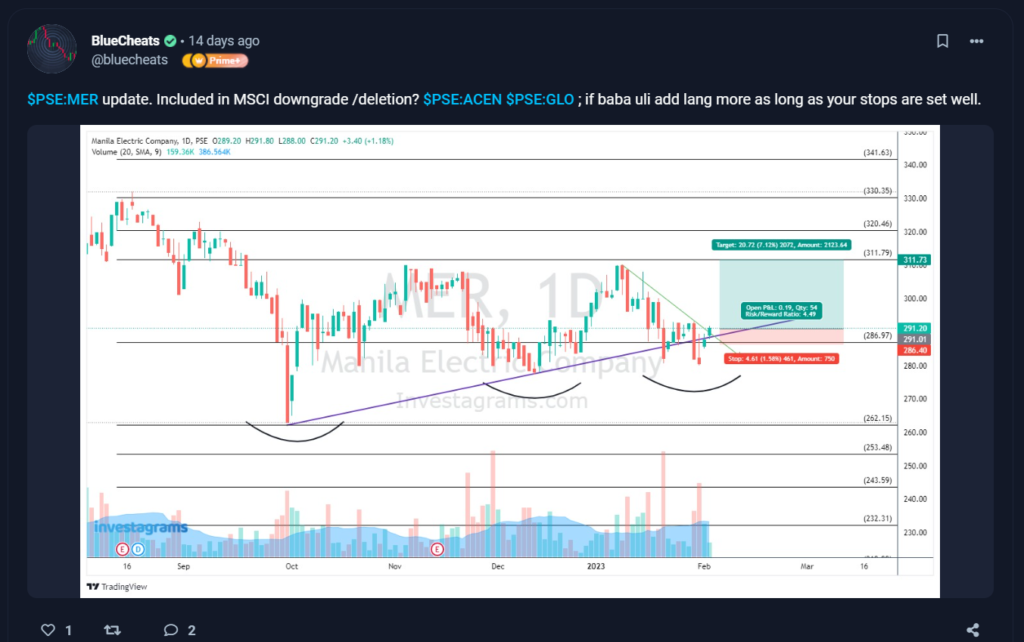
At the time of Godlike’s post, $DITO was trading at the 3.20 level. Godlike saw that if the forming lower highs were to be broken, the price could potentially rally and only slow down in momentum upon reaching its next resistance at the 3.50 level, which can be used as an exit point.
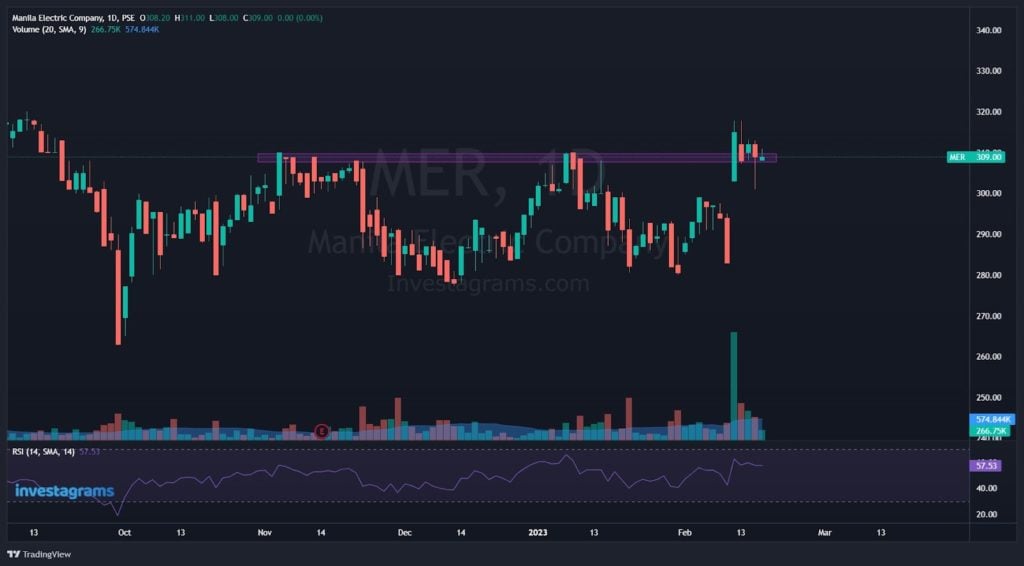
5 days later, the stock managed to break through the lower highs. Although initially a false breakout, the support level around 3.05 was strong enough to hold the price and propel the momentum upwards up to a total of an 16% increase from the lowest point of 3.04.
TECHNICALS OF THE TRADE

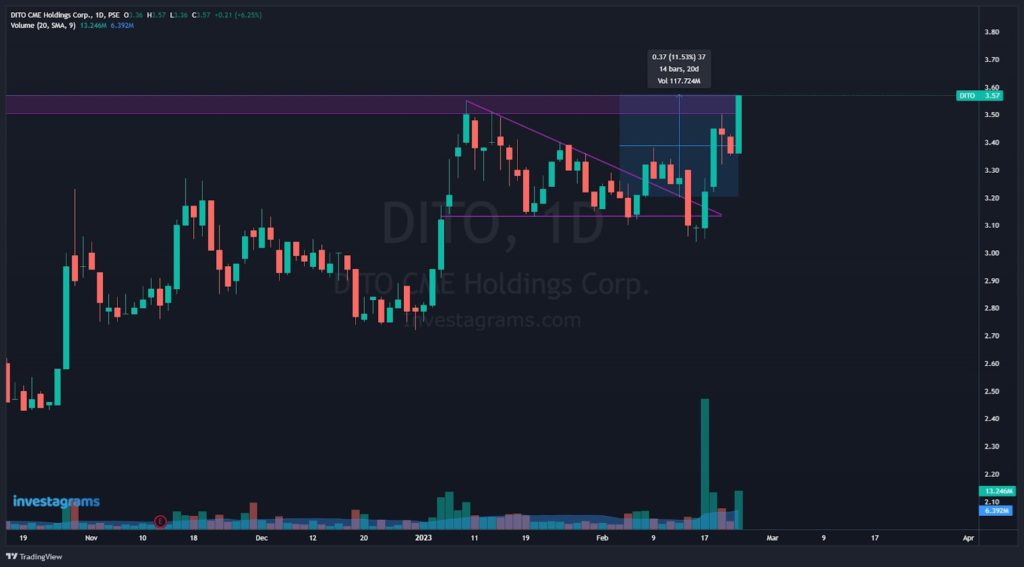
In $DITO’s chart, it can be seen that it is forming a descending triangle pattern. This is because there is a string of lower highs that forms the upper line, and the lower line is a support level in which the price cannot seem to break. Usually, price would most likely go down and eventually break the support line. However, such as in this case, the support line was strong, and the price bounced off of it, resulting in a strong move up.
Godlike used support and resistance in her trade to determine $DITO’s potential move and where it would be likely slowdown in momentum. Support and resistance levels are key in establishing breakouts and exit points since they show traders where the market will likely go. Just like Godlike, traders may better comprehend market dynamics and make more educated trades by recognizing necessary support and resistance levels.
FUDNAMENTALS OF THE TRADE
DITO Telecommunity received five awards at the recently held Marketing Excellence Awards 2022. Marketing Excellence Awards (MEA), a Singapore-based marketing communication awards platform in Asia, awarded DITO three gold awards: Excellence in Brand Strategy, Excellence in Digital Marketing, and Excellence in Social Media Marketing, as well as two silver awards: Excellence in Media Strategy and Excellence in Influencer / KOLs Marketing.
These awards were considered significant for DITO because the firm is still a rookie to the telecom market and a first-time participant in MEA since its commercial operations began in March 2021.
WHAT SHOULD BE YOUR NEXT MOVE
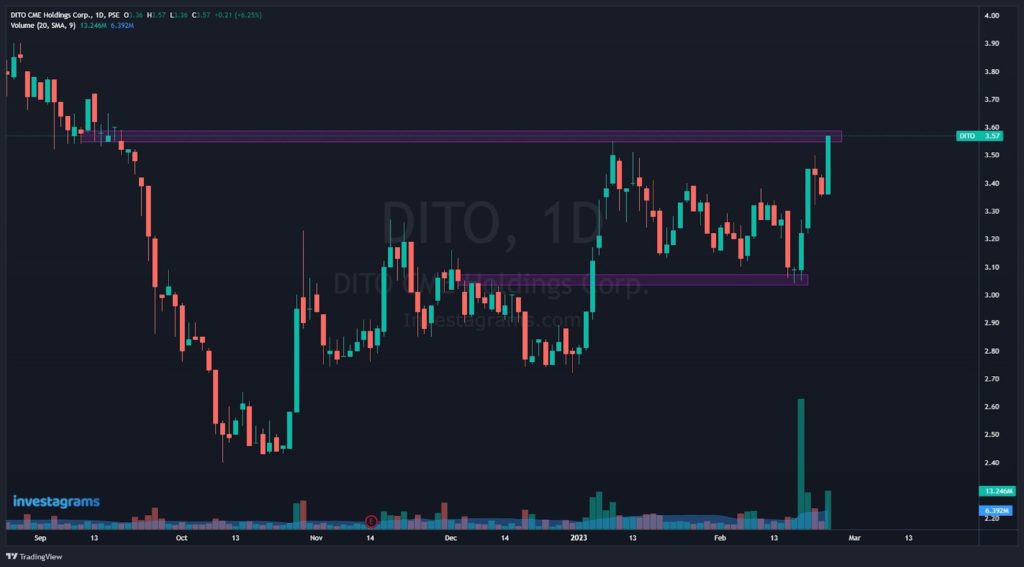
Currently, $DITO is hovering close to a strong resistance level. Despite the strong momentum, buyers should wait to see if $DITO can break through this level. It is advisable to wait for further confirmation of where the stock will go to avoid the risk of a potential pullback. Godlike demonstrated that keeping things simple with S/R levels can effectively make trading decisions. By identifying key support and resistance levels, traders can better understand market dynamics and make more informed trades.
Once again, KUDOS to @imperno for being this week’s featured trader! Enjoy your 14-day InvestaPrime Access and continue to be an inspiration to the trading community.
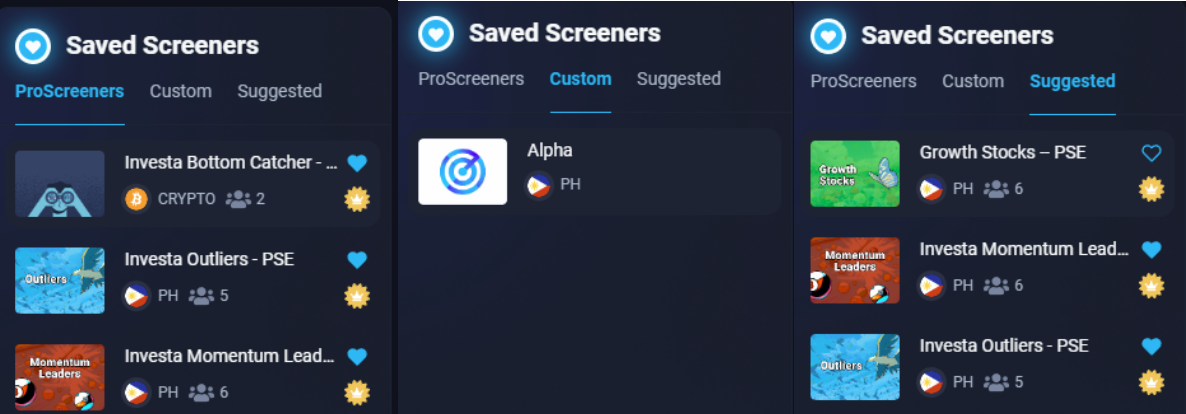
ACCESS MARKET LEADERS TODAY
Real-time access to our Market Leaders is where you can see all the leading stocks, crypto, forex and other markets in one glance.
This is calculated using Investa’s proprietary ranking system, which utilizes advanced parameters to identify the best stocks to monitor objectively.
GET YOUR ACCESS NOW!