Categories
Latest Posts

Market Risk Premium: Putting a Price on Risk

Although one of the prominent formulas in the financial industry, not a lot of traders are familiar with the term Market Risk Premium. While jargons and buzzwords like this usually make it seem difficult to understand, the Market Risk Premium is really just a simple formula:

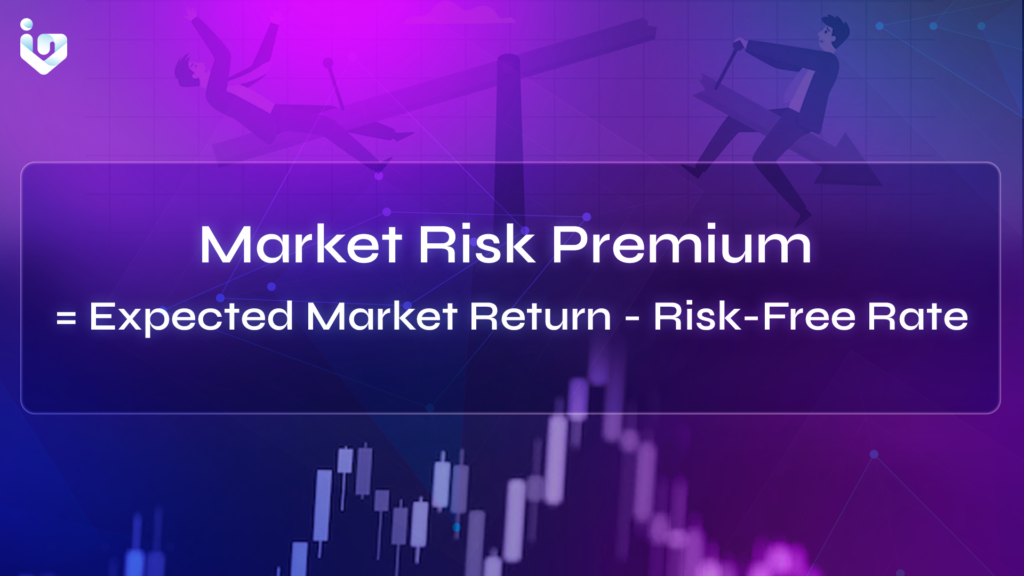
In a nutshell, the market risk premium is the measure of how much excess returns a portfolio gets from the market in return for the increased risk taken. Its application in the real world is widespread. Financial models and quantitative trading used by institutions usually take this into account.

UNDERSTANDING THE MARKET RISK PREMIUM FORMULA

First, we need to understand the components. Essentially all you would need are the expected market return and the risk-free rate. 

RISK-FREE RATE

The risk-free rate is the easier of the two to find. Traditionally, risk-free rates are based on treasury yields.

Source: https://www.investagrams.com/chart

The reason for this is simple: would you doubt the government’s ability to repay you? There is a very small chance of a nation’s default. However, the probability of it happening is so small for most cases that treasuries are considered virtually risk-free. If you’re not convinced about the safety of certain treasuries, you can change it with the returns of a “safer” asset. The rule of thumb is that the risk-free rate is ROI you can get with almost no risk

EXPECTED MARKET RETURN

The expected market return is where many start to have different opinions. Different groups and individuals will have varying opinions on this. Some may prefer using the Capital Asset Pricing Model (CAPM). Others might prefer using their own market valuation methods, using a custom slew of fundamental indicators. Whichever method is used, the gist is that the expected ROI from the market is used

MARKET RISK PREMIUM: HISTORICAL, EXPECTED, AND REQUIRED

The formula can also reflect the historical, expected, and required market risk premium. In order to succeed in the markets, you need to have a holistic view. The historical risk premium can tell you how much excess returns market participants have demanded in exchange for increased risk. The expected market risk premium is an attempt at finding what the risk premium might be. The required market risk premium is where you start with the return you want and try to figure out the values of the variables. 

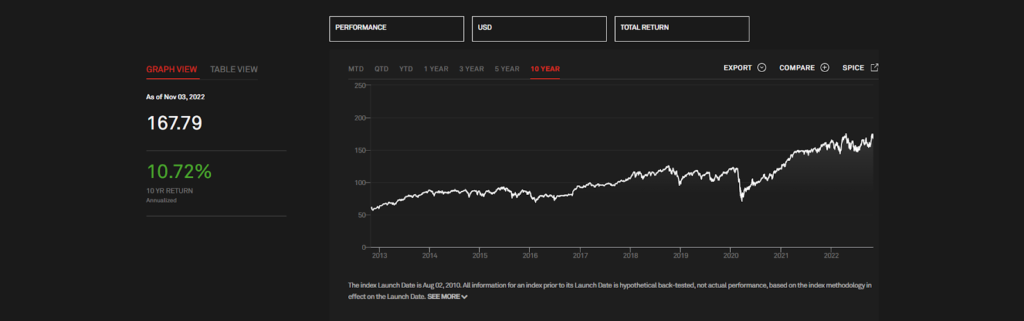
When you use the formula solely for equities, the name can be interchanged with equity risk premium. Over the past decade, subtracting the compounded annual rate of return of long-term US government bonds against the S&P500 yielded an equity risk premium above 10%. Basically, the market has been looking for 10% returns above risk-free rates over the decade.

Source: https://www.spglobal.com/spdji/en/indices/strategy/sp-us-equity-risk-premium-index/#overview

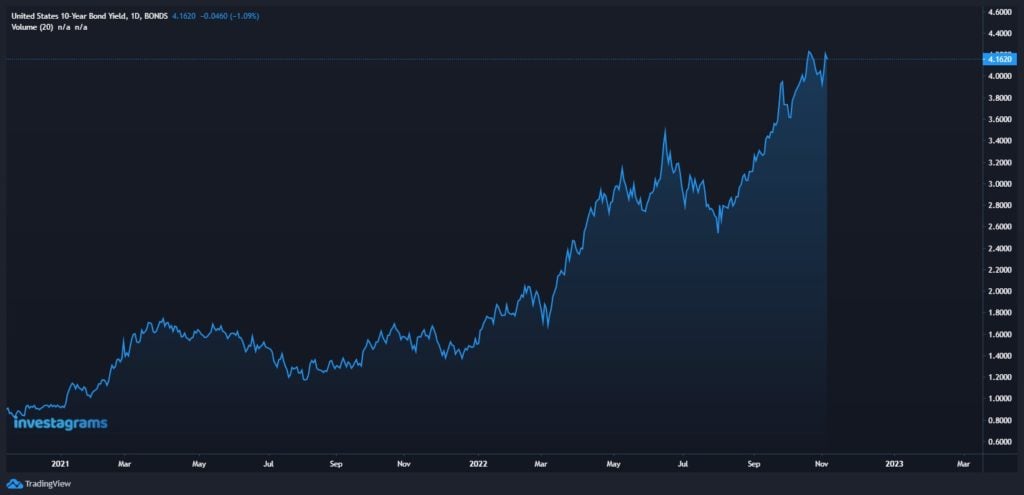
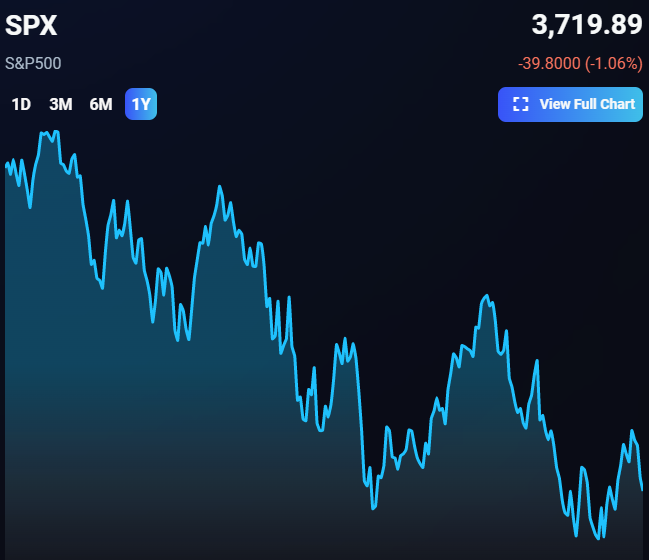
Throughout 2022, interest rates have been rising – causing treasury yields to soar. This has caused the expected equity risk premium to fall, swaying investors away from stocks. As seen below, US equities have been in a slump as treasury yields continue to rise. For investors who require a higher risk premium, they would rather wait for better conditions and more lucrative rewards before allocating funds.

Last Remarks

The gist of the market risk premium is that it helps investors find how big additional returns should be to justify investing in riskier assets. It’s important to note that there are a lot of other models and calculations used to price securities. However, understanding and knowing the market risk premium is an essential first step towards valuating assets. 

Want to learn more lessons to help you build a crisis-proof system? Check out the Investa Summit 2022: Opportunities in Crisis! Our world-class and industry-leading speakers will be giving you in-depth experiences and lessons on the bear market we’re facing, and how we can find opportunities moving forward.


Categories
Latest Posts

Featured Trader of the Week: @candlestocks

In a quote by Jaymin Shah, he says “Don’t blindly follow someone, follow the market and try to hear what it is telling you.” To become a successful trader, you should be able to do your research and due diligence. Expand your knowledge by studying the market and learning new strategies. Through this, you will be able to become profitable in the long run.

@candlestocks takes the spotlight for this week’s Investagrams featured trader as he shares his knowledge with us on stocks from the PSEI. Let’s take a look at how @candlestocks uses this to his advantage. 

@candlestocks gave his thoughts on $SECB and the potential course it might go after price action reached support levels

During this specific trading period, @candlestocks has plotted out a simple support and resistance line which will help guide where the price might retest. As shown above, the chart is heading in a bearish direction. We can also see an RSI, a momentum indicator, forming a bullish divergence pattern, which typically means that a stock is gaining momentum. Moreover, it also means that it can be a perfect opportunity to buy. @candlestocks has also informed us to expect resistance around the 95 levels. Typically, you would want to avoid buying around those levels as prices are most likely to drop. 

TECHNICALS OF THE TRADE

Technically, $SECB at the time was gaining a downtrend momentum.  But despite that, indicators have shown that a price reversal was possible First, we can see that price was at its support levels. As a trader, you would normally want to buy at this level as prices tend to bounce right back up. We can also see that the MACD has slowly shown signs of uptrend reversal. Moreover, as told by @candlestocks, the RSI formed a bullish divergence pattern, meaning that the price was most likely to bounce right back up. 

With all the information gathered and collected, @candlestocks was able to successfully make a good trade. He was able to anticipate the support line retesting, allowing him to earn about 9-10% in profits. 

FUNDAMENTALS OF THE TRADE

As officially disclosed on the PSE EDGE platform, $SECB has recently announced a declaration of cash dividends. The Amount of Cash Dividends Per Share will amount to Php1.50 per common share. The ex-dividend date is said to be on Nov 7, 2022. The record date will be on Nov 10, 2022. Lastly, the payment date for the cash dividends will be on Nov 24, 2022.

WHAT SHOULD BE MY NEXT MOVE

In the daily timeframe, $SECB seems to have more momentum to push the price even higher. It ended the week with a good close and volume traded. Moreover, it is expected to retest around the MA100 level. Looking at the chart, we can also see that it is right above the Fibonacci resistance of 0.5 (86.10), meaning that price is most likely to bounce right back up. Additionally, the declaration of cash dividends is also a good sign to buy $SECB.

Given this, it is preferable to set aside some cash to buy and hold this stock for the long term and the cash dividends.

Additionally, it would be wise to buy the dips without spending a lot of money considering the status of the market. Always do your research and stay up to date on news that is pertinent to the stock you have selected.

Once again, KUDOS to @candlestocks for being this week’s featured trader! Enjoy your 14-day InvestaPrime Access and continue to be an inspiration to the trading community.


Categories
Latest Posts

ADX: A Beginner’s Guide

Investagrams has a full suite of indicators for traders using technical analysis. Among them, the Average Directional Index (ADX) is a commonly used indicator. Trading with a strong trend lowers risk and boosts possible profits. Since the ADX can serve as the best trend indicator in many situations, it can be very useful for traders. Let’s deep dive into the details and use cases.

WHAT IS THE ADX?

Sample ADX graph

The ADX is an indicator that tries to quantify the strength of a trend. This is done by quantifying how much price ranges are expanding to one side. The indicator turns this into a number that we see on a scale from 0 to 100. It’s important to note that the ADX is non-directional. Meaning, it will only tell you how strong a trend is but won’t tell you in which direction.

READING THE ADX

The ADX can help you distinguish if the trend is fit or not for trend-trading strategies. For example, any reading below 20 would tell you there is no trend. It wouldn’t make sense then to use trend-follow strategies. A reading between 20 – 25 could tell you that there is a budding trend. While any reading 25 and above would indicate the presence of a clear trend. In these situations, you should be looking for continuation chart patterns.

$ACEN had low ADX readings while it was in a long consolidation. Once an uptrend started, ADX readings spiked.

When determining trend strength, the ADX line’s direction is also crucial. A rising ADX would translate to a trend gaining more momentum. Whereas, a falling reading means that the trend is weakening. A common misconception here is that a falling ADX translates to a reversal of the trend. However, in reality, it only really means that prices are pulling back. Hence, the trend losing some momentum. The rule of thumb here is that as long as ADX is above 25, you can still consider the current trend to be strong.

While $MAC’s ADX fell significantly, this was only due to its retracement. The trend was still strong and the stock continued on its uptrend.

USING THE ADX INDICATOR

While using the ADX would mostly be for identifying the existence and strength of trends, this can still be a very powerful tool within trading systems. For example, breakouts are easy to identify, but often times these breakouts can fail to advance. However, you can use the ADX to help you find legitimate breakouts. If it gives you the signal that a trend is present, then the probability of a continuation is strong.

Likewise, you can also use the indicator to identify if prices are just ranging. Breakout traders tend to have trouble in ranging environments. Although easy to avoid in theory, in practice ranging environments often cause traders to experience a “death by a thousand cuts.” When the trend has slowed and is entering ranging conditions, the ADX will give a signal. A reading below 20 will clearly indicate that prices are now just ranging. As such, it would be wise to switch to different strategies more suited for range trading.

LAST REMARKS

Generally, the ADX can be treated as a “supporting” indicator. The readings won’t give you buy and sell signals. However, it amplifies the signals you would get from other techniques. A significant advantage for traders is the capacity to find and measure trends. Being able to do so lets you identify which strategies will work best. It will also help you figure out when to be aggressive, and when to stay on the sidelines. Remember, trading is all about risk management and optimizing your risk to reward.

Want to learn more techniques and strategies to help you build a crisis-proof system? Check out the Investa Summit 2022: Opportunities in Crisis! Our world-class and industry-leading speakers will be giving you in-depth experiences and lessons on the bear market we’re facing, and how we can find opportunities moving forward.


Categories
Latest Posts

Featured Trader of the Week: @batangtrader29

Jodee a.k.a. @batangtrader29 takes the spotlight for this week’s featured trader as he shares his knowledge to us on stocks from the PSEI.

In a quote by Charlie Munger, he says “The world is full of foolish gamblers and they will not do as well as the patient investors.” By exercising patience, you can avoid responding rashly and making choices that could reduce your chances of gaining money. Additionally, it gives the market’s ups and downs ample time to balance themselves out, ideally leading to earnings that are satisfactory to you. Let’s take a look at how @batangtrader29 uses this to his advantage. 

@batangtrader29 gave his thoughts on $ALI and the potential course it might go after price action reached the demand zone. 

During this specific trading period, @batangtrader29 has plotted out a rising wedge pattern which typically indicates possible breakdowns in price action. We can also see an RSI, a momentum indicator, closing in its oversold levels (around 30) which typically means a stock is undervalued. Moreover, it also means that it can be a perfect opportunity to buy. The two green boxes that we can see in the chart are known as the demand zone, meaning it is the price area wherein traders usually buy. The 3 gold lines are known as the golden zone which are considered key retracement levels for a stock or an index. 

TECHNICALS OF THE TRADE

Technically, $ALI at the time was gaining a downtrend momentum. Five days after his initial post, @batangtrader29 has replied in the comments about where he expected the price to go. Because price has reached the demand zone, he expected massive buying actions around that area. Moreover, if we take a look at the RSI, it is below 30 meaning that it is a great opportunity for many investors to buy. Lastly, if we take a look at the chart pattern, we may notice that it is currently forming a double-bottom pattern. This usually means that there is a huge chance that the price will bounce right back up.

With all the information gathered and collected, @batangtrader29 was able to successfully make a good trade. He was able to achieve the forecast of meeting the rising wedge target as well as the demand zone reaction with bullish divergence. This earned him around 14% – 16% in total gains. 

FUNDAMENTALS OF THE TRADE

The first batch of charging stations will be made available in Ayala Land Malls and Estates, according to Ayala Land Inc. ($ALI), which is currently preparing to expand them out across the country’s residences. According to reports, $ALI and the energy platform ACEN Corp. finished baselining their greenhouse gas emissions, including Scope 3 emissions in their value chains.

WHAT SHOULD BE MY NEXT MOVE

In the daily timeframe, $ALI seems to be heading towards a resistance at PHP26. While indicators may seem positive, it is best to wait for the breakout. This allows you to properly execute a trade while at the same time, reduce the risk of having a loss. Moreover, it is best to keep a look out for disclosures on updates about their existing and current projects. 

Given this, it is preferable to set aside some cash to buy and hold this stock for the long term.

Additionally, given the state of the market, it would be prudent to buy the dips without expending too much of your money. Always conduct your research and keep abreast of news that is relevant to the stock you have chosen.

Once again, KUDOS to @batangtrader29 for being this week’s featured trader! Enjoy your 14-day InvestaPrime Access and continue to be an inspiration to the trading community.


Categories
Latest Posts

The Investa Summit 2022 Brings you Timely Strategies to Find Opportunities in Crisis

The Investa Summit is here, this time to help you weather the storm in the markets. Top financial and business experts from all around the world are gathered to share investment principles, strategies, and tactics with digital audiences at the Investa Summit.

This year, we decided to match our theme with how the markets have been faring over the year. As the global economy has been rocky, we felt that we can provide the most value to the audience by setting the theme to finding opportunities within a crisis. Despite the gloomy investor sentiment throughout the year, opportunities will always be there. The Investa Summit serves as a way for traders and investors to learn how to prepare themselves to catch those opportunities.

Organized by Investagrams, the Investa Summit this year will be held online on November 25 to November 27. This year’s Investa Summit brings to you a star-studded lineup of speakers featuring:

Jack Schwager, Author of Market Wizards

Jared Tendler, Bestselling Author & Mental Game Coach

Tom Basso, Market Wizard

Mark Yusko, CEO & CIO of Morgan Creek, Managing Partner of Morgan Creek Digital

Akio Kashiwagi, Founder of MoneyGrowersPH

Lawrence Lee, President & CEO of CTS Global

Edmund Lee, President & CEO of Caylum Trading Institute

Javi Medina, Managing Director and CIO of BIM, Founder of Open Journal

Emmanuel Onuoha, Founder of Openwaver

More speakers will soon be announced as Investagrams wants to bring the most value it can to its audience!

“Based on the performance of stocks and even cryptocurrencies over the year, it was obvious for us that the traders and investors of today need knowledge and wisdom that will help them get past hurdles in the markets.”

Joanne Marquez, Investagrams’ Marketing Head and Project Head for the Investa Summit

Joanne also shared that bear markets are always where skilled traders truly shine. Spotting key opportunities during bear markets takes a lot of skill and discipline, which are honed through studying real-life experiences. Thus, she hopes that the wisdom to be shared by the speakers will allow the attendees to learn a thing or two and hopefully help them through the bear market we’re facing. 

Investa Summit 2022 is being organized by Investagrams, the leading social-financial platform and mobile app in the Philippines founded by three Filipino millennials namely JC Bisnar, CEO; and Airwyn Tin, CTO. The platform offers virtual stock market trading, analytical tools, market education, and a social network to empower traders and investors of all levels in order to help you keep on top of the global markets. The Investa Summit is another step in the company’s goal of increasing the number of Filipinos who invest in the Philippines to 10 million.

Continuing Investagrams’ mission to equip millions of Filipinos with strong financial education, the Investa Summit gives you all these quality lessons and insights.

Now only one question remains: Are you willing to learn how to spot opportunities in crisis, and improve your trading system to flourish through bear markets?

Tickets for the virtual summit start at only P999. For more information, you can head over to the landing page to view all the details: https://www.investagrams.com/InvestaSummit/


Categories
Latest Posts

Volume Profile: A Beginner’s Guide

If you haven’t noticed yet, Investagrams has a POWERFUL technical analysis indicator that can help you take the next level: the Volume Profile indicator. While other indicators often boast complex formulas, the volume profile is very simple. It shows you the volume of shares traded per price level. However, don’t let its simplicity fool you as this tool can be very useful. Let’s take a deeper dive into this indicator.

HOW DOES THE VOLUME PROFILE INDICATOR WORK?

As was mentioned, the volume profile shows you how many shares were traded per price level. By clicking the convenient button, you can have the indicator show up whenever you want. When used, information is displayed to you through a histogram as seen below. 

This indicator lets you see levels where buying and selling are more intense. Once you find out which levels encountered heavier buying/selling, you should know that these areas should serve as more prominent support and resistance levels. As a rule of thumb, prices often don’t have trouble going through areas with little activity. On the other hand, prices will often have trouble going straight past areas with a lot of traded volume

WHAT DATES DOES THE INDICATOR USE?

What makes Investagrams’ volume profile indicator unique is that it can dynamically adjust the range it tries to profile. Generally, the indicator will calculate the volume per price on only what’s being shown.

For example, here we can see that the chart only shows candlesticks up until August 16. Thus, the indicator will show you the volume by price for trading activity from that date until the current date.

If you zoom out up until the June 20 candle, the indicator will adjust to that date. It will then show you the volume by price for trading activity from the new date until the current date.

Same with zooming in, the indicator will always adjust accordingly depending on what’s shown in your chart.

USING VOLUME PROFILE TO THE FULLEST

Volume profile is often used in conjunction with other indicators and chart patterns. Through the volume profile, chances of success are amplified since you can identify which support and resistances are more important. 

SAMPLE TRADE USING VOLUME PROFILE: $EMI

Let’s look at how volume profile can make even simple supports and resistances more effective to trade with.

When the Philippine stock market index came falling, many stocks fell victim. Emperador was one of the stocks that were heavily affected by the market sell-downs. However, as always whenever big sell-downs occur you can expect to see at least a quick bounce play.

As you zoom out you start to see support levels that you can choose. But, which ones should you use as entries and cuts? And, which levels should serve as your targets? As you trade more and more, you’ll most likely encounter times wherein charts are confusing given that there are a lot of levels to choose from. 

For the example of $EMI, the volume profile tells you that 12 – 12.8 was a major level for the stock. You would also see clearly that your biggest target would be around 17.5 since most of the volume traded was there. The initial smaller target would be around 16.6 as it would be the closer significant level. Although 15 could serve as a technical target too, the volume profile would show you that the market takes little interest at that price level.

Prices would eventually break past 17.5, but selling at that level would still give you a 40% profit. Of course, using the volume profile won’t make your predictions correct all the time. However, it will most definitely help raise the probability of success. 


Categories
Latest Posts

Featured Trader of the Week: @amadeus024

@amadeus024 takes the spotlight for this week’s featured trader as he shares his knowledge and insights on stocks from the PSEI. 

In a quote by Naved Abdali, he says “Once you have a plan, always invest within the boundaries and parameters of your plan. Never bend your rules to accommodate your guts.”. The main benefit of technical analysis is that it aids investors and traders in forecasting market trends and making trading and investing decisions based on the study. Watch as @amadeus024 uses this to his advantage.

@amadeus024 gave his thoughts on FCG and the potential course it might go after completing the shark pattern harmonic about 11 days ago. Additionally, given the current status of the market, @amadeus024 was able to predict where the price might go.

During this specific trading period, @amadeus024 has plotted out a simple support line in the 4-hour time frame. We can also see an RSI, a momentum indicator, in its oversold levels (below 30) which typically means a stock is undervalued. Moreover, it also means that it can be a perfect opportunity to buy. But what is most noticeable in the chart are the red lines that form M. This is what is referred to as a harmonic pattern, which aids traders in identifying pricing trends by projecting upcoming market movements. In order to spot possible price shifts or trend reversals, they use Fibonacci numbers to generate geometric price patterns.

TECHNICALS OF THE TRADE

Technically, FCG at the time was gaining an uptrend momentum. First, let’s look at its RSI which is at its oversold levels (below 30). In most cases, traders would want to buy around that level as it typically means that the stock is very undervalued, allowing traders to buy the dip. Let us also take a look at the MACD, a trend momentum indicator, which has also crossed towards an uptrend movement. As for its support, the price has just managed to bounce at the 0.50 support level, allowing @amadeus024 to grab the opportunity to buy. Lastly, the formation of the Bullish Harmonic Shark Pattern. This pattern typically indicates an uptrend movement and combining our previous indicators, it is no wonder why @amadeus024 predicted the price to pump.

FUNDAMENTALS OF THE TRADE

Yesterday, October 13, Figaro Coffee announced that its overall first-half audited financial earnings were up by 80%. The firm achieved top-line sales of P2.43 billion, an increase of 80% from the same period last year, and a net income result of P198.2 million, an increase of 111% from the same period last year. Gross margins were reported to increase from 44% to 49% by utilizing economies of scale and cost efficiencies. As a result, it saw a 64% rise in operating income and a 13.5% return on equity. A P0.01936 per share first dividend, payable on November 21, 2022, was also declared. A total of 90 million pesos was allocated in all.

Source: PSE Edge

WHAT SHOULD BE MY NEXT MOVE

FCG looks to be doing well in the daily timeframe as all indicators show bullish momentum. Moreover, positive disclosures and sentiments about the company have just been released recently such as the declaration of cash dividends. An increase in revenue, gross margin, and net profit, not to mention the plans of expansion, are also one of the key factors which make this stock good in the long run. 

With all this considered, it is best to allocate some cash to buy this stock and hold it for the long run. 

Additionally, it would be advisable to buy the dips without spending too much of your funds under the current market condition. Always do due diligence and stay up to date on news that is pertinent to the stock you have selected.

Once again, KUDOS to @amadeus024 for being this week’s featured trader! Enjoy your 14-day InvestaPrime Access and continue to be an inspiration to the trading community.


Subscribe to our Newsletter

Join our mailing list for investing tips and stock market advice
to help you reach your first million.

You have Successfully Subscribed!