Categories
Featured How to & Advice Latest Posts

Featured Trader of the Week: @uigie

Let’s give a round of applause to AlMar for being this week’s Featured Trader! 

AlMar has been a member of the Investagrams community since 2020, and he is consistent poster who shares his thoughts and chart studies to the community. Something unique about what he shares versus other members is that he often shares bigger picture views of stocks. While others tend to share daily timeframe charts, he often shares weekly timeframe charts

Months ago, our featured trader posted his trade ideas for PSE:WEB. A widely known gaming company, its stock price has been in a downtrend for quite a while.

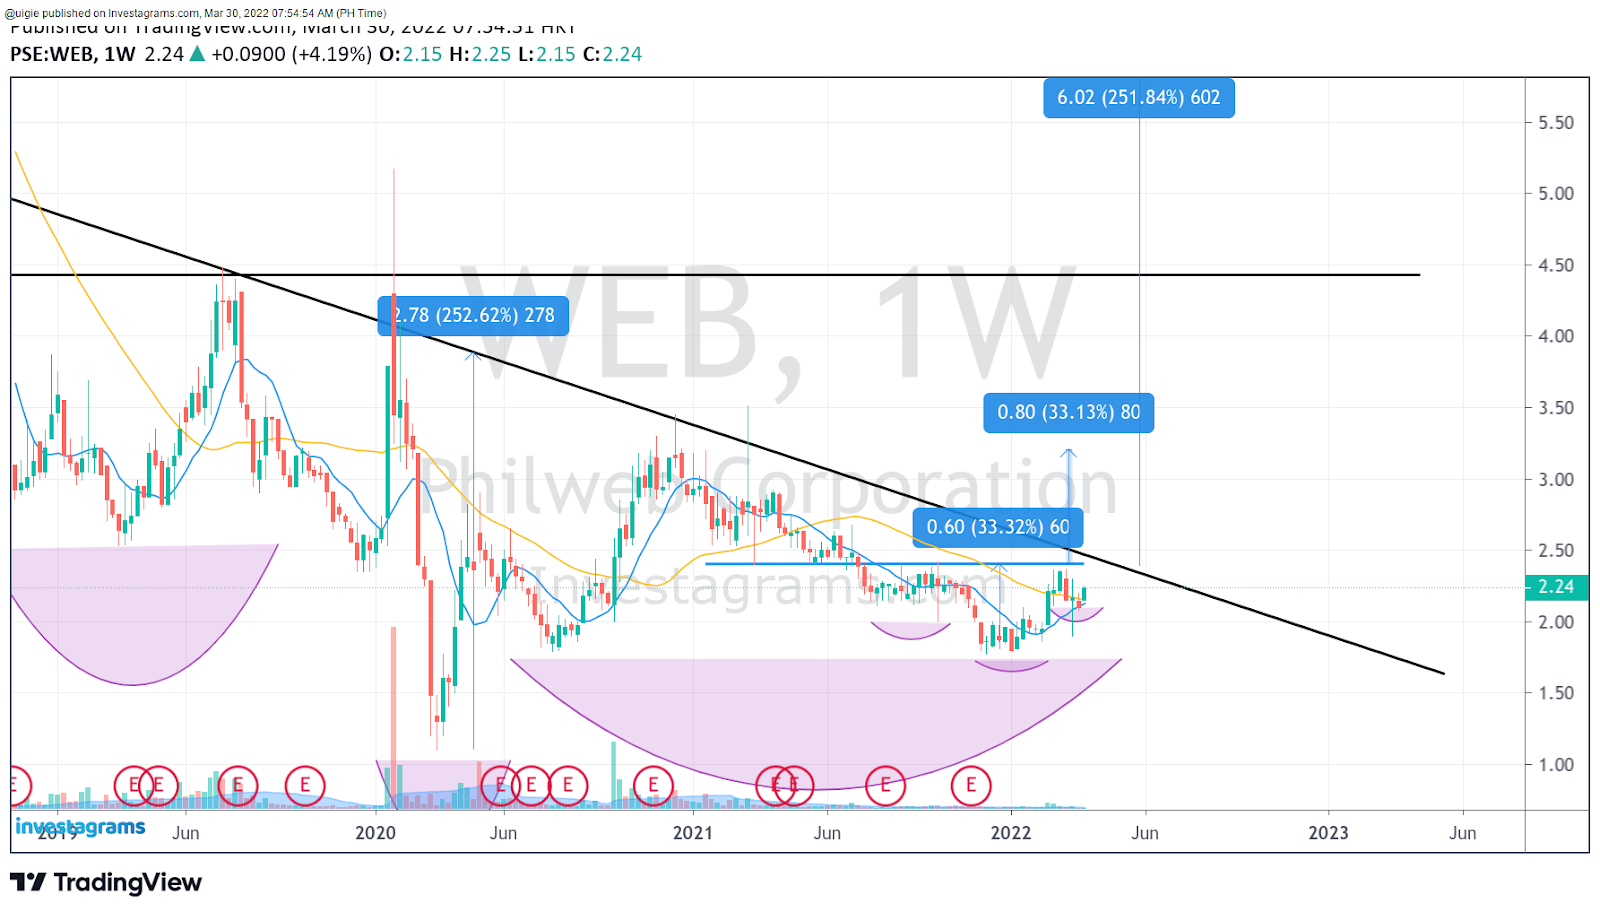
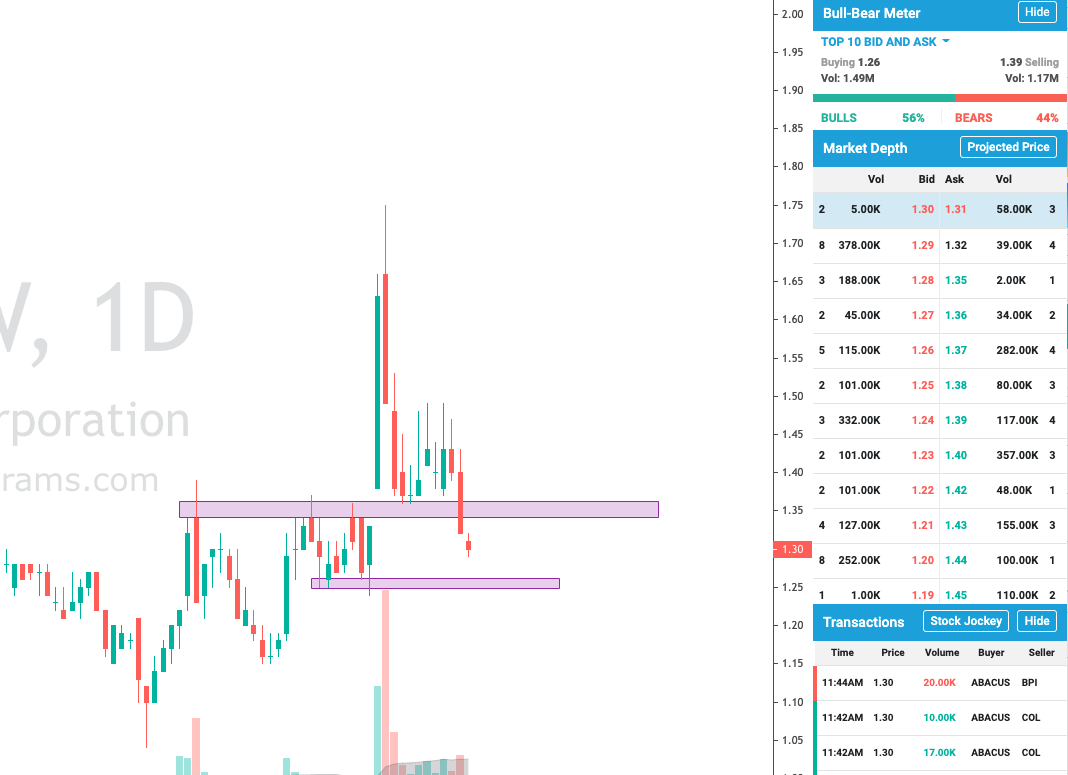
PSE:WEB has actually fallen by as much as roughly 96% from its peak a few years ago. With a lot of headwinds and sour earnings, a lot of investors have become pessimistic with the stock. After many months of poor returns, it seems that stock may have gotten some life back. In his post, AlMar mentions that the stock could breakout from its long-term downtrend line. As seen in recent trading sessions, PSE:WEB has just taken its first step should it look to perform a reversal. 

TECHNICAL STANDPOINT

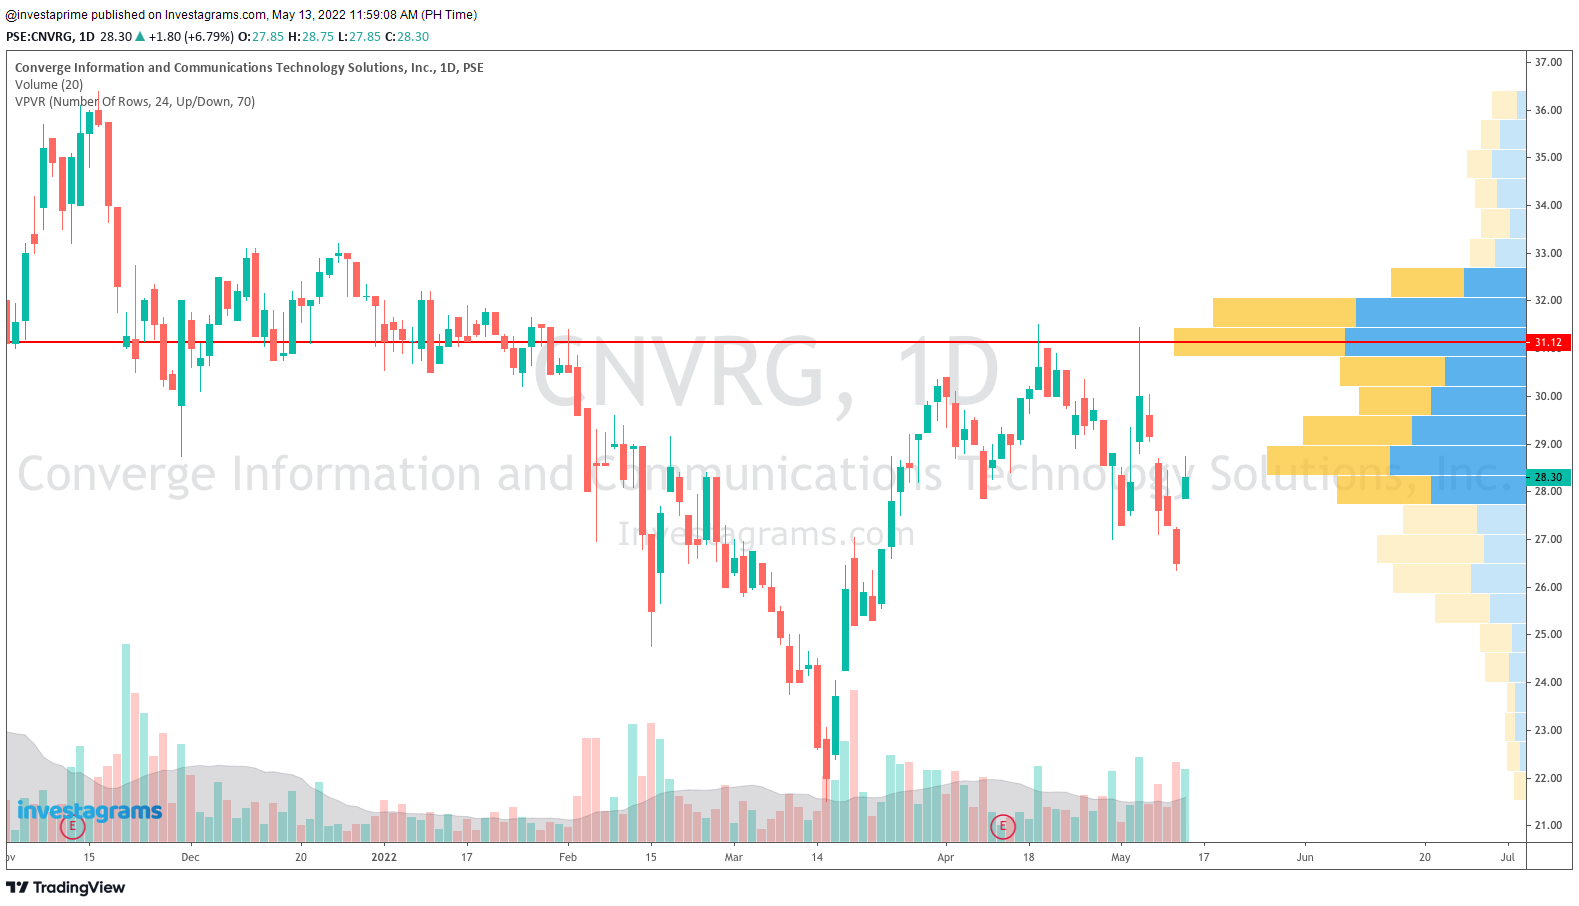
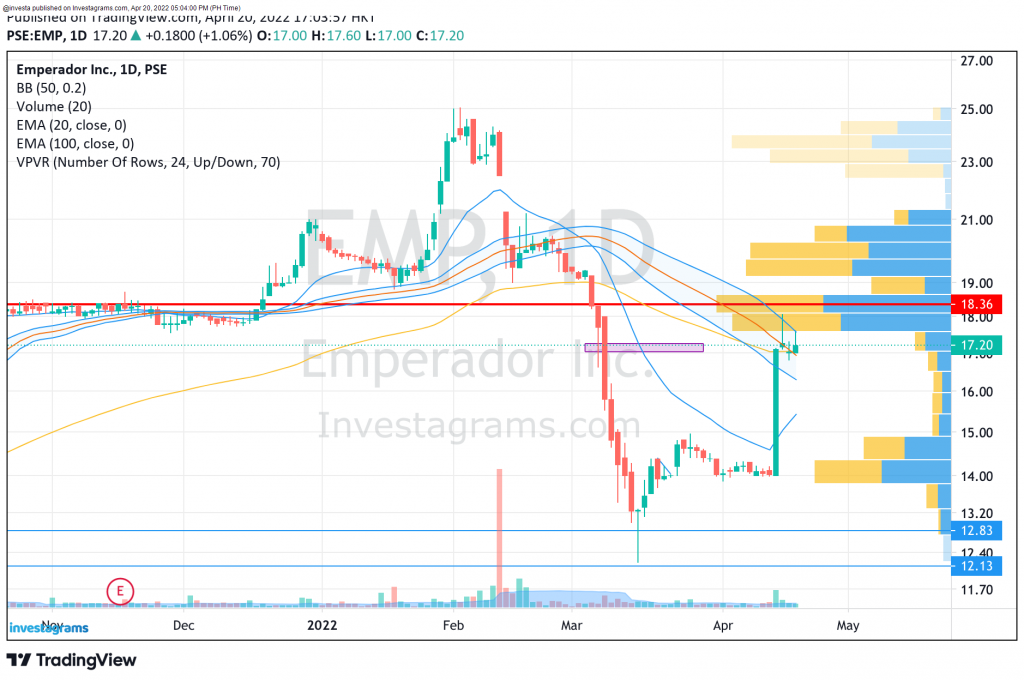
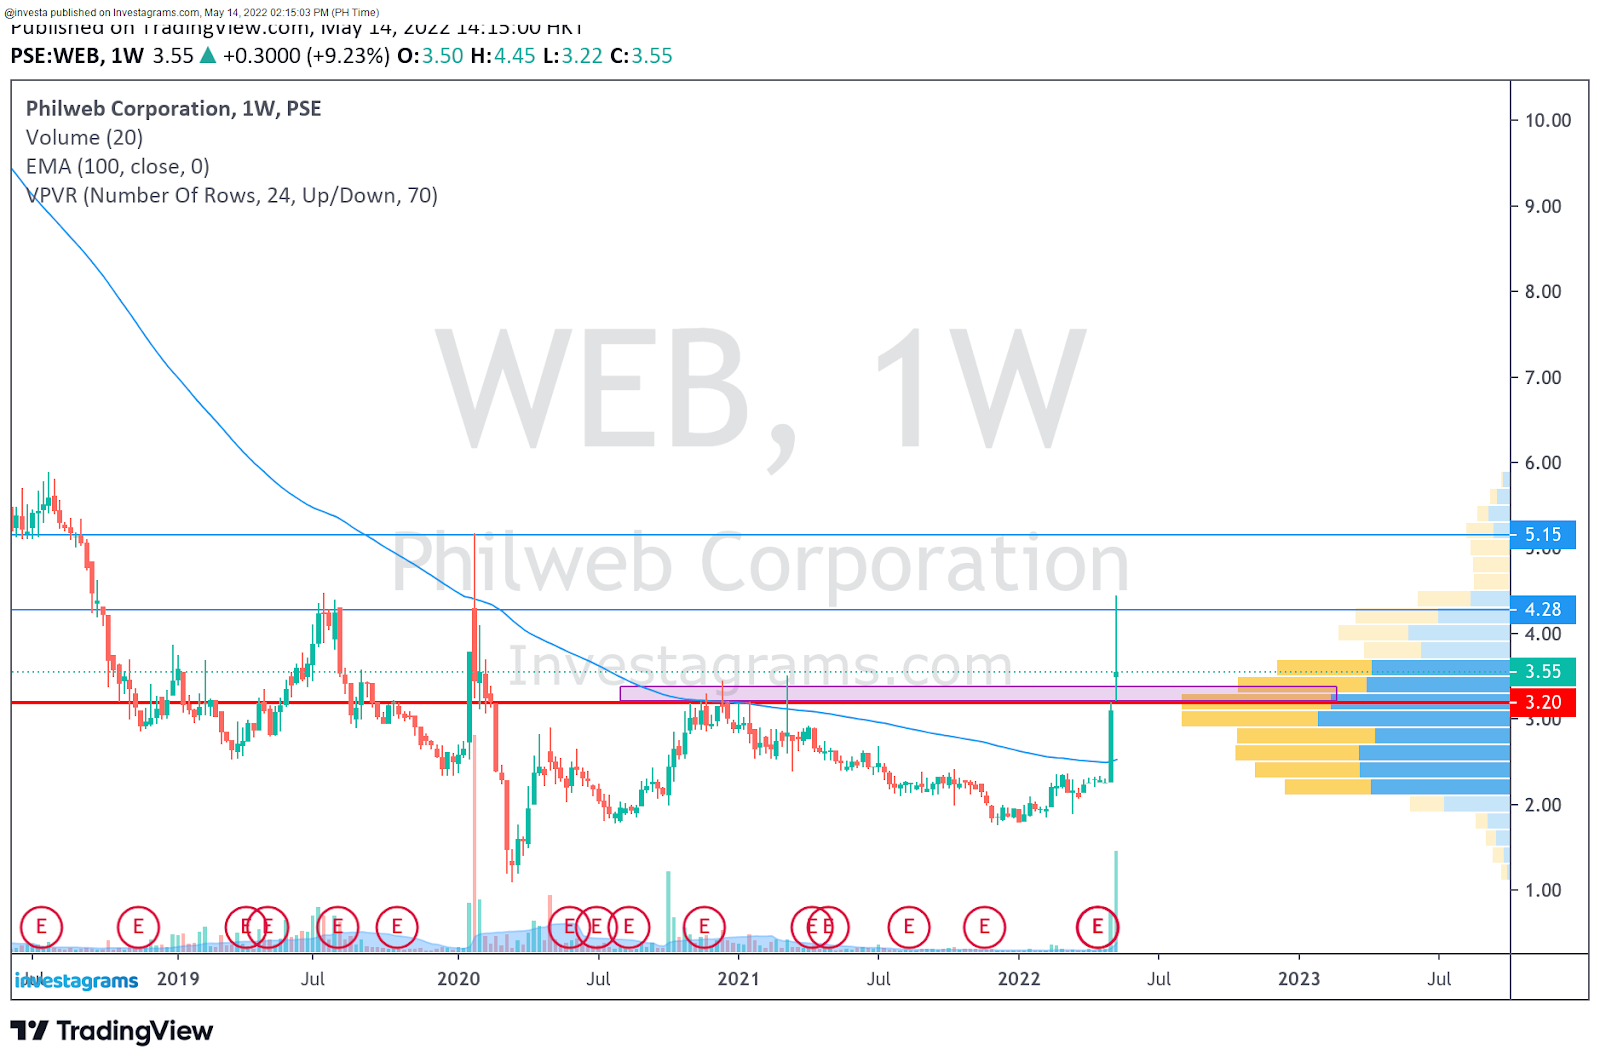
In terms of price action, PSE:WEB came from its lows and formed a pocket near it’s weekly EMA100. Once volatility contracted, a strong breakout was imminent as buyers rushed in on the day of its breakout. The stock’s recent move makes it a prospect for a big picture reversal play. Although high volatility is still present in the markets, strongly breaking out from the EMA100 is a big first step along with breaking out of its long-term downtrend line. 

FUNDAMENTAL STANDPOINT

PSE:WEB is a company that mainly revolves around gaming, with it’s primary business being e-Games Stations, or internet cafes exclusively dedicated to casino games. Through the company’s technology, users gain access to hundreds of casino games and even sports betting. Although they are in a lucrative industry, they haven’t had that much success in recent years as they struggle to become profitable. 

What should be my next step?

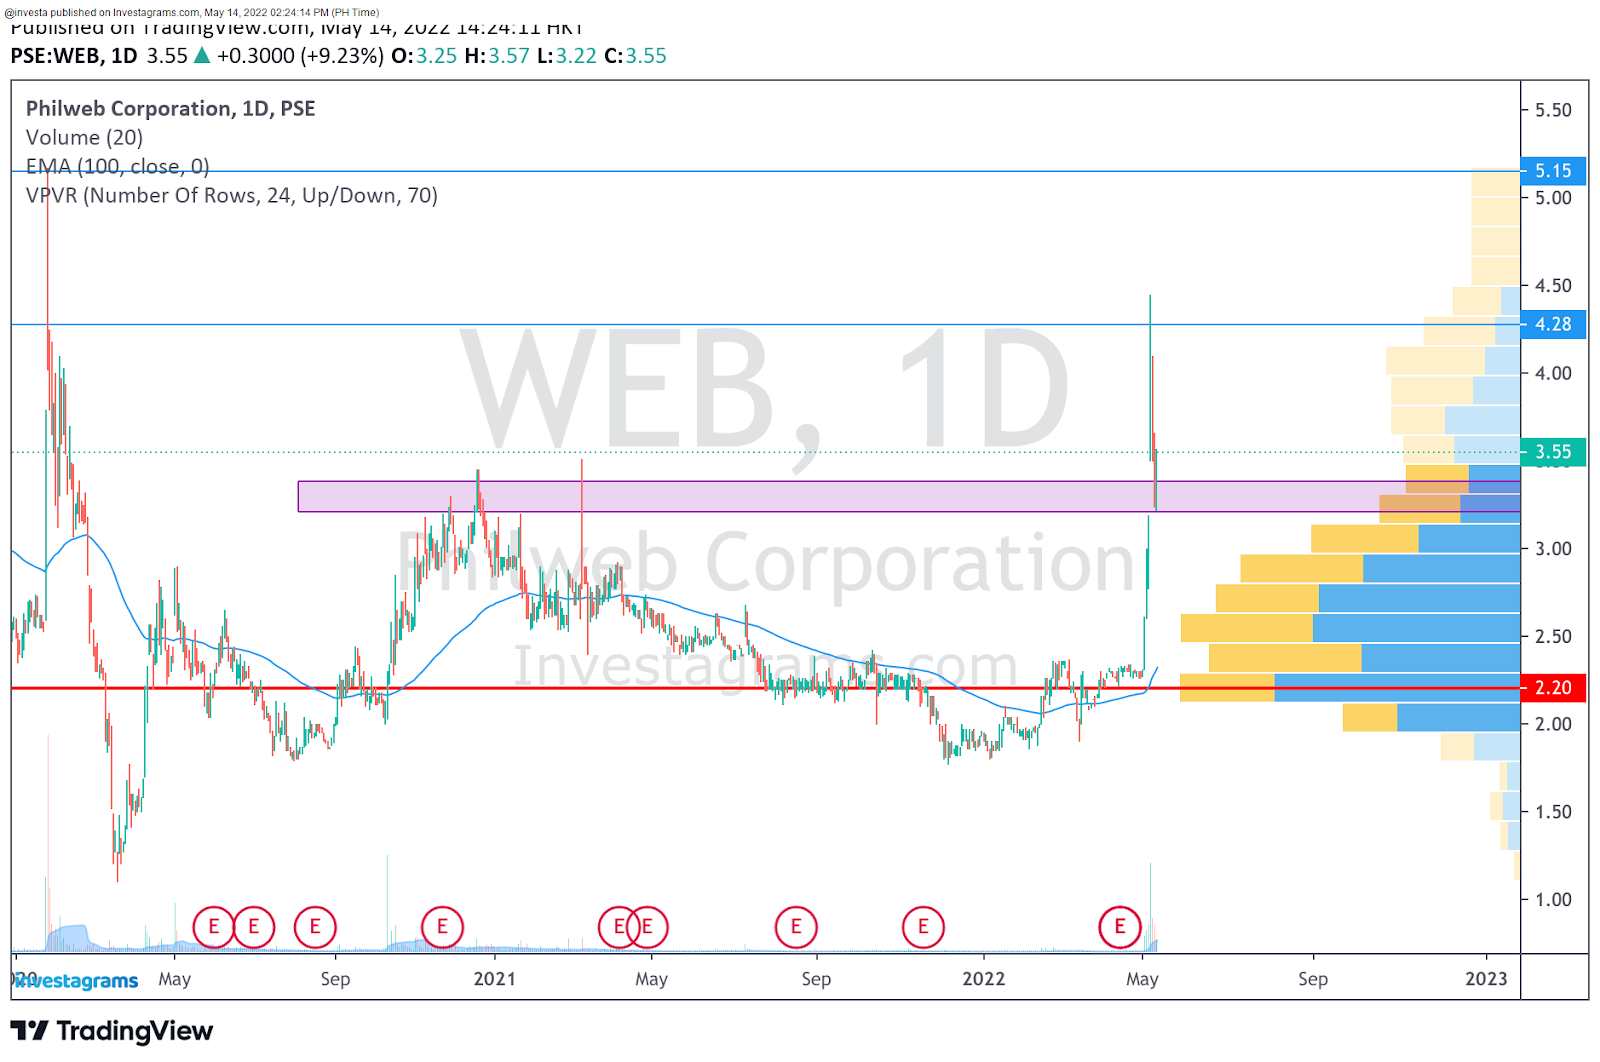
As the stock has just recently broken out strongly from key levels, prices need to at least hold above the 3 to 3.2 area in order to retain its momentum. The next major resistances would be the 4.5 and 5 levels, with volume by price indicating that 4.5 could be the heaviest level it would need to break. Breaking out of 4.5 should cause the stock to experience less selling pressure, but we need to keep in mind that we are currently in a bear market, and even though the set-up looks good, most traders and investors might look to sell earlier than usual to lock in gains in a tough market. 

Once again, KUDOS to AlMar for being this week’s Featured Trader! Enjoy your 14-day InvestaPrime Access and continue to be an inspiration to the trading community.


Categories
Featured How to & Advice Latest Posts

CHART your way to PROFITS

Physicians have x-rays and clinical tests. Sailors have their maps and compasses. Us traders have our charts. Especially for short-term traders, charts are essential as they will be present from planning to execution. As part of our mission to aid everyone in their financial journey, our InvestaCharts have always been a core part of our offerings. Our charts offer everything that a beginner, or even an expert, would need to map their way to profits. However, we don’t want to stop at just helping our users to be profitable. We want to provide users with charts that will help them become phenomenal traders. This is why we came up with a premium version of the InvestaCharts that can be used by our InvestaPrime members.

Want to take a glimpse into what new features you can use to chart out your trades? Scroll down below to see the features and examples of how they can be used

  • Delay-free experience

Having delayed data can be a hassle, especially for traders who need to execute quickly. Even a few seconds can become crucial when executing trades during an explosive breakout, what more 15 minutes? Unless you avail of the level 1 PSE data plan or an InvestaPrime subscription, you would be subject to delayed market data by up to 15 minutes.

For example, on the day PSE:EMP rallied, prices quickly soared within a matter of minutes. For Prime users and those who availed of a PSE data package, they wouldn’t have had a problem. However, users with a 15-minute delay, they would see a stock price of 14.04 whereas the price had already risen up to 16.50. 

  • Premium indicators that automate charting for you

As traders grow and gain more experience, simple charting becomes easier. However, who wouldn’t want to have someone else do repetitive tasks for them? As an InvestaPrime member, you will be able to unlock premium features on InvestaCharts that help you automate your charting process.

As a premium user of the InvestaCharts, you will have access to Auto 52-Week Highs and Lows as well as an Auto Support and Resistance that will help you plot important price levels faster.

There is even an Auto Fibonacci feature that will help you save time when plotting your Fibonacci Retracement levels. 

  • Premium indicators that give you a strong edge

Saving the best for last, we have developed premium InvestaChart features that will greatly help your trading decisions. Support and resistances are foundational concepts for every trader. Even as we get better, determining which levels hold the most importance will always be the challenge that we will face. Let’s look at how our features can help you with that challenge.

With the Bull-Bear Meter, we can help you determine if the Bid and Ask board is showing signs of demand and supply. A good example of how this can help would be for buy-on support strategies. In essence, buying on support is done because you expect that support area to be an area of demand. It would then make sense that when prices reach near that level, the bids and asks should show more eager buyers. Even if a level looks like a solid support, it wouldn’t mean anything if buyers don’t show up. With the Bull-Bear Meter, you wouldn’t need to check the board manually as the meter will weigh in all the bids and asks for you, telling you if buyers have shown up or not.

Another very useful premium tool that will help traders is the Volume Profile Visible Range. Basically, this tool plots out how much volume was traded per price point. A deeper understanding of supports and resistances would tell you that more volume on a support level signifies that the market deems that area a very cheap place to buy, whereas more volume on a resistance level would signify that there are participants there who have lost money and would most likely want to break even at the least. Thus, you can use the Volume Profile Visible Range to better understand what price levels hold the most psychological impact on the market and its participants. 

They say that the only indicators needed for a trader to be great are price and volume. By being an InvestaPrime subscriber, the premium features of InvestaCharts will no doubt make it easier for you to study price action and will help you take a deeper look into the volume traded behind the prices. 

Want to know more about what we offer? Head on over to the InvestaPrime landing page to look at all the features that we provide to our subscribers!

Categories
Featured How to & Advice Latest Posts

The Road to Trading Mastery Made More CONVENIENT

Practice doesn’t make perfect – perfect practice makes perfect. As traders, we could be charting, analyzing, and trading day in and day out non-stop. But, we could actually be just going within a loop and not improving even though we keep on doing the repetitions. It’s important to work hard, but being sincere in mastering the craft means more than just showing up – we need to look for the bitter pills and painful lessons that help cure our shortcomings and weaknesses. This is where mindfulness comes into action as we need to be aware of how our trades are playing out in order to find out how we can be better the next time. However, It can be overwhelming to do everything on your own – from building your trading logs to going through and creating the analytics for your trades. This can be troublesome. We know the pain, which is why we came up with the InvestaJournal, a tool to help you work on yourself and even bigger trading returns. More than just being an all-in-one solution for trading notes and tracking your portfolio, the InvestaJournal features a wide variety of advanced analytics that can help you level up your trading game.

Let’s see how convenient and powerful the InvestaJournal is in helping us grow as traders.

  1. Creating a journal account

Once you have access to the InvestaJournal, creating journals is as easy as just clicking a few buttons. You just need to click on the add account button on the right to start making a new trading journal.

You are free to make as many trading journals as you’d like should you need to create multiple for organizational purposes.

  1. Logging deposits and withdrawals

The next step towards building your own trading journal in the InvestaJournal is to input how much capital you’ve put into your trading account. Again, this will be as simple as just clicking a few buttons. Simply go to the portfolio tab, and you’ll find the option to add deposit and withdrawal transactions.

Adding these transactions shouldn’t take long as all you need to do is input how much you withdrew or deposited when you made the transaction, and how much the transaction fees were. 

  1. Setting up strategies

Should you have multiple strategies under your belt, you can list all of them in your journal so that you can tag what strategy was used per trade that you made.

You can even add buy and sell conditions, along with a description of your strategy should you need to review your rules on a later date.

  1. Logging trades

Of course, what’s a trading journal without our trade executions? To start taking note of trades, you can head on over to the Trade Logs section and select the option to Add Trades. 

Here’s the fun part: while adding your trades the InvestaJournal will let you do a lot of neat customizations. Aside from adding the trade details (ex. Price and amount of shares), you can also add notes such as what you could have been thinking while executing the trade. In addition, you will also have the capability to add what strategy you used for the trade as well as a screenshot of the chart to further help you when reviewing. 

You can even take note of what you felt! You can use the emojis in the description to note if you were happy, neutral, or fearful.

BONUS: Should you need to input a big amount of trades from your brokerage account, the InvestaJournal can save you time by simply importing your ledger to the journal! Just choose the import option and simply follow the instructions for the brokerage that you are importing data from.

  1. Analyze, analyze, analyze!

Once all the data is set, you’re good and ready to start analyzing your trades. InvestaJournal still includes basic information such as the current equity value along with realized rofits and losses. However, what sets it apart are the advanced analytics that you can take advantage of in order to find improvements left and right. 

For example, statistics such as Avg. Profit can be used to determine if you really make the most out of your trades. If ever you feel like you take profits off the table too soon and want to explore holding on to a bigger portion of moves, this statistic could help you gauge how you’re improving. The InvestaJournal even shows you how strong your different strategies compare with one another, so you can see what strategy really works best for you!

Although the InvestaJournal is really simple and easy to use, it will surely make an impact on your development as a trader. We guarantee you that you will be able to find a lot of insights through the InvestaJournal that will let you take the next step towards mastery. 

Want to know more about what we offer? Head on over to the InvestaPrime landing page to look at all the features that we provide to our subscribers!

Categories
Featured How to & Advice Latest Posts

Your new trading teammate: INVESTAPRIME+ RESEARCH

Traders are often compared to athletes. In performance sports like Basketball and Football, competitors need to hone their skills. Intentional practice is needed, and to reach the highest levels, attaining 10,000 hours becomes a necessity. Trading is no different. Being one of the greats entails putting in hard work and dedication to honing one’s craft. Often, an underrated habit in getting better at performance sports is picking the brain of others. It is a necessity in competitive endeavors to learn from others; to study techniques, strategies, habits, and even dialogue on the peculiarities of the game. For athletes, it’s as simple as watching recordings to study and take notes. It’s as simple as walking up to teammates to talk about plays. For traders, research is abundant, but rarely can you see articles that really encapsulate the mindset of a trader – from ideation to the execution details.

We want you to be the BEST trader that you can possibly be, which is why we want to be the best trading teammate you’ll ever have! To make it easier for traders to look into the minds of how successful traders and fund managers work, we came up with InvestaPrime+ Research. More than just providing information on the markets, our InvestaPrime+ Research write ups will provide you with in-depth details on what our in-house traders really think and feel regarding the current state of the markets, along with what they plan to do and why they are making those decisions.

Let’s see examples of how InvestaPrime+ Research will assist you in your development as a trader!

  1. Out of ideas? We got you.

Trading involves a lot of creativity. Especially when times are tough, traders have to be creative and see where is the money flowing into. However, let’s face it – sometimes it’s hard for us to look for which market or sector the smart money is going into when all we see in the usual markets we trade in are downtrends with setup opportunities nowhere near in sight. Even if we already have a solid trading foundation and are able to stand on our own, it’s always helpful to get a hint as to where to look for trades every now and then. 

Let’s say you already checked the PH and U.S. stock markets along with the crypto market, it might still be hard for you to look for trades if you purely trade uptrend continuations and momentum patterns. With InvestaPrime+ Research, you will be able to see posts frequently about the different opportunities available across a variety of markets should you run out of ideas.

  1. Want to validate your opinions and look for better ways of analyzing events?

As we develop as traders, we start to learn more and more about what is happening with the general market and how it affects our trading. When we gain more experience, we are able to discern events with a better eye, and it always pays to have better insights as this allows us to adjust our trading plans to the possibilities that have a higher chance of happening. 

For example, every trader who has had some bit of experience in the markets would probably already know that the US markets are in a tough spot right now. By being a prime subscriber and having access to InvestaPrime+ Research, you would have access to deeper insights coming from traders who not only have a lot of experience, but also walk the talk. More than just knowing that the market is in a downtrend, you will see actionable takes that can be taken and even dissected for your benefit. 

  1. Want to know the other side of your trade?

As traders, there will always come a time where opinions differ. Rather than shying away from contrasting opinions and arguments, we should look at them as opportunities to see things from a different perspective. Whether or not someone is right or wrong, we are all students of the markets. It doesn’t matter if you already have 10 years of experience or if you just completed your first year, everyone can always learn something new from another trader.

For instance, our take on the mining industry. It might not have been a popular opinion and some people did not see the potential. However, we believed that there was a lot of potential in the industry and the rally manifested. Of course, we could have been also wrong; we will never claim to know how the future will unfold. However, we will aim to give you our BEST analysis so that you can take trades that we believe have potential, compare and contrast the differing opinions to hone your own analytical skills, or even do both. 

The snippets shown here are just samples of the multitude of insights that we provide to our Prime+ subscribers through ​​InvestaPrime+ Research. Again, the goal here is to be the best trading teammate you’ve ever had as we aim to provide you with extensive research and analysis.

Want to know more about what we offer? Head on over to the InvestaPrime landing page to look at all the features that we provide to our subscribers!

Categories
How to & Advice Latest Posts

Featured Trader of the Week: @skewwyookieson

Let’s give a round of applause to Mercurial for being this week’s Featured Trader! 

Mercurial has only been a member of the Investagrams community since 2020, but that hasn’t stopped him from becoming a very active member. He constantly shares his own views and opinions on his trades, and really anything happening in the markets.

A couple of weeks ago, Mercurial posted one of his trades in PSE:EMP. Emperador is a liquor company that mainly sells brandy products famously known in the Philippines for being affordable, but still great for hangouts. Mercurial saw an opportunity to trade a reversal, and his preparation and efforts paid off as PSE:EMP had a strong price run recently.

After a broad market sell-off, select stocks started to bounce back. PSE:EMP took a bigger beating than the rest as the stock experienced multiple days of big red candles. The downward momentum was very strong until price hit a brick wall at the 12.00PHP/sh support level. The stock then experienced an onset of buyers, forming what looked to be a reversal. Although it took a while after the technical pattern formed, PSE:EMP completed an inverse head and shoulders pattern and broke out all the way past 17.00PHP/sh price levels.

TECHNICAL STANDPOINT

In terms of price action, PSE:EMP came from a strong downward move. As the price was going down, traders started to wonder when the stock would bounce. After a long while, hope came when a bullish divergence appeared right as PSE:EMP right as prices came into the major resistance around the 12 peso per share area. As prices started bouncing back, an inverse head and shoulders was forming. Usually a sign of a reversal, an inverse head and shoulders is completed when the neckline resistance is broken. It took a while for the stock to really surge after breaking through the neckline, but the wait was worth it as the stock price reached levels as high as 17PHP/sh. This is the ideal target for PSE:EMP as this was a resistance level where a lot of trading volume occurred.

FUNDAMENTAL STANDPOINT

PSE:EMP is the liquor company of Andrew Tan’s Alliance Global Group. A staple in the Philippines, Emperador is well known for its product Emperador Light, an affordable brandy that is in almost every inuman in the Philippines. Aiming to grow bigger, Emperador is planning to go global as they will introduce their products to new markets. In order to fund their efforts, they will do a secondary listing, but on the Singapore Exchange, where they expect to raise up to PHP1.5B through proceeds.

What should be my next step?

As PSE:EMP is already at a big resistance level where a large amount of transactions occurred, many are already looking to lock in profits, or maybe even sell all of their shares. For those who haven’t gotten any shares yet at lower prices, it might be wise to wait and see how the markets will unfold in the coming weeks. As there are a lot of headwinds for the Philippine Stock Market, there is a lower chance for breakouts and surges to keep on moving in the same direction as compared to when we are in a bullish environment. The key behavior to look out for should you want to enter, or re-enter, in PSE:EMP would be to see how prices are reacting around the major resistances from PHP18.00 – 20.00. The best case scenario would be for prices to consolidate above broken levels and to possibly creep up higher in anticipation of the company’s foray into the global market.

Once again, KUDOS to Mercurial for being this week’s Featured Trader! Enjoy your 14-day InvestaPrime Access and continue to be an inspiration to the trading community.


Categories
How to & Advice Latest Posts

How To Trade and Make Profits While You Are Busy

Whenever we think about elite trading, the most common image that comes to our minds is a person sitting on his desk and looking at charts for the whole day. Although it is crucial for traders to be there when the breakout happens, when the cut loss point is reached, and when share prices go near targets, we want everyone to be able to trade at a high level despite having jobs and responsibilities throughout the day. We want everyone to be the best trader they can be, and this is why we built the InvestaPrime Watcher. Trading will be made more convenient for you with the InvestaPrime Watcher as you will be given alerts through the Investagrams app, investaChat via FB messenger, email, and even SMS. All you need to do is to set your trading plans in the InvestaPrime Watcher, and turn on notifications so that you can start making profits even when you’re busy!

Let’s look at how we can use the InvestaPrime Watcher to make our trade executions more convenient.

1. Add stocks to your watchlist
To set up alerts, we need to first add a stock to our watchlist. To do this, simply
head over to the InvestaPrime Watcher, click “Add Stock” and look for the stock or cryptocurrency you want to trade. Also remember to enable alerts as shown below:

2. Set your trading plans – entries and exits
After setting the stock, you then need to input your plans. You would just need to put at what price you would want to buy, where you plan to cut your losses, and at what price you want to take profits. You can even add notes that are included in the notifications to help you execute better. Let’s say you want to buy on a breakout and plan to sell by halves, simply input these in the watcher as seen below:

We even provide you a quick calculation of the recommended allocation size as well as what the risk to reward ratio is for your trade!

3. Set your trading plans – indicators
Another innovative feature of the InvestaPrime Watcher is the ability to have alerts based on indicators, so that no matter how many steps your plan has we can still keep you updated throughout your busy day.

If for example you would want to buy half of your allocation on EMA20 support and half on the breakout, using these different alerts will help you execute to perfection as you would just need to follow your own instructions.

4. Setup where you would want to be notified
Once you have added the stock or cryptocurrency you want to trade and have already set what alerts you want to receive, it’s now time to set where you want to receive updates! It’s as easy as clicking “Setup Alerts” and choosing where you would want to receive notifications.

Now you’re all set to receive alerts and enjoy a convenient trading experience! Once your alerts are triggered, you should receive messages like the one shown below through the different channels you have set.

Although we offer a free version of the feature, free users are only limited to 4 alerts per month which are delayed by up to 30 seconds and won’t be able to use indicator alerts. InvestaPrime users on the other hand will enjoy unlimited lag-free alerts and will enjoy the indicator alerts feature along with being able to organize alerts into different lists.

Want to know more about what we offer? Head on over to the InvestaPrime link below to look at all the features that we provide to our subscribers!

Categories
How to & Advice

How to Find The BEST Stocks and Crypto to Trade

Planning is a very crucial task in trading. As they say, if you fail to plan, you are planning to fail. As a trader, you should always have a plan for any situation that may happen. Part of the planning process for every trader will always include looking for the best stocks to trade. You always have to find the best stock that fits your style of trading. It would be troublesome to go through each and every chart just to filter out ideal trade candidates. Luckily for us, there is the InvestaPrime ProScreener to help us look for the best trading opportunities. Using the InvestaPrime ProScreener will let us save a lot of time as it will do all of the screening and filtering work for us. It’s even easy to use! You just need to know what kind of trade you are looking for. Since stocks in a strong uptrend are the easier stocks to trade, let’s focus on finding opportunities for continuation pattern trades and momentum trades. 

Let’s go over how we can use the InvestaPrime ProScreener to make trading easier for us. 

  1. Market

Before you look for stocks or other assets that you would want to trade, you would first have to set which market you are looking to trade in. 

We offer our screening services across seven different exchanges:

  • Philippine Stock Exchange (PSE)
  • Singapore Exchange (SGX)
  • Commodities (CMD)
  • Cryptocurrency (CRYPTO)
  • Forex (FX)
  • New Year Stock Exchange (NYSE)
  • Nasdaq Stock Market (NASDAQ)

  1. Trend Parameters

You would want to use the Moving Average Parameters in order to look for stocks that are in a strong uptrend. An example of this would be to use these parameters: 

EMA 20: Moving Average above EMA 50

EMA 50: Moving Average above EMA 100

EMA 100: Moving Average above EMA 200

By using these as your parameters, you will be able to find stocks that are in a strong uptrend. When these moving averages are aligned, it means that traders invested in this stock are making money and the outlook is bullish for the near future.

  1. Value Average 

Aside from finding stocks in a strong uptrend, we also need to check how liquid these stocks are, or how much money is being exchanged. Value Average refers to the average total amount of money that goes in and out of a stock for a certain period. Although a stock may be in an uptrend, a low Value Average shows two warning signs. First, if you are investing a big amount, you may have difficulties selling later on if liquidity is low as you may find it hard to find buyers for your shares. Second, a low exchange of money within a stock may signify that there really isn’t that much interest for the stock as not a lot of people are trading it. Although liquidity isn’t that much of a problem in the U.S. and crypto markets, it is a necessity to look at liquidity when trading the Philippine markets.

To look for stocks that have shown to be liquid, an example would be to use these parameters: 

Value Average (20 Days): Value Average >= 5M

By using this parameter, you will be able to find stocks that have at least 5M worth of PHP or USD traded per trading session. 

  1. Fundamental Filters

Aside from Technical Analysis, Fundamentals should also be taken into consideration depending on the market that you would want to trade. For example, if you are looking for strong uptrending stocks in the U.S. market, then it would actually be ideal to look for high P/E stocks to trade. P/E, or the Price to Earnings ratio, is a measure of how cheap or expensive a stock is. Although it may be a common idea to look for cheap stocks, when looking for stocks in a strong uptrend a higher P/E ratio is actually ideal as you are looking for companies that are in their explosive growth stage. This means that their earnings are not yet there since they are still developing, but investors are already placing a premium for their shares as the future potential is too good to pass on.

An example of a Fundamental Filter for these kinds of stocks would be: 

P/E Ratio: Over 20

By using this parameter, you will be able to filter for companies that are being priced at a value a lot higher than its current earnings due to the potential of exponential growth.

These are actually just a fraction of what you can do with the InvestaPrime ProScreener. We have multiple screener filters that you can play around with in order to really find the best trades that you can take, from looking for stocks that are making new all-time highs, to being selective and minimizing your search to only select industries. 

When you launch the InvestaPrime ProScreener, we have pre-made screeners for different trader types and different needs should you want to use some of the screeners even we use for our trading. 

Want to know more about what we offer? Head on over to the InvestaPrime landing page to look at all the features that we provide to our subscribers! Start your FREE 14-day trial today.

Subscribe to our Newsletter

Join our mailing list for investing tips and stock market advice
to help you reach your first million.

You have Successfully Subscribed!