Categories
Featured How to & Advice

Trade Secrets from the Best: Philosophies and Strategies of Three Successful Traders Throughout History

The stock market: an entity that began in 16th century Netherlands as industrialization began to take hold.

Over time, the concept of jointly owning a company spread outside of the Netherlands, to every part of the developed world. As the concept grew in complexity, a need arose to differentiate oneself; and over the years, many individuals have stood out with their trading strategies that garnered them millions — even billions — in profit. Below are three standout traders from as early as the 1800s up until the modern-day, and the trading strategies that helped them earn big.

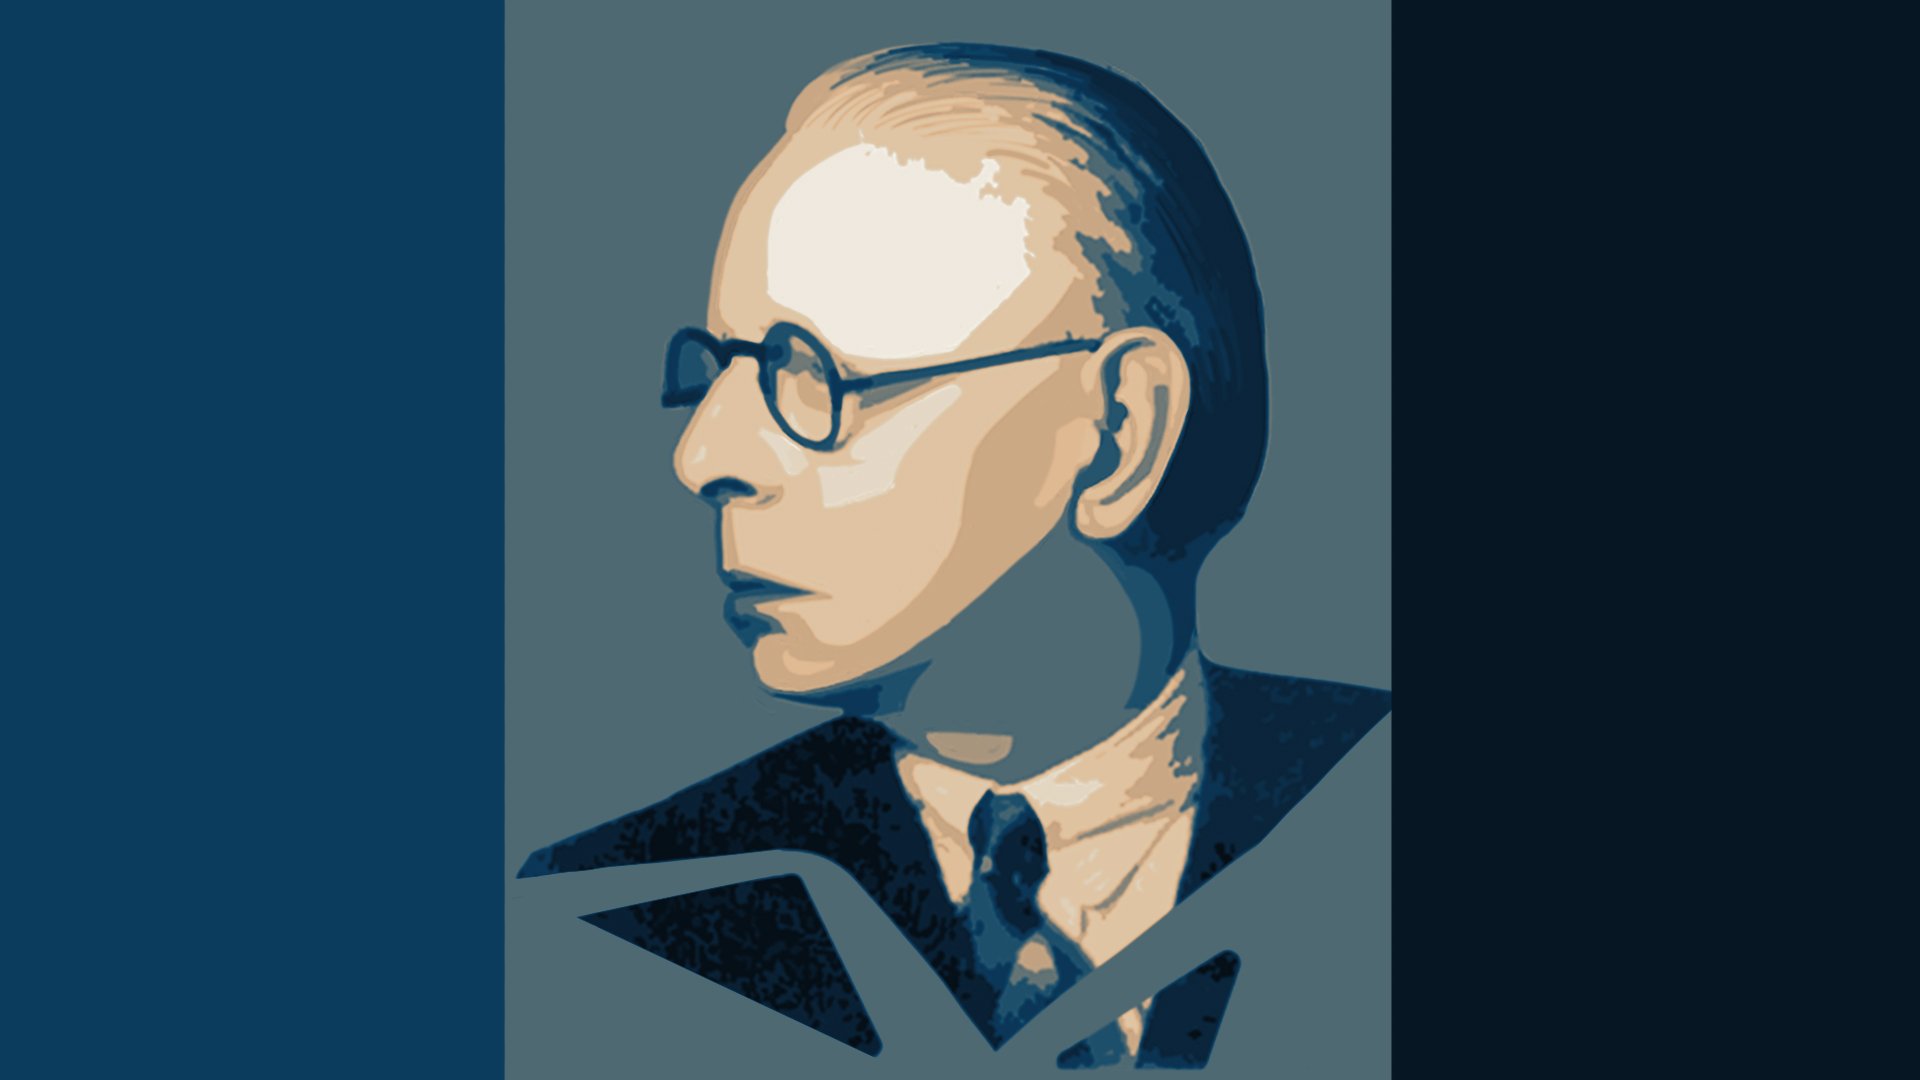
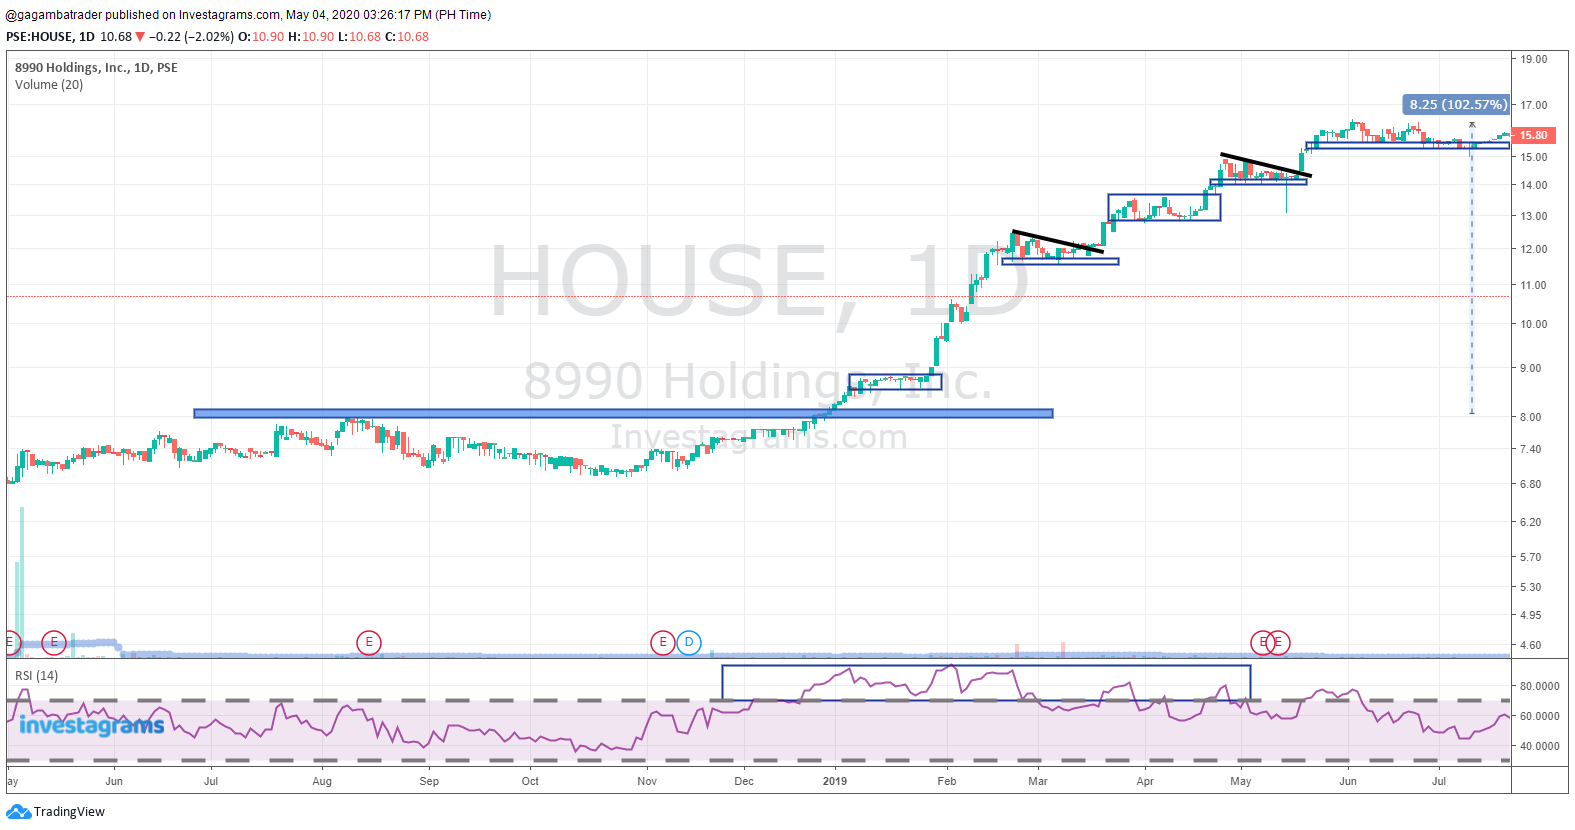
Jesse Livermore (1877 – 1940)

Perhaps one of the most famous names in the trading world, Jesse earned huge amounts of money through trading. He successfully shorted the 1929 market crash, earning him millions. However, throughout his life, he would gain big, lose it all, then gain again — in an endless cycle that eventually caused him to take his own life. However, he had a remarkable run, and Reminiscences of a Stock Operator (1923) — an unofficial biography of his life — is considered a must-read for traders. Jesse was considered a trend trader: he would analyze trends in the stock market and trade depending on whether it was on an upward or downward trend. Rather than basing it all on intuition, he would analyze the market and data before making a trade. Though this seems like common sense today, during his time, trading was based on rumors and speculation — his style of trading was entirely new. He also practiced Top Down Trading: he determined the wide-range market condition, then looked into industry groups following the general direction of the market, and sought out the strongest stock in that industry to invest in. Additionally, he identified a “sister stock” that he would follow along with the stock he invested in, as he believed that the condition of the sister stock would also reflect in the stock he invested in. As he once said, “There is nothing new on Wall Street. There can’t be, because speculation is as old as the hills. Whatever happens in the stock market today has happened before and will happen again.” Thus, patience, top-down trading, and a careful analysis of the market are important aspects of his immensely successful day-to-day trading.

George Soros (1930 – Present)

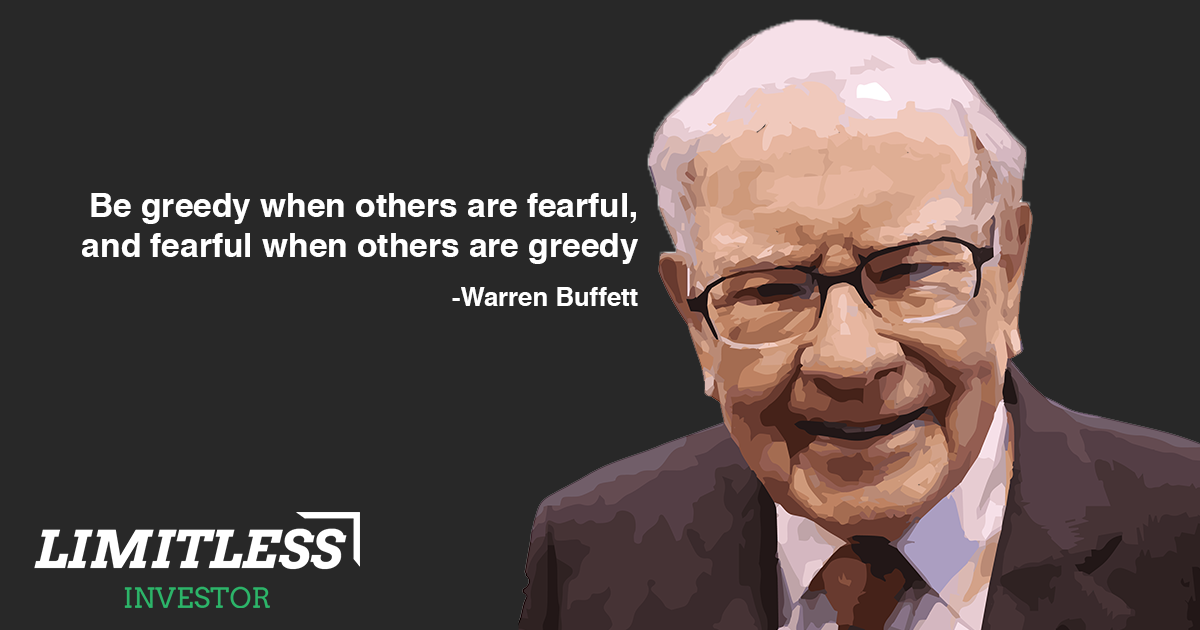
Chairman and founder of Soros Fund Management, he earned the title “The Man Who Broke the Bank of England” after he made over $1B on a bet that the British pound would depreciate in value. His ability to pull this off is a great example of his speculator trading strategy, wherein he makes huge bets on the direction of financial markets — essentially making a bet that the value of his stock will either rise or fall. When he predicted that the value of the British pound would crash, he borrowed billions worth in pounds and converted them to German marks. Thus, when the pound crashed, he was able to profit off the difference when he paid back the lenders. To engage in such trading, Soros looks at the economic, political, and social factors that affect industries in the future. He looks at trades from a long-term perspective — what will happen, and the events that are happening, that will shape prices in the far future. An example of this was when he invested in Japanese markets after the 2011 Fukushima disaster. Many investors exited Japan, as they did not think Japan would recover from the disaster. However, Soros saw an opportunity in the distant future: Shinzo Abe taking over as Prime Minister. A few months before Abe took office, Soros invested in Japan’s equity markets, and, just as he predicted, markets picked up rapidly after Abe took over. This shows Soros’s ability to look past the herd mentality of many traders, and analyze markets from a long-term perspective, ultimately allowing for long-term gains. However, a word of caution: as this strategy banks heavily on speculation and requires investing huge amounts of money, one should be able to afford a loss in order to implement it. It is an extremely high-risk high-reward style, requiring a good analysis of the trade and risk management plan beforehand.

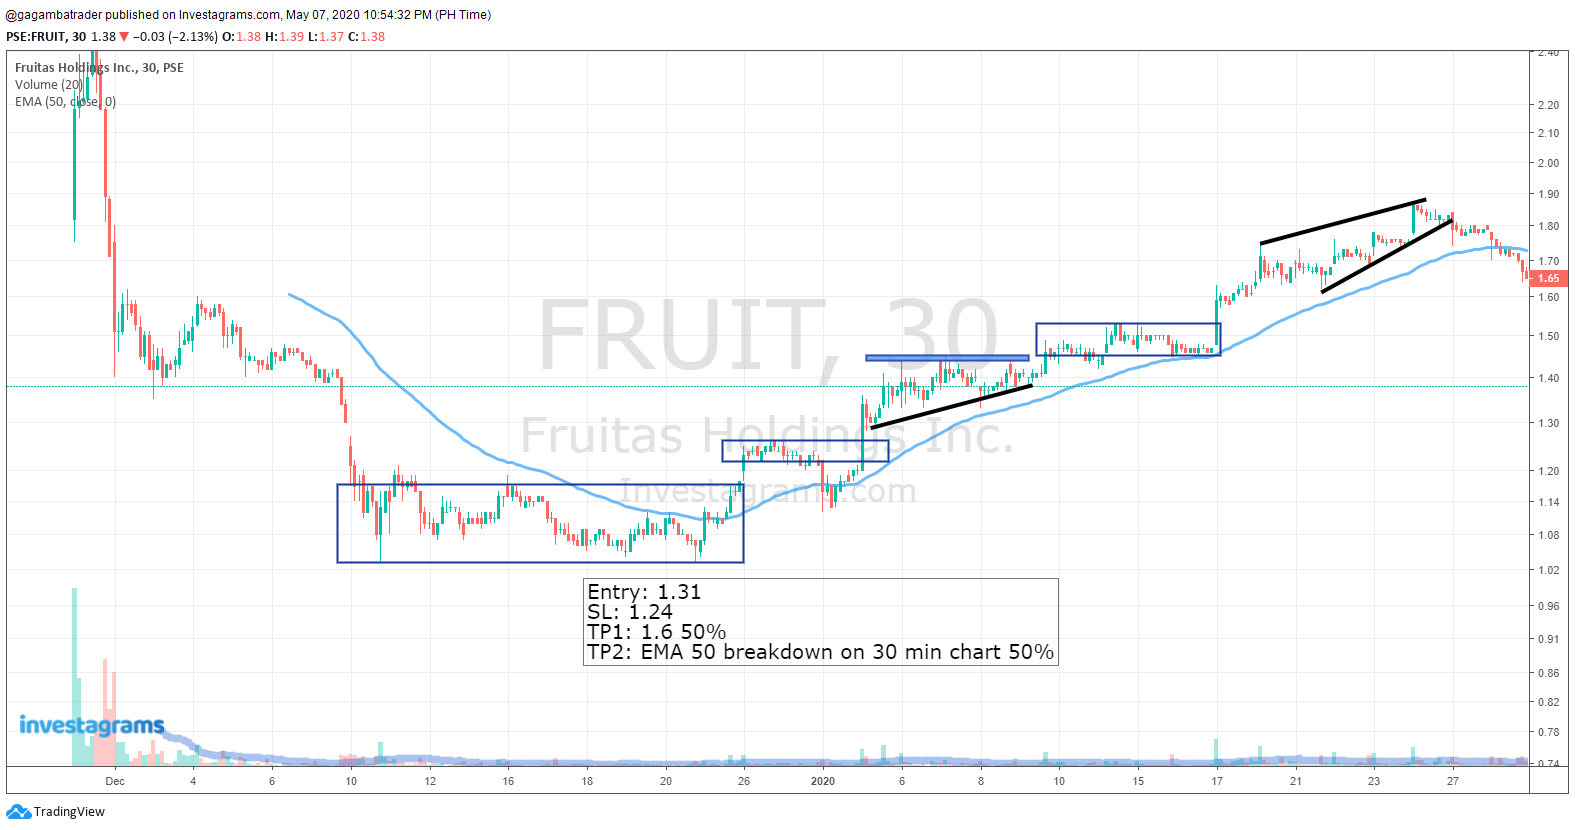
John Paulson (1955 – Present)

John Paulson is the founder of Paulson & Co. and made his mark on Wall Street by successfully shorting the real estate market in 2007. At a time when many were losing money, he was one of the only ones to earn big. After his success, he made an impressive trade run from 2007 – 2010 by shorting housing, bank, and gold stocks, effectively increasing his already large fortune. His main trading strategy is position trading: he invests in stocks for the long-run, believing in trading with a high probability of getting returns in the long-run rather than short-term buying and selling. Along with his philosophy of investing for the long-run, Paulson also believes in having an exit strategy in case the stock surprisingly turns south for a longer period of time. He stresses that one should not “fall in love with a company” because by becoming attached to that stock, it becomes harder to identify when it is depreciating for good. Additionally, Paulson uses a contrarian strategy, buying and selling contrary to the popular belief at that time. He believes in going against the current market trends to generate profits, as trends cause frenzies and bubbles that will eventually crash. He looks for share prices that are lower than the value he sees in a company, because if the value is intrinsically higher then the price will eventually go up, allowing him to generate profits in the long-term. Paulson’s strategy, in essence, is all about patience and waiting out on his stocks; because as he once said, “Our goal is not to outperform all the time — that’s not possible. We want to outperform over time.”

Conclusion

As seen from the three traders above, there are many trading strategies that have worked overtime. However, as John Paulson said, “No one strategy is correct all the time.” Every trading strategy has its downfalls, and periods when they just do not align with market conditions. All three of the abovementioned have experienced losses due to their philosophies — George Soros lost a huge amount of money when he bet wrongly on the US markets rising in 1987, and again during the 1999 tech bubble. In conclusion, as much as one can learn from the trading strategies utilized by the best, perhaps the biggest takeaway from their careers and experiences — both good and bad — implementing the strategies, is that one should never expect to win big and experience success at all times. Expect losses, plan for them, and come back with an even better strategy to conquer the complicated, and at times frustrating, the world of stocks.

Categories
Featured How to & Advice

The Line of Least Resistance

If you’ve read “Reminiscences of a Stock Operator”, which focuses on the life of Jesse Livermore, you’ll know that he emphatically states that one should focus on stocks that are near The Line of Least Resistance. A stock that is at this area is hovering near its 52-week high or all-time high levels, meaning that only a little demand can send a stock flying. By committing your hard-earned capital on these types of plays, you can expect a high probability of making the most amount of money in the least amount of time.

You may be asking yourself, “How is this possible? How can you make the most amount of money in the least amount of time?” By focusing on stocks near their 52-week or all-time high levels, you take off you watchlist all the laggard stocks and begin focusing on only the leading stocks in the market. This is especially effective during bull markets as stocks that create new highs tend to never pullback, so it’s best to get in when a new high is made.

So how does one find The Line of Least Resistance? One way to find it is too check longer-term timeframes, like a weekly or monthly chart, to plot the significant resistances that, if broken, can lead to an explosive move. Once you’ve plotted these points, you can go back to the daily chart (or whatever timeframe you prefer) and create your trading plan.

Here are some examples:

$ATN (ATN Holdings, Inc. ‘A’) was one of the alpha plays during 2018’s deep market correction. Despite the PSEi continuing to make lower lows and break all sorts of support, $ATN was simply hovering at the highs. Taking a look at its monthly chart, .75 is an area where $ATN had a difficult time breaking while its all-time high price is at .90. This means if $ATN can break and successfully close above .75, there’s a high probability for an explosive breakout.

By identifying the significant area the stock needs to break, you can now create a trading plan on your desired timeframe. On the daily chart, we can see that $ATN created a six-month base from February to late July and tried to break its historical resistance five times before successfully doing so on the sixth attempt. After breaking out, $ATN gave those who missed out an opportunity to buy on the retest. After this, the stock skyrocketed to new highs and made a 126% move in only eight days!

$HOUSE (8990 Holdings, Inc.) is one of the outliers in last year’s market, especially considering the bearish sentiment since the first quarter of 2018. Looking at its weekly chart, we can see that at the beginning of 2019, $HOUSE was right below its significant resistance at 9 pesos. While its all-time high price is at 10.50. After plotting these points, you can now create your trading plan on your preferred timeframe.

By looking at the daily chart, we can see that $HOUSE made a tight continuation pattern just below its historical resistance at 9 pesos. After breaking out of this pattern successfully, $HOUSE went through the roof and never looked back locking in an 80% gain for those who were able to purchase during the first breakout. The stock also gave several buying opportunities during the 80% move.

In conclusion

Just by knowing the importance of identifying The Line of Least Resistance can do wonders for your trading, especially if you focus on stocks hovering below their respective highs. By zeroing in on the market leaders, you effectively take out all the laggards that continue to drop while taking positions on stocks that remain in strong uptrends. The ability to identify and execute on The Line of Least Resistance will be a significant weapon in your trading arsenal, use it to your advantage!

Categories
Featured How to & Advice

The Most Overlooked Indicator

For anyone engaged in the activity of trading or investing, there is going to be very little to no argument on the premise that PRICE is the most important piece of information.

While most technical indicators are mere interpretations on aspects reflected by PRICE, there is one that newbies and amateurs most often overlook, if not taken for granted. But let’s digress for a while and come back to that a little later.

If you are a movie buff like I am you would remember that 2013 film with Brad Pitt entitled World War Z.

One of the most memorable scenes there was what they called “The Wall”. For those who haven’t seen it, this was set against the backdrop of a fictional pandemic, where Pitt’s character as an expert for the UN, flew to Tel Aviv in search for a solution to the ongoing zombie apocalypse.

In that particular scene, people inside the wall were chanting and singing as part of a religious ritual. And as their voices grew louder, it was unknown to them that the zombies had become agitated and grew to become more aggressive in their resolve to scale to the top of the wall.

Long story short, while some zombies fell off the ant-like mound they mindlessly created, many have found their way over and the city was eventually overwhelmed by the sheer VOLUME of the undead creatures.

And with these images now embedded into your consciousness, let’s get back to the subject at hand and dissect the process as to how PRICE action actually evolves from a seemingly quiet and calm to the point of what Warren Buffet called, IRRATIONAL EXUBERANCE.

In a simplified perspective, this is how it usually goes:

1. From a base level or range, the price of a stock hardly moves. Whatever incremental motion it creates is largely ignored by the general public. (Only a few zombies drifting around a small area.)

2. This goes on over a period of time and buying or ACCUMULATION by certain entities goes unnoticed. (They scrounge for whatever food they see nearby.)

3. At a certain point, some if not several pieces of information (rumor, news, or both) about the stock will start to go around and it begins to create a stir or commotion to the investing community. (Others from a more distant area, begin to spot fellow zombies appear happy and content in the place they currently occupy.)

4. The “noise” is amplified as even whispers add up to start a buzz on the prospects of the stock. (More zombies consolidate and create loud noises while becoming more aggressive.)

5. More people notice and it starts a buying frenzy on the hopes that the value will begin to rise and make for a good trade or investment. Volume significantly rises. (They realize that they have to move quickly and expend more effort and energy.)

6. Stock price begins to move higher, breaking resistances previously identified. The latecomers are struck with FOMO or the fear of missing out. Early buyers also become more confident as the trade moves in their favor as they add more to their positions. (The ant-hill effect takes shape in a race to buy high, sell higher.)

7. Holders who bought from a low base price, now begin to lock in profits and sell their positions to very late buyers, who carry the hopes that prices will still go higher. (Some zombies find the top of their walls and reap the rewards, while others become more mindlessly motivated by greed and obsessed to obtain the success attained by others.)

As some of you who may know me from my FB posts, I am a self-proclaimed advocate of technical analysis specifically in the study of Elliott Wave Principles.

And from my perspective, the above stages from no. 5 to 7 goes on for three (3) distinct cycles or waves, with a corrective phase in between each one. But let’s not get into that for now.

As you may have realized in the imagery presented on the processes involved in the above-described part of the market cycle, the aspect of VOLUME is almost always ignored and undermined. People are understandably distracted and more focused on price action.

But in each of the stages where a stock price moves up, volume plays a big role.

In a nutshell, the amount of people coming inside a trend at particular price points or levels eventually PROVIDE support and become a step to the ladder. And at certain points during corrections where a change of hands obviously happens, the greater the volume accumulated becomes a new base for the ascent to a higher range.

All until such time that volume starts to become DIVERGENT. Again, a topic we can dive into in a future issue of InvestaDaily.

In the meantime, let these be your key takeaways on the subject of VOLUME:

  • Volume is an indicator of market strength.
  • Rising prices on increasing volume is an indication of a strong price move.
  • When prices reach new highs on decreasing volume (volume divergence), a correction or a reversal could be
  • imminent.
  • And when prices reverse or fall on increasing volume, the trend is likely gathering momentum towards the downside.

I hope after this, you find a renewed perspective on the importance of volume. And being in a country with a renewed interest in Latin phrases, I like to leave you with this:

volumen prius pretium (volume precedes price)

And also as my maiden contribution to your quest for greater charting skills, I share one of my favorite INDICATORS that is simple and visually aesthetic.

Shown here as a chart overlay is what is known as VAP or Volume at Price.

And if you can go back to “The Wall” analogy, you might find it insightful as to the aspects of SUPPORTS and RESISTANCES. I am sure you can easily spot here how price action behaves in relation to the volume congestion zones. Enjoy.


Contributor:

Name: Jojo Gaston
Investagrams Username: @JojoGaston0

About the Contributor:

Jojo Gaston is a partner/mentor at BoH Society, an online trading support group that provides traders’ education, and data-driven trading format for local stocks, forex, and other foreign markets.


Categories
Featured How to & Advice

How To Trade With Confidence: Trading and Investing Lessons Via The Last Dance

“I’ve missed more than 9000 shots in my career. I’ve lost almost 300 games. 26 times, I’ve been trusted to take the game-winning shot and missed. I’ve failed over and over and over again in my life. And that is why I succeed.” – Michael Jordan

Photo Credit: clutchpoints.com

Lesson #1: Scared Money Never Wins. Scared Players Never Make The Shot.

Fear of Losing Money Holds You Back. Michael Jordan missed more than 9000 shots in his career and lost almost 300 games. He missed 26 game winning shots but that never stopped him from persisting and coming back up.

Whatever happens in the game has happened in the practices. It is not new. It is ROUTINE. You don’t win a championship with one shot. Neither do you win championships in a single game. So it does with trading and investing. Making one shot is just making a good trade. Consistently making good shots and sharpening yourself to be a better field goal trader and shooter is what makes your team and yourself a champion.

In the 1997 NBA Finals, Steve Kerr was ready to take the shot. He was ready. Watch the documentary. Michael Jordan and Steve Kerr knew that if they were going to double team MJ that Steve would be open and he had to be ready to win the championship. Without him, the Chicago Bulls would not have won the 1997 NBA Finals. Steve Kerr wasn’t initially the great player that he became. He grew to become one of the best shooters in the NBA on all-time stats. Take a look at all the field goals of the most iconic players that ever played the game of basketball. People know Michael Jordan but he had an outstanding supporting cast who became greater because he helped push them to expand and grow to their potential.

Wikipedia Stats of Steve Kerr:

Stephen Douglas Kerr (born September 27, 1965) is an American professional basketball coach and former player who is the head coach of the Golden State Warriors of the National Basketball Association (NBA).[1] He is an eight-time NBA champion, having won five titles as a player (three with the Chicago Bulls and two with the San Antonio Spurs) as well as three with the Warriors as a head coach. Kerr has the highest career three-point percentage (45.4%) in NBA history for any player with at least 250 three-pointers made. He also held the NBA record for highest three-point percentage in a season at 52.4% until the record was broken by Kyle Korver in 2010.

From a 3 point field goal percentage, you have to appreciate that Steve Kerr had more consistency than Jordan and Kobe and higher than Stephen Curry.

Lesson 2: Who’s in your Starting Five Lineup?

Jerry Krause, is painted as a villain at times in the docuseries but you cannot argue he assembled the best team ever. Was he the greatest manager of his time? Yes. He got the greatest player in the game, Michael Jordan from North Carolina. He got the greatest coach in the game Phil Jackson before the world knew. He got hall of famers and arguably the top 2 player of the game Scottie Pippen. He got Dennis Rodman, another hall of famer Top 50 best players in the league and best defender. He had Luc Longley, Toni Kukoc, Steve Kerr, and Bill Wennington.

The Chicago Bulls he assembled in the 1990s came from nowhere to being the greatest dynasties in the NBA, winning six NBA Championships from 1991-1998 with two three-peats. The Bulls was the only NBA franchise to win multiple championships while never losing an NBA Finals series in their history. In fact, during the 1995-96 NBA season, Bulls won 72 games in a single season setting records only to be broken after the Golden State Warriors 20 years later during the 2015-2016 NBA season broke it thru 73 games.

Do you realize the greatness of that team? Do you realize how many all-time highs and multiple potential baggers and cash flows? Would you have wanted to be the Jerry Krause who created this Starting Five Lineup? That’s enviable. Obviously, you need multiple guys who do a great job and, once you have it, you don’t rebuild the team and destroy a franchise that has won you several championships. How many great companies went from 1 to 100 or 1000 that you’ve sold too early?

I’ll name you my own examples. Tencent is very memorable to me because at the end of the day, this was a pick of mine ever since I laid my eyes studying on Tencent even during 2008. This was something I convinced even my boss at that time to purchase for a multi-decade bagger. WeChat is now 9 years old. January 21, 2011: Tencent Debuted Messaging App.

If interested, I wrote about these 10X opportunities in the last decade in this article I’ve written in my personal blog. At the end of the day. Tencent continues to make all-time highs and has gone a long way from a gaming company to the largest technology conglomerate in China but also arguably the world’s most valuable companies. For more info, read this article: More than 10X Opportunities In the Last Decade & 10X Trends in the Next Ten Years

Lesson # 3: Winners Win. The Key to Wealth Creation is Holding Winners.

I studied winners in the markets. I studied the “Michael Jordans” of the market and what I’ve learned is that age doesn’t derail their greatness. I followed their blueprints and following one winner helped me find more winners. Consider the fact that $AMZN went from 1 to 2500 in 23 years. Shopify went from 18 to 800 in 5 years. Neither of these ecommerce companies have stopped ratcheting all time highs and this is true for all of them whether $MELI, $OCDO, $SE, $PDD, $BABA, $JD, $ETSY. Their legacies have not been damaged and the worst thing a trader can do is to decide to trade their GOATs. Why do you want to rebuild your winning franchise if it’s performing so well? Why do you sell your strongest winners? I’ll show charts just to blow your mind and I hope you’ll join us explore greatness not just in players, companies and the names you want to own in this world.

Strive for Greatness.


Contributor:

Name: Nikki Yu
Investagrams Username: @facelesstrader

Channels:

Twitter: @facelesstrader
Spotify: Facelesstrader
Website: www.awesome10X.com
Facebook: www.facebook.com/FacelesstraderPH
Medium: medium.com/@nikkiyu
Youtube: Awesome10X

About the Contributor:

Nikki Yu holds a Chartered Market Technician (CMT) designation, is Philippine Chapter Chair and has been working in the financial industry for over a decade. Prior jobs include equity research assistant, private bank marketing assistant, equity trader and broker. She is currently a financial advisor to clients in Wealth Securities Inc. and lives in Manila Philippines. She enjoys teaching about the markets and holds workshops teaching individuals how to create their long term nest eggs. Her medium profile www.medium.com/@nikkiyu. Her Spotify channel is Faceless Trader. Twitter is @facelesstrader. She teaches people how to globally invest in 10X trends via www.awesome10X.com. Subscribe to her free daily and weekly videos through Youtube: Awesome10X.


Categories
Featured How to & Advice

Read Between the Lines: A Silent Guide to Interpreting Charts

As a newbie who wants to delve into trading the financial markets, whenever we do a quick search on the Internet about trading, most of the time, you will encounter charts involving mostly candlesticks.

If you’re that trader who’s struggling with reading candlestick charts because of the “noise” it eventually generates causing you to overthink your executions or worse, FOMO, and you wanted an alternative to reading those price charts, then you might want to continue reading. We are going to talk about one of the most underrated views that you can use at your disposal – line charts!

Have you ever wondered what kind of charts analysts use on CNBC? If you try to watch some videos on the web then yes, they mostly use line charts (or some of you might argue mountain charts, but technically they still use lines).

If you’re going to transition from candlesticks to lines, you may need to detach your emotions when looking at candlesticks. But if you’re a newbie and this is the first time you’ve read about lines, then great, you can read this coming from an empty cup.

As with any other trading tool, there are advantages and disadvantages of using this chart view so let’s carefully take a look at them.

Clearer supports and resistances

The struggle I had during my early stages of trading was actually plotting supports and resistances. If you’ve been following me in the early stages of my trading journey, I used to utilize the Donchian Channels indicator to spot supports and resistances. So here’s an example of its usage with a period length of 10:

However, the problem with using this is that it might also give false levels causing you to create too many psychological levels inside your head.

Now let’s see when we view this chart using lines:

That’s better, and cleaner too!

Looking at the last examples will entirely depend on your visual preference. But with enough practice, you will get used to this.

It’s also easier to draw Fibonacci Retracements as well which brings us to the next advantage of using lines and MY NUMBER ONE REASON why I prefer using this view over candlesticks.

Lines can serve as your secret weapon for Elliott Waves

What are Elliott Waves? I’m not going to delve in too much on the topic since I know that there are contributors better than me who can explain more on detail but I will give you an idea on what it looks like just by looking at this illustration:

Source: babypips

Don’t get me wrong, I know a lot of awesome Elliotticians like Limitless Investor and Javi Medina who use candlestick charts on drawing Elliott Waves – and yes! I actually tried drawing those waves using the candlestick charts but guess what? It was a real headache for me!

In the brink of giving up on waves, a short conversation between me and Roy Lacsamana last InvestaSummit 2019 completely changed my approach to charts and it can be summarized in this statement:

“You should try Elliott Waves since you’re a musician, it suits you.”

And I can’t believe he was right! After weeks of figuring out why I was struggling, eventually, I found the reason why I was personally having a hard time understanding the waves – I was looking at the wrong view!

To put this into perspective, let’s reverse engineer an Elliottician’s chart from Limitless Investor, let’s say you have this example:

Since this is how I learned to understand Elliott Waves by reading other people’s charts, here is my perspective on his Elliott count using my custom retracement:

If you compare the two charts, it’s the same view – we’re just using different lenses.

Lines provide pure price action

So far I’ve only found both a pro and a con of using lines – it only gives the closing price. It sounds ironic when you think about it since the goal of the lines is to minimize the noise that you see in the charts, especially for those traders who started with candlestick charts.

Bounce and breakout plays can somewhat frighten you as a trader if you rely purely on lines. One way to remedy this is to look at lower time frames to verify if an area is a support or resistance, but we’ll save that for another post.

Or you can just quickly switch to candlesticks and observe if the last candle shows signs of strength or weakness.

And yes, big and sharp moves created by lines can also give you hints of gaps when you switch to candlesticks.

If you are planning to transition to lines or a newbie and you feel like there’s still “something missing” in the charts, there’s actually an indicator that can help you deal with this problem and we will talk about it in the next section.

A Parabolic SAR can be your trusty sidekick as well as your “alternate candle high”

Have you ever got into a dilemma wherein you had a good entry but for some reason, you’ve created these psychological barriers that prevent you from holding or taking profits?

This is actually the reason why I got rid of A LOT of moving averages and stuck to only ONE moving average – the 200-period moving average.

The Parabolic SAR (Stop And Reverse/PSAR) can serve as an alternate indicator for the rest of the commonly used moving averages (20, 50, 100) and the signal is pretty straightforward to understand:

  • When a dot is below the price, it’s an uptrend signal.
  • When a dot is above the price, it’s a downtrend signal.

It’s a trend-following indicator in a way that you can use the first instance of the change of direction as an entry or exit signal. How is this an “alternate candle high” you may ask? We’ll make the charts do the talking:

Less is more

The candlestick is not the only view that you can utilize whenever you want to read price charts. There are other views that you can look at if candlesticks scare you. Sometimes the reason why you can’t execute your trades is maybe you have a lot of indicators that unconsciously give you noise.

In order to understand what view will suit you in your trading, you should discover what you’re visually comfortable with especially if you’re in it for the long road.

Anything is an opportunity, you just have to know where to look!

Now go out there and backtest to find out what trading style suits you and stay tuned for the next posts!


Contributor:

Name: Marvin Alec Padua
Investagrams Username: @thetradingcomedy

Channels:
www.facebook.com/thetradingcomedy
www.twitter.com/alecscorner
www.instagram.com/thetradingcomedy
www.thetradingcomedy.finance.blog
https://tinyurl.com/AlexCornerSpotify
https://micky.com.au/author/apadua

About the Contributor:

A self-proclaimed “Lazy Elliottician”, Alec is a former mobile app developer turned independent singer-songwriter and busker, who goes by the stage name “Alex Corner”. He has a couple of songs on Spotify and other music digital platforms. A self-taught trader, he also created his own trader persona – “The Trading Comedy”, where he documents his trading journey in the Philippine Stock Market and beyond. He is currently a finance writer for Micky News as well as a casual gamer and streamer.


Categories
Featured How to & Advice

When is the Best Time to Invest?

The best time to invest is when no one wants to sell AND when no one wants to buy.

An uptrending market is supported by buyers and one of the factors that can lead to a reversal to a downtrend is if there are no more buyers to support the price further. While a downtrending market is supported by the pressure of sellers, one of the factors as well for it to reverse to an uptrend is if there are no more sellers to pressure the price further down.

When everyone is earning and everyone feels like a genius, including myself, during a good phase of the market, economy, company or organisation, you can’t stop the feeling as Justin Timberlake said.

I remember the post about the Lamborghini traversing in commonwealth. Where a certain individual posted on social media and was frustrated that someone in the street is driving off their expensive car while the country is in bad shape due to covid19. While I personally believe there is nothing morally wrong for driving a luxurious car, anyone who knows that the world is not black and white can see that this person driving his/her Lamborghini does not owe anything to anyone at all. It’s not his/her responsibility and not his/her fault.

In analogy, why should I be sad just because everyone around me is sad? In Filipino, “Dapat ba malungkot ako if lahat ng tao sa paligid ko malungkot?” The answer is no.

In relevance, why can’t I be greedy when others are fearful? Should I also be fearful just because they are fearful? I thought the market moves based on what everyone thinks or sees? Why can’t I be fearful when everyone is greedy?

If you were observing the market during 2017. You might be aware of this crazy asset called Bitcoin. At its peak it reached $19,000 parabolically in December of 2017. I remember before it hit all-time high at $19,000 it was slowly peaking from $1,000 to $3,000 in 3 months. Then $5,000 to $8,000 in 1 month. Then $10,000 to $17,000 in just a few days. So on that it went from $18,000 to $19,000 per bitcoin in just a few minutes.

When the crowd is in a euphoric state and no one wants to sell, that is likely the best time to sell your position. A year later $BTCUSD dropped to $3,200 from its all-time high of around $19,000 in December 2018. That’s more than an -80% drop.

The chart below shows the 2008 market crash. Lehman Brothers, one of the largest banks in the US, shocked the global markets when it closed its doors. This was one of the reasons why the global markets crashed, especially the US Stock Market. The $PSEi was not spared and was badly affected.

Some had speculation that the financial system was over. (By the way, 2008 was also the time bitcoin was invented as a hedge against the current financial system.) But there was one fund in the Philippines that was poorly performing but called the bottom in 2008 when no one wanted to buy stocks because everyone else was selling.

It was a brave call by Wilson Sy, dubbed as the Warren Buffett of the Philippines, and that fund was ranked as one of the best mutual funds managed by the Phil Equity management. Wilson Sy and Miguel Agarao were awarded as one of the best fund managers in the country. They bought when most investors were selling and not interested to buy. Imagine in 2008 the financial system was close to collapsing and you told your friends to invest in the stock market, they might have thought you were crazy!

If you’re getting in early on a sleeper stock and everyone is fearful and no one wants to buy it, try to look for signs of reversal for a buying opportunity. Conversely, check when a stock is too parabolic and no one wants to sell. When everyone gets too euphoric and believes that the stock is going to the moon, that can be a good time to sell your position. This is what you call a contrarian approach.

This does not apply all the time; stocks that go up 100% in a month can go up another 50% in a few weeks, while stocks that make new lows can continue to go lower.

In Conclusion

“Be FEARFUL when others are greedy. Be GREEDY when others are fearful.”
-Warren Buffet

Sources:

Philequity: https://www.philequity.net/

Philequity – Awards Best Fund Management:
https://www.philequity.net/news.php?id=20190823173404300
https://www.philequity.net/news.php?id=20181212124330609
https://www.philequity.net/news.php?id=20100713202022323

Wilson Sy Philequity Protege: https://www.youtube.com/watch?v=qqq442nxvL0
Philequity Fund Performance: https://www.philequity.net/pefi.php?mode=Snapshot

Disclaimer: All insights here are not financial advice and are subject to risk. The contributor will not be held accountable as this is his own opinion and bias.


Contributor:

Name: R. Cruise
Investagrams Username: @limitlessinvestor

Channels:
www.investagrams.com/Profile/limitlessinvestor
www.facebook.com/imlimitlessInvestor
www.instagram.com/limitlessinvestor
https://t.me/limitlesstraders
www.tradingview.com/u/Limitless-Investor
www.youtube.com/channel/UCTAuxhwjliCGHBsPNQx32Xw

About the Contributor:

Limitless Investor / R Cruise – Elliottician, private fund manager, and cryptocurrency liquidity provider. Trading for 6 years already but considered a true trader for the previous 3.5 years only as he believes that a true trader must have gone through and traded a bear market. Whether in the long or short side is profitable. Specialty in reversal trades, psychology combined with Elliott Waves and fundamentals.


Categories
Featured How to & Advice

The Golden Indicator

Have you ever wondered when you first started trading in the financial markets on whether a golden indicator and strategy exist? Is there such an indicator that is far superior to the ones we currently know right now?

It is normal for a beginner to seek for a means to have an edge in trading. People would seek foolproof and perfect strategies that they have heard or seen from various sources. They try to find the holy grail in articles or videos online. When I first read a book about trading, I immediately used every indicator that was taught in that material.

To the point that it looked like figure 1 and 2.

Figure 1. $DMW Chart

Figure 2. A Chart with many indicators. Source: FX Trading Revolution.

Referring to the figures above, when you first started learning how to trade, did your chart look like this?

I too am guilty of this. I thought that the more indicators present on the chart, the more accurate the readings and analysis would be. I thought that I would be more profitable when I did this on my chart.

Contrary to common belief, less is actually more. As you can see from the illustration above, having too many indicators would just result in “Analysis Paralysis”. This happens when a trader is about to place a buy order and experiences a “freeze” moment since all the indicators on the chart show mixed signals, some show that it’s time to buy while the others show that it’s better to wait. Using too many indicators may lead to missing out on a winning trade because you’re too hesitant to pull the trigger.

Figure 3. $HOUSE Chart

There is no such thing as a golden indicator or strategy known to mankind. Each strategy and indicator is unique. There are even some that contradict one another. For example, figure 3 shows $HOUSE. It is commonly taught that when RSI (14) reaches overbought levels (equal or above 70), it’s time to sell your position.

So not only do you need to know which indicator works best for your strategy, you also need to know the proper applications of it. For the case of the RSI, trading based simply off overbought and oversold conditions in a textbook manner is only advisable if a stock is consolidating. However, if you’re in a trending market, if a stock is overbought or oversold it’s likely that it will continue in the direction of the trend.

If you sold $HOUSE just because it was already overbought, then you would have missed the entire 100% move. Note that $HOUSE was in a clear uptrend and was making new all time highs at the time the RSI was overbought.

Figure 4. $FRUIT Chart

For illustration purposes, figure 4 is an actual trade that I did for $FRUIT earlier this year. This is how I chart, I mainly use Price, Volume, and EMAs. It may seem simple for a lot of people, but I realized that keeping it simple works best for me.

If you’re really looking for a golden indicator, I’d say it’s actually your TRADING PSYCHOLOGY. As said by countless traders, trading success is 80% Trading Psychology and 20% System used. Mark Douglas, the father of trading psychology, said that the best traders, regardless of the strategy applied, are those who can master their psychology and avoid the common pitfalls average traders go through.

More important than a golden indicator is using a strategy that works best for your personality and circumstances. For example, when I first started trading, I adjusted my strategy based on my current situation at the time. I decided to be a swing and a trend follower given the busy schedule at school. I was able to execute my trades well with the use of InvestaWatcher that lets me know whether to execute the trade based on price alerts.

It’s time to invalidate these trading myths that we hear all the time:

  1. A foolproof strategy exists.
  2. The more indicators that I use will yield more chances of winning.
  3. Mastery of a system is much more important than the mastery of oneself.

Contributor:

Name: Miguel Lorenzo L. Cagampan
Investagrams Username: @Gagambatrader

Channels:
www.investagrams.com/Profile/gagambatrader
www.facebook.com/gagambatraderph/

About the Contributor:

Gagambatrader is a personal brand that aims to provide value and content with regards to trading in the financial markets using Technical Analysis. Gagambatrader aims to influence and provide to the growing community of traders in the country.


Subscribe to our Newsletter

Join our mailing list for investing tips and stock market advice
to help you reach your first million.

You have Successfully Subscribed!