Theory and Experience are two different things. Although backtesting may give us expectation, the market will not always give us copycat results. The road to be a consistently profitable trader doesn’t end in theory but we must also adapt in the randomness of the market. Therefore, it is highly suggested that we must put your theory to test or at least check the charts on a daily basis even without participation.
What is Forwardtesting?
Forwardtesting is the testing of strategy in the actual market condition. Unlike Backtesting, this is where our biases are restricted since we can’t see the right side of the chart. The part of the chart which is the unknown and unidentifiable.
The void where only man from the future can predict 100%. All are probable.
Why is Forwardtesting important?
This will shorten our data gathering. We may combine the given data on our backtesting in analyzing if our strategy has an edge or not. Take note that like backtesting, forwardtesting alone may not give us an edge if done alone. We must forwardtest a minimum of 5 years of data to test our strategy in almost all market conditions if we want to use this testing method alone.
How to Forwardtest?
There are 3 methods I used in my forwardtesting method.
1. PAPER TRADING.
This is a similar process done on backtesting. Personally, after market hours, I will check the charts and see if there is a tradeable set-up within my rules or strategy that I am testing in the historical data. I will encode this to my excel file and check the next day if the entry-level was hit. Once the entry-level is hit, this will automatically be part of my data pool and will check in the following days if the desired exit level, whether cut loss or take profit level were hit. This is the best way to hasten your data gathering and analysis since both will be in theory level and you will know if your strategy works in the current market condition.
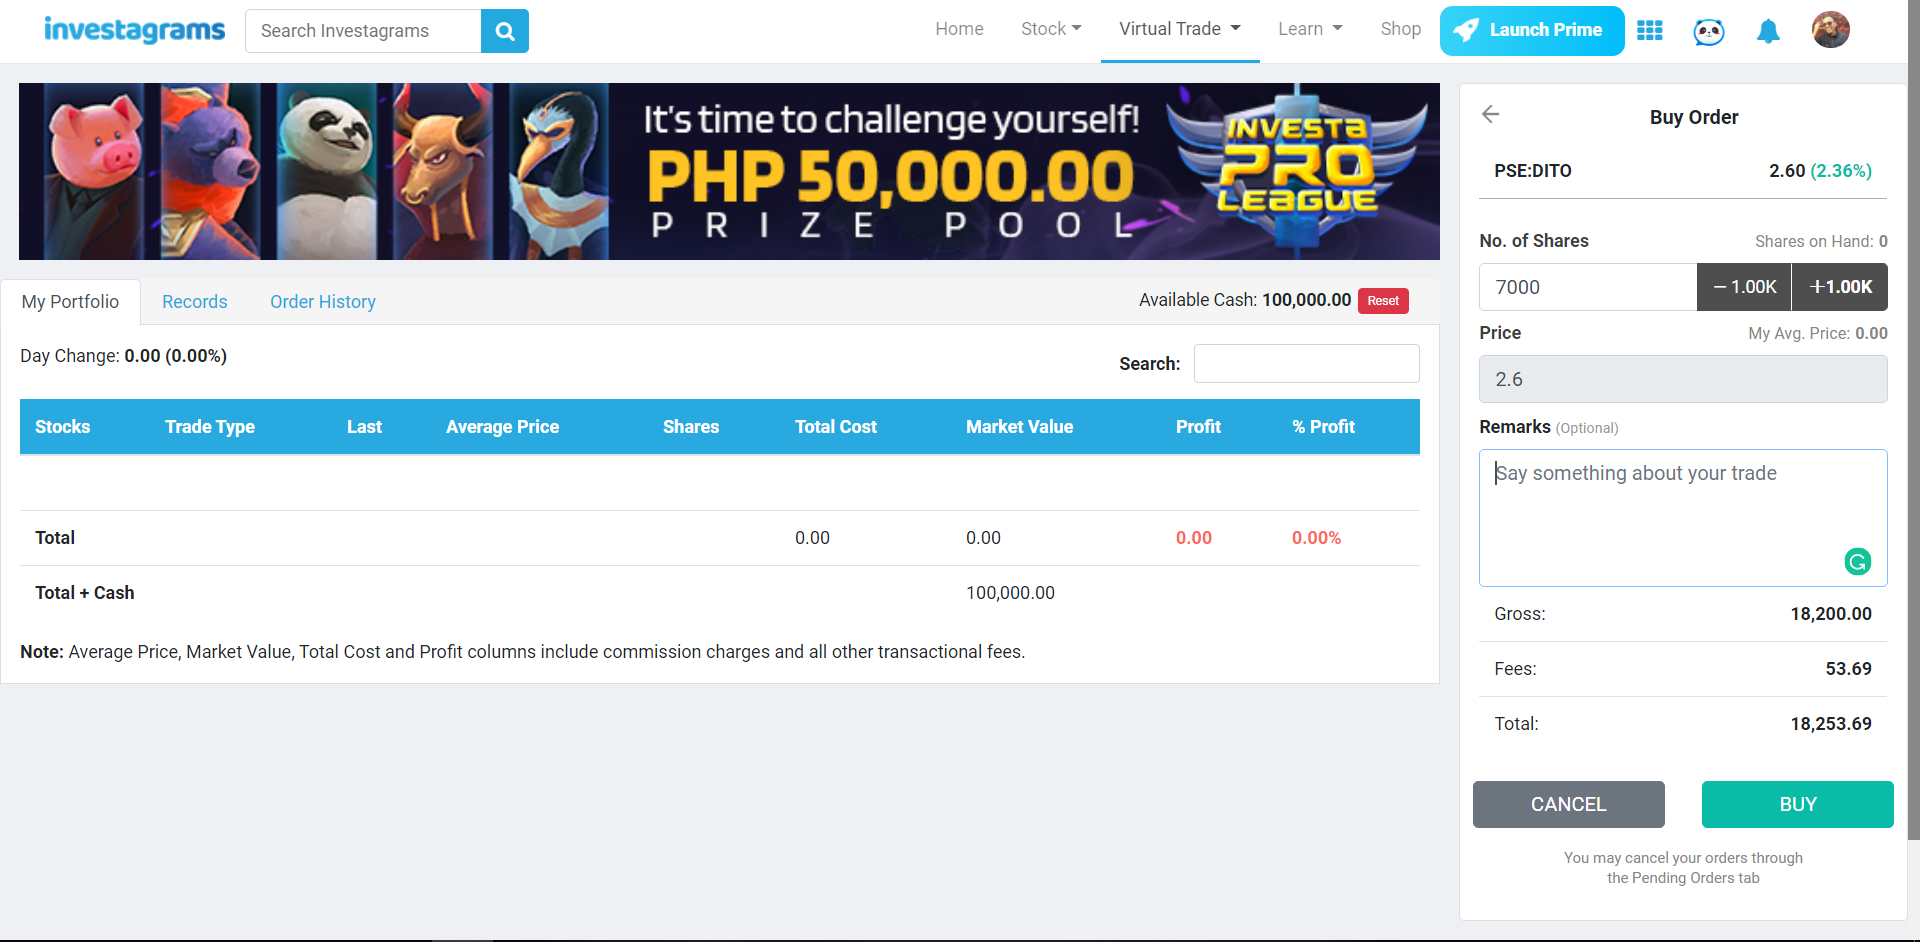
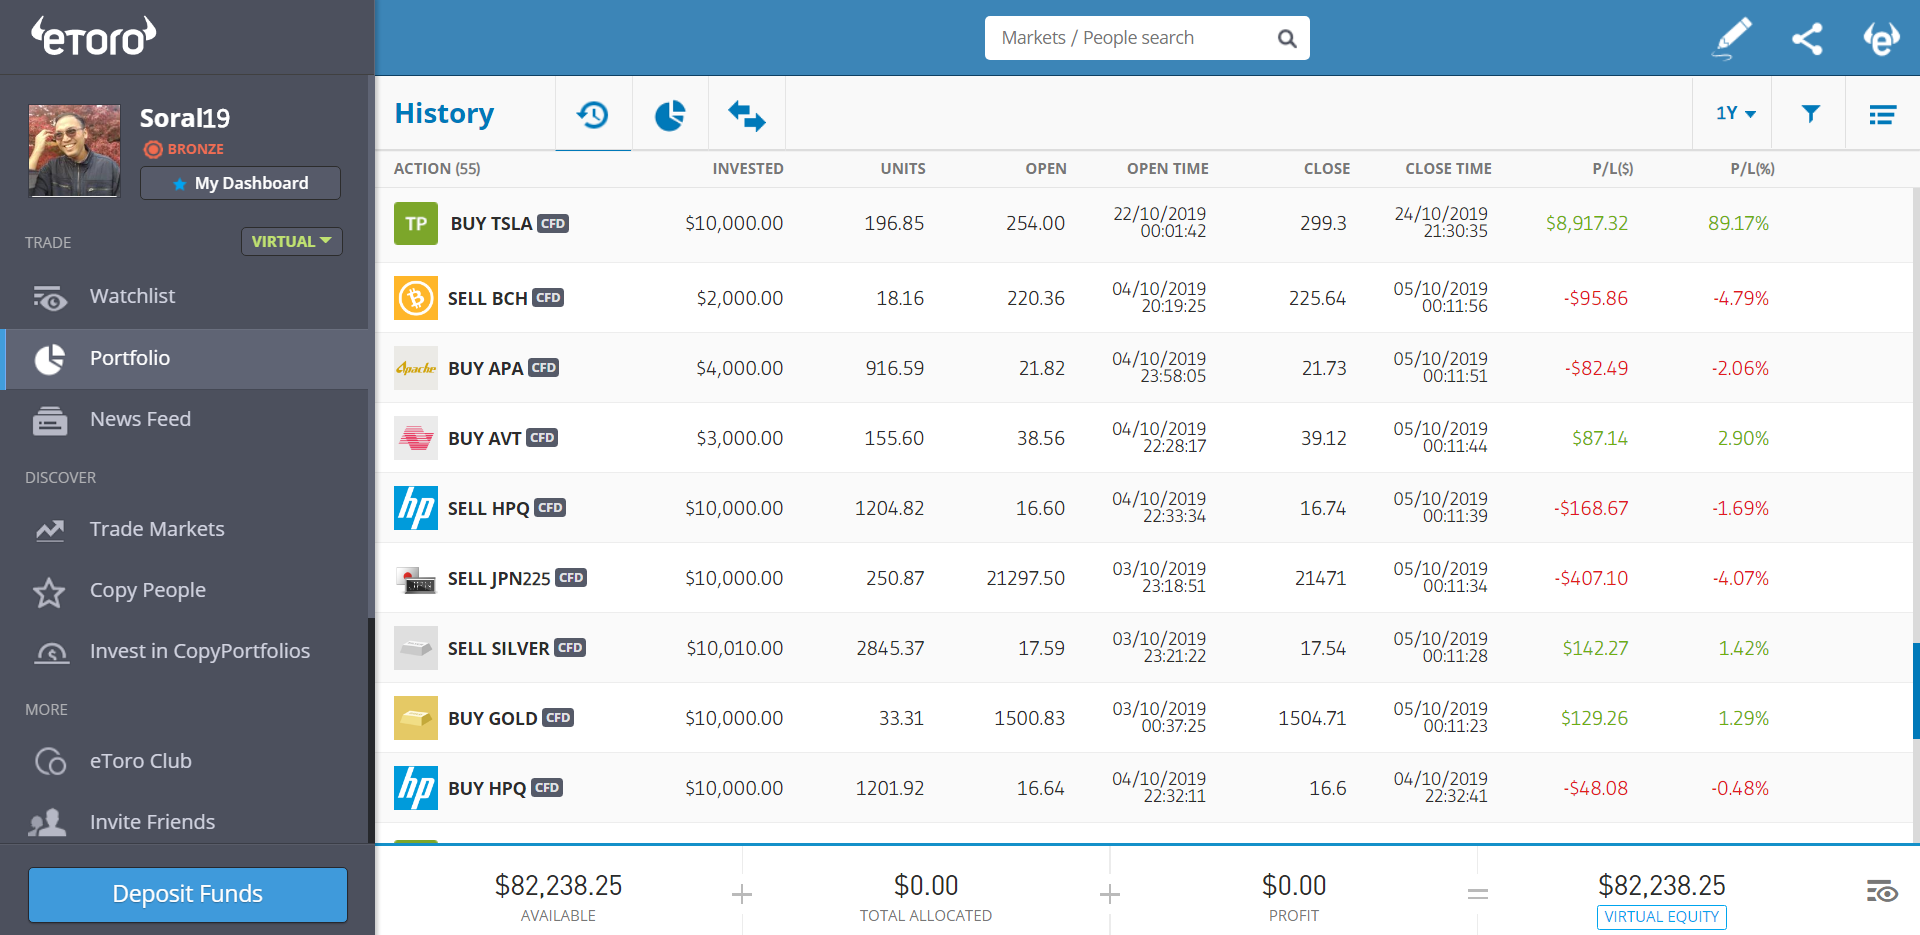
2. VIRTUAL TRADING.
There are tools that will give us the feel of the actual trading while not spending an amount of money. Some of the brokers (esp. in foreign markets) and Investagrams offer these services.
Before I stepped into the foreign market, I traded 6 months on the virtual platform to see if my strategies from the local market worked on the foreign market. This will give you familiarity with the market structure, market conditions, spreads, and the broker’s platform.
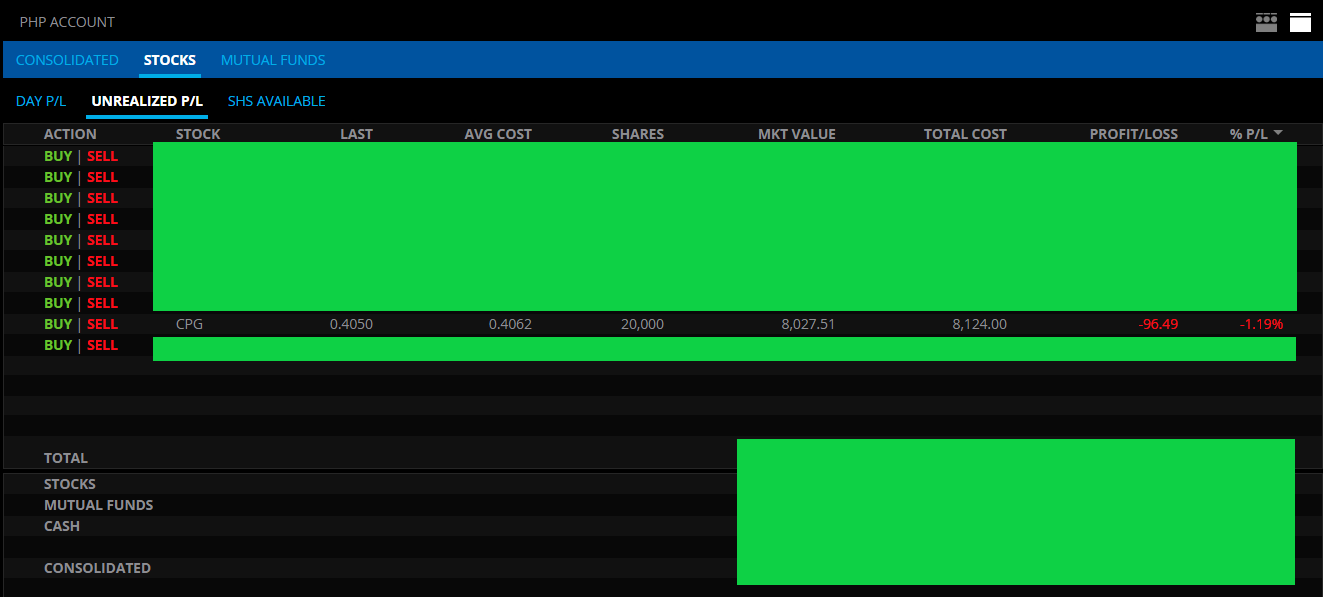
3. SMALL BETS.
This is where you put your money on the line for a strategy/trading plan that is already backtested but needs additional conviction in trading it on the actual market condition. Since money is on the line, emotions will be a factor in the decision of your execution. In this part, you will know if the tested data is tradeable based on your personality, emotional capability, and market’s actual volatility. Data gathering will be useless if you can’t execute the plan that you are testing. Start betting a small amount that is ok for you to lose. Treat it as if you are paying for a toll fee for the expressway so that you can go to your destination faster.
Personally, I am using a VAR (value at risk) at around 0.25% – 0.50% whenever I trade newly backtested strategies. However, strategies under Forwardtesting phase are my least priorities since it is best to prioritize your Triple A set-ups whenever that opportunity comes.
Tips: For local market to minimize the impact of your fees, your trades must be above Php 8,000.00
Always remember that theory was made to be executed. An idea without execution is just a dream. An execution without an idea is a disaster. It is important that theory and execution are hand in hand in your trading career. A good plan based on gathered data is your aftermath from your newbie days. The only thing you should worry about is executing it consistently with controlled emotions.
Trading is a continuous process of gathering data, testing your strategies, familiarizing your advantages, controlling your emotions and mastering your craft.
About the Contributor:
A passionate trader who aims to share the reality, the HOWs and the WHYs in trading. My goal is to help traders and investors like me to continuously improve and refine our skills to the path of mastery.
When you start out in the markets, especially if you began during a sideways or bear market, the first type of selling you get accustomed to is selling at a small loss or cutting your losses.
However, once the market environment finally becomes friendlier to a long-only market like the Philippines, you start to see some gains in your portfolio. Not just a few 5% to 10% winners, but you start to see your positions go up 20% to 30%.
You get hyped! Your hard work of studying the markets day in and day out and continuous cutting of losses finally paid off. You believe all your stocks are going to the moon and you’re about to experience your first bagger. All until the stocks you hold hit their resistance levels, make a climax top, or close below a key moving average and start to reverse. You give up the majority of your profits, or even end up at a loss.
What happened? You may be wondering. You had all these spectacular gains in a short period of time, but you lost it almost as fast as you made it. What happened was you didn’t know how to sell at a PROFIT. You got used to cutting your losses small and once the tide finally turned in the market you made some money, but only on paper. Selling at a profit is a totally different ball game from selling at a loss.
Our goal in this article is to show you three different ways on how you can take profits on your winning trades. Here they are:
Using a target profit
Selling into strength
Selling into weakness
USING A TARGET PROFIT
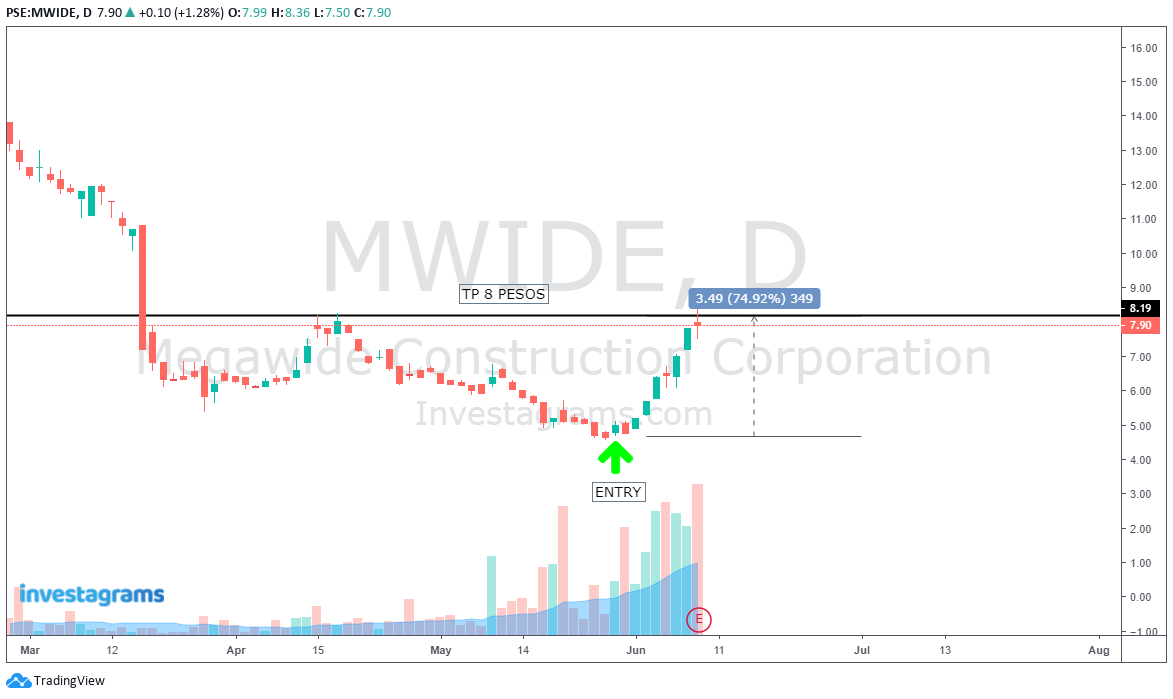
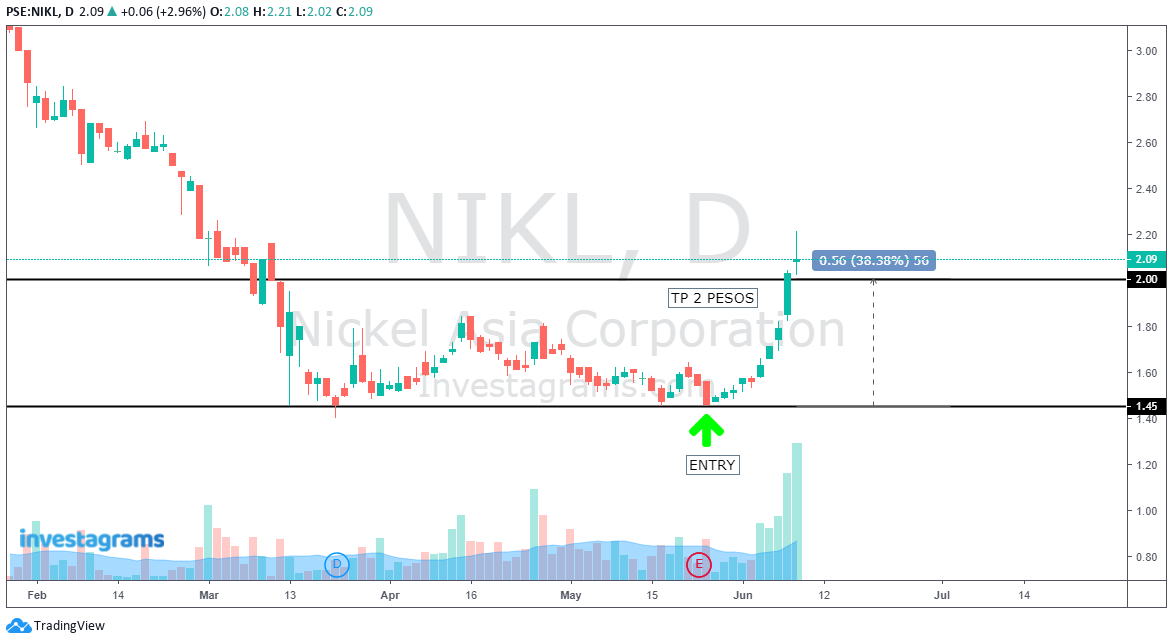
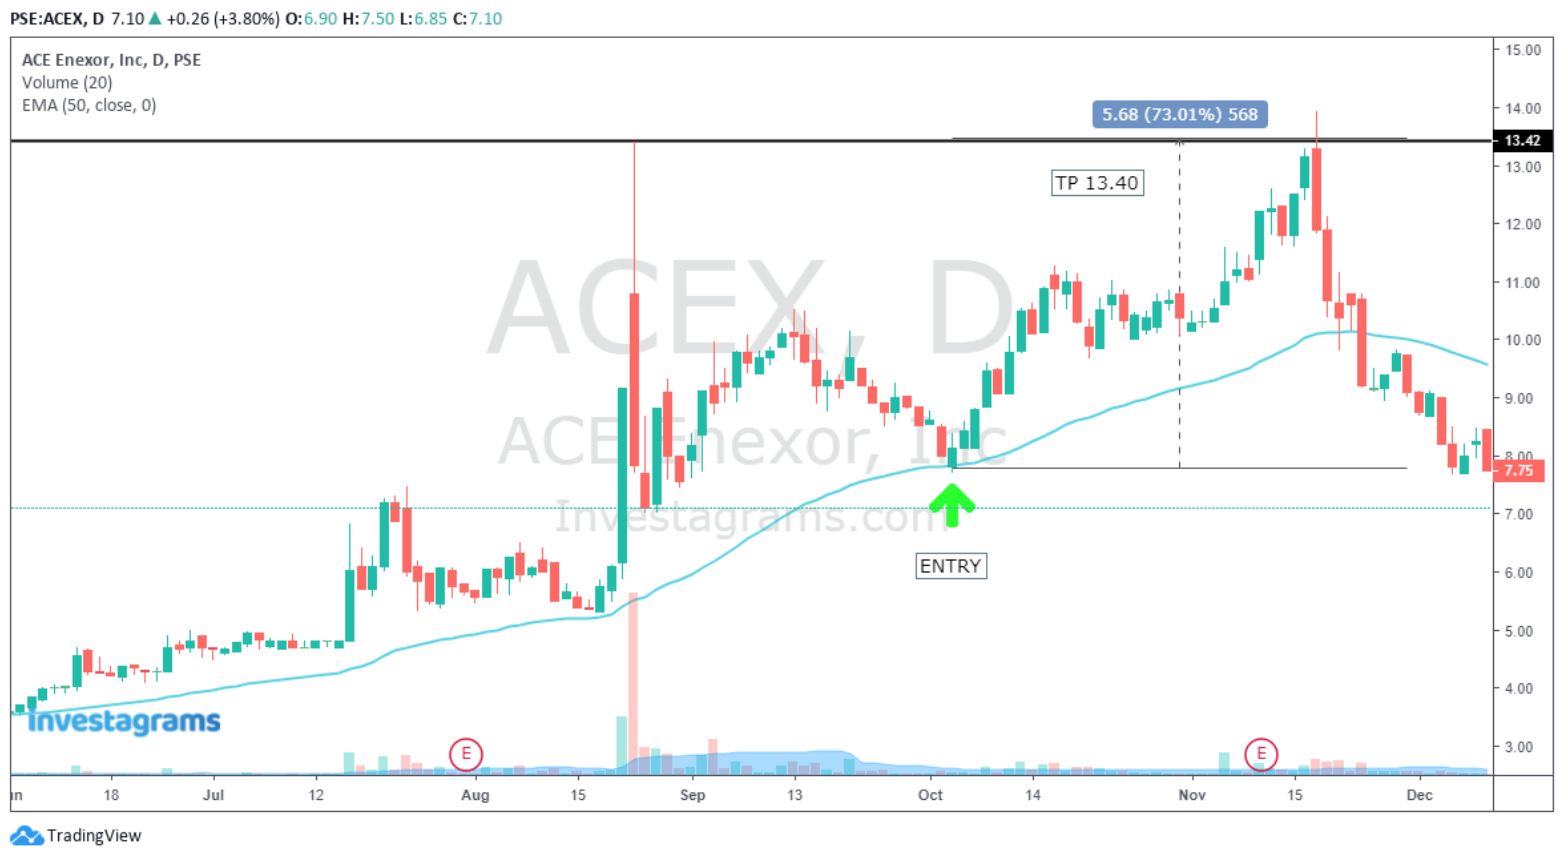
A target profit, or commonly referred to as TP levels, is a place in the chart where you sell your position at a profit. Your TP will usually be placed in areas of resistance; whether it’s an intraday high or a multi-year resistance level. Instead of further discussing what a TP is, let’s show you some examples.
SELLING INTO STRENGTH
Another style you can incorporate into your selling strategy is the concept of selling into strength. Famous growth stock investors and market wizards Mark Minervini and David Ryan usually sell into strength when they’re taking profits. Selling into strength means you’re selling your position (or a portion of your position) while the getting is good. You sell on the way up as prices continue to rise.
What’s the logic behind this? The reason you want to sell into strength is that you want to lock in gains before the stock starts to reverse. Selling into strength also ensures that your equity curve continues to go up in an uptrending fashion. This style is especially important for those handling big funds since you will need to sell your position not when you want, but when the market gives you an opportunity to do so. What better time to find a ton of buyers other than when the price is going up?
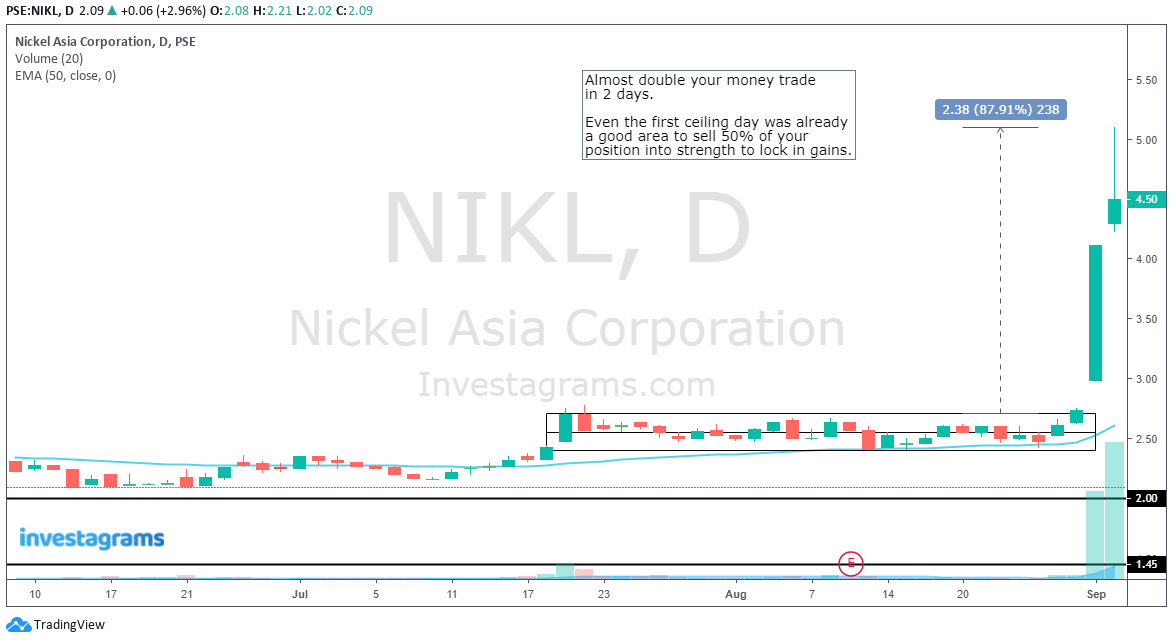
When you sell into strength, however, note that you’re most likely going to sell too early. BUT THAT’S OKAY! The goal is not to sell at the top, but it’s to sell at a price higher than your cost on a consistent basis. There are now hard and fast rules when selling into strength, but generally, you can begin lightening up on your positions when a stock is up huge in one day or makes a climax top (up 15%, 20%, or more) when everyone believes it’s going to the moon (climax top) or when the trade has made 2x your average gain.
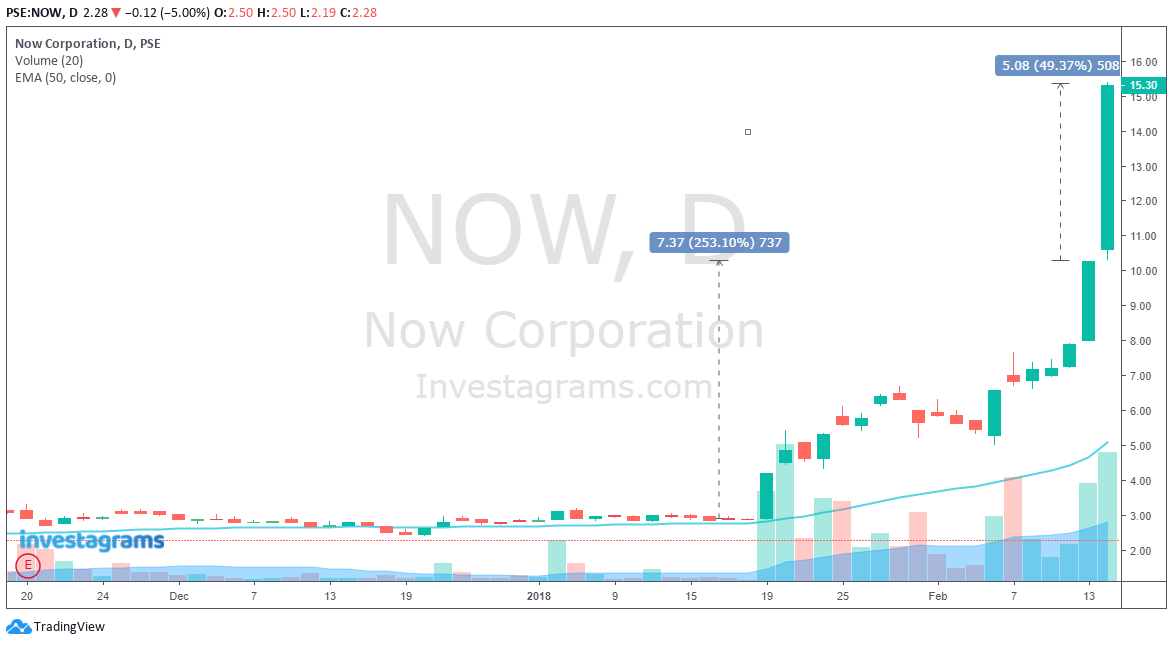
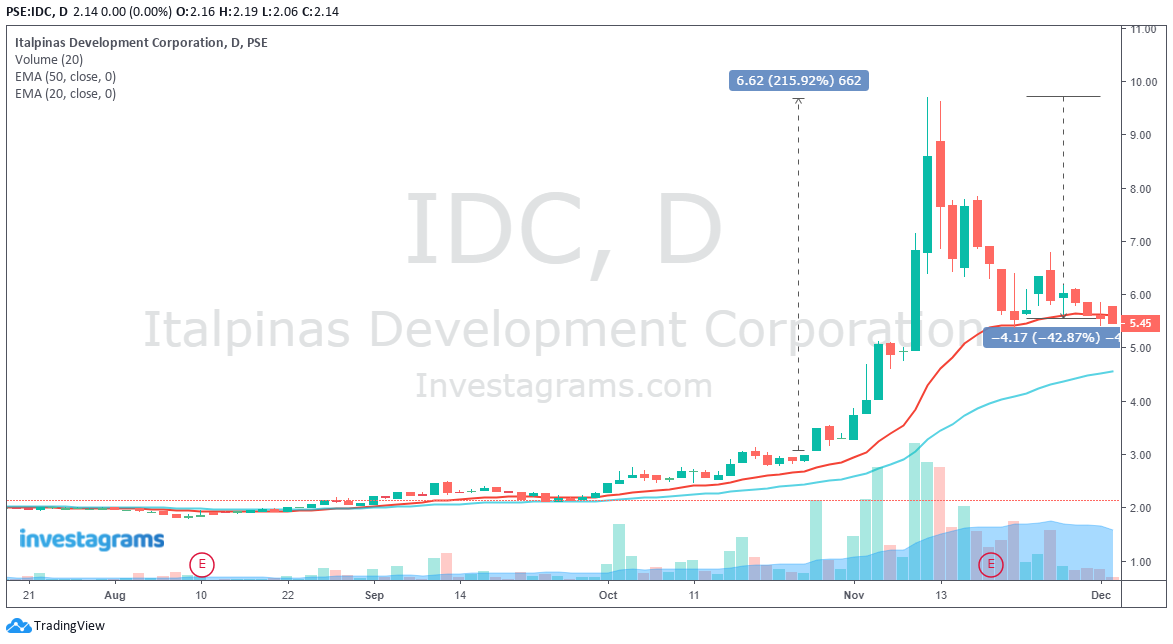
If you were able to get this below 10, the best area to sell into strength was at 15 pesos. The stock was in the process of putting in a climax top by going up 50% in one day after already going up 250% in a few weeks. People were also getting extremely euphoric, a dangerous sign. We all know what happened the next day.
Here’s another reason why selling into strength is a viable option, especially in stocks that get extended. If you planned to trail your profits on $IDC using EMA20, you would’ve given up 40% profits on the trade. Who wants to give up that much room? That’s why it’s important to sell portions of your position on the way up to lock in some gains especially when the stock gets extended, everyone gets euphoric, or the trade is 2x or 3x your average gain.
SELLING INTO WEAKNESS
Selling into weakness is basically trend following. This is the opposite of selling into strength where you tend to sell too early on the way up. When you sell into weakness, you wait for a confirmed reversal of an uptrend (by using trail stops of your choice) and sell on the way down. So if your tendency is to sell too early by selling into strength, when you sell into weakness you will usually sell too late.
HOWEVER, by focusing on selling into weakness during BULL MARKETS you may latch on to a market leader for a big move, possibly even a triple-digit return type of move. When you use trails stops, you’re basically going to be stuck with the trade until the trend reverses and the price closes below your chosen trail stop, if prices continue to go higher with minor pullbacks, then you may be in for a long profitable ride.
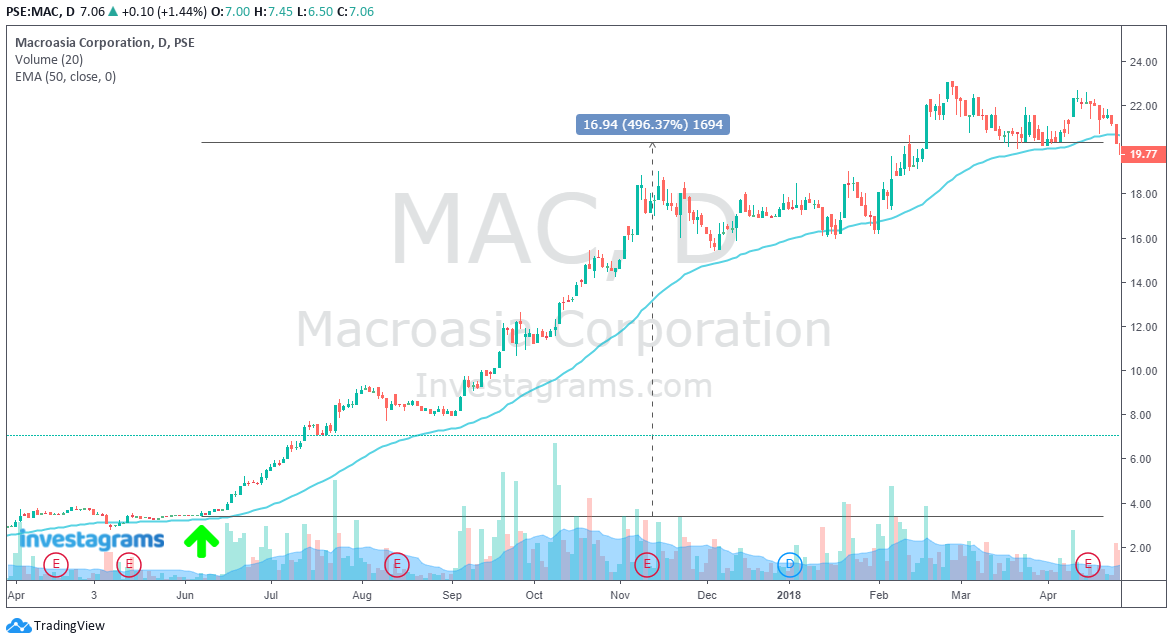
This is probably the best example to showcase the potential gain if you sell into weakness in a strong stock in a bull market. If you bought $MAC during the breakout at around June 2017 and trailed your position simply using EMA50, you would’ve been stopped out at around 19.70 pesos, a near 500% gain. This is the power of trend following.
IN CONCLUSION
There are no hard and fast rules for selling at a profit, what matters most is choosing the right approach that best suits your personality. No one style mentioned above is better than the other, there is only what works best for you. The most important thing to remember is that you must EXECUTE on your chosen approach. You’re also not just limited to choosing one of the three discussed, you can use all three depending on the situation.
You can also do a COMBINATION of the three approaches. You can sell 50% of your position into strength to lock in some gains, then trail the remaining half using EMA50 to take advantage of a potential big move. It’s up to you on what combination you want to use.
Most importantly, when selling at a profit DON’T KICK YOURSELF FOR NOT SELLING THE TOP! Here’s a quote by Baron Rothschild, a great trade from the 1900, “I never buy at the bottom and I always sell too soon.”
On June 24, 1987, a baby boy was born in a town in Argentina. While he was perfectly healthy by normal standards, he grew up much smaller than kids his age. Later on, he was diagnosed as having GHD or Growth Hormone Disorder and wasn’t expected to become taller than 150 cm in height.
Source: Google CTO
As soccer in Argentina and in most of Latin America was as close to people’s minds and hearts as their religion, the child inevitably became hooked with the sport.
His coaches of course thought that while his obsession and dedication to practice was admirable, he is not likely to become anything more than one of the countless youths that took on the sport and enjoyed the competition.
The limitations posed by his GHD was an obvious hindrance to whatever future he may have in soccer. After all, this is a sport where size mattered, and it would be unthinkable for anyone of such small stature to become of some significance. But while the odds appear bearishly insurmountable at this point in his life, a fast forward will reveal otherwise. We’ll come back to his story a bit later.
On a parallel but alternate universe, this man we all remember by the name of Michael Clarke Duncan was a familiar face in Hollywood movies. His imposing physique lent credible personas to a few memorable characters that am sure a good many may have seen.
At a glance he is an epitome of health, strength, and everything fit and muscular that many men can only dream of becoming.
Source: PETA
Michael Clarke Duncan was as bullish as any representation of what we aspire for and his conversion as a VEGETARIAN was to become a welcome endorsement to the healthy lifestyle movement.
But as fate would have it, it was not meant to be. He died of a heart attack in 2012 at age 54. Not exactly the story book ending that we may have expected.
As for the kid from Rosario, Argentina who for his “shortcomings” wasn’t given much of a chance by coaches and soccer fanatics, he is at present worth around USD400M and is considered one, if not the greatest in the world of soccer. His name, LIONEL MESSI.
Source: Google CTO
So what is my point?
In life, as it is in TRADING and INVESTING, what we see is not always what we get. As most who dabble in the realm of Technical Analysis (TA), the quest to find the next best trade lies in identifying if a stock is BULLISH or BEARISH. And since the PHL is a long only market the only option is to find one dominated by the bulls and avoid names where bears tend to prowl.
Hence the problem, how do you get into that trade where the end result is one that leaves a smile on your face from locking in gains or profits? Does TA really provide good probabilities in searching for that prospect?
The answer: IT IS ALL A MATTER OF PERSPECTIVE.
As in the above examples, what may look bearish may actually be a sunken ship with long lost treasures. Or bull-strong moves to new all time highs might already be the top of a cliff with bottomless chasm as you take the next step.
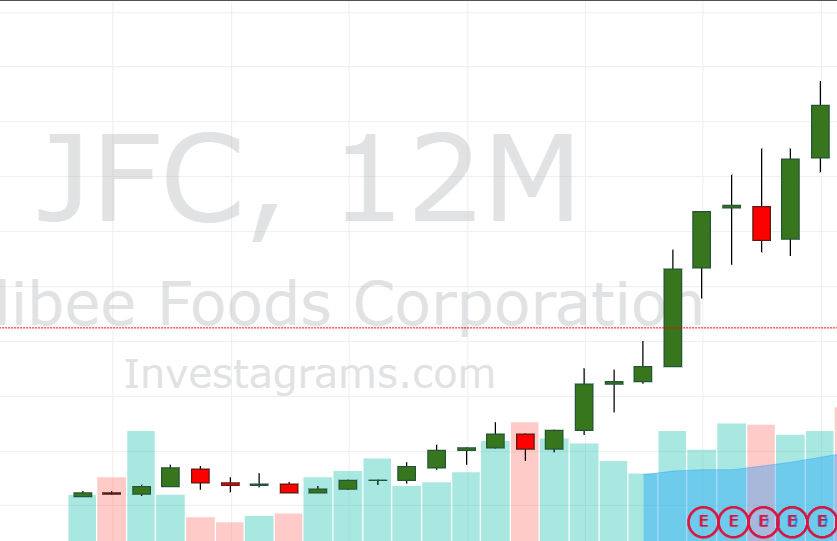
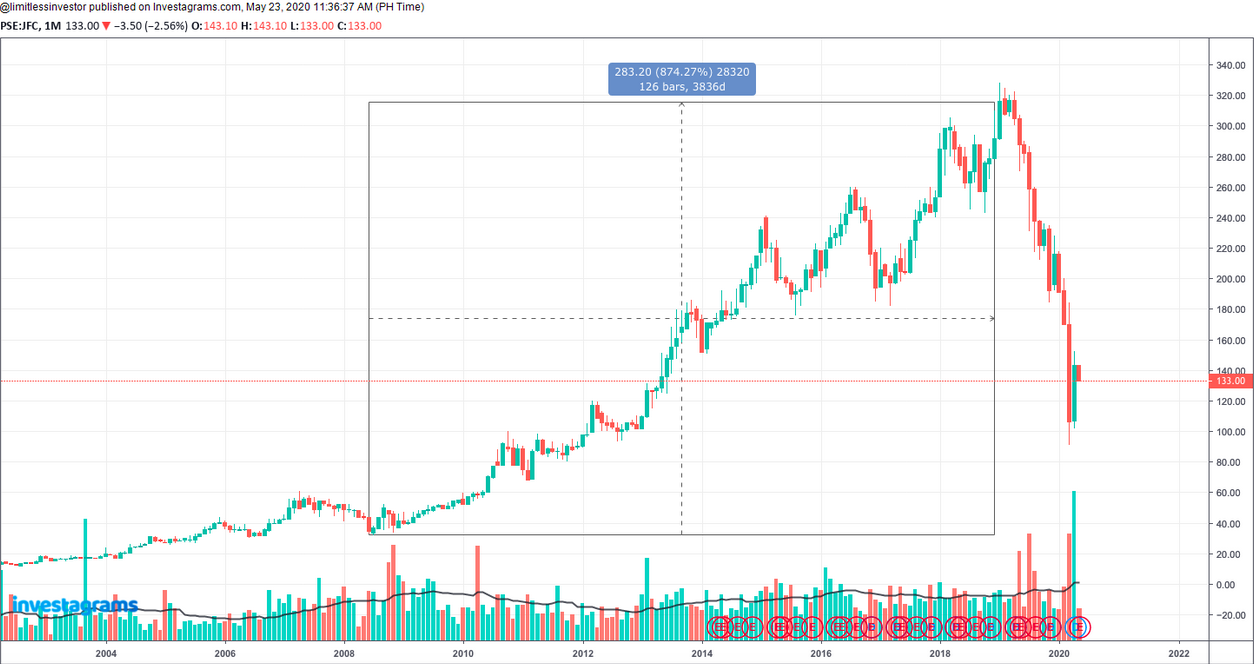
Let’s take for example this chart of Jollibee Foods Corp ($JFC). Since it was introduced in the stock market in 1993 at a little over 6 per share, it never looked back as its value grew by leaps and bounds.
Even after the 2007 crisis, it merely consolidated for a couple of more years before we saw it breakout from around the 50s level and into the triple digits. And up to until early 2019, $JFC found the zenith at 328+/share. For the last decade, it was the most bannered company highly regarded by many as the ultimate corporate success story for the country.
And of course, this yearly CHART says it all.
And for INVESTORS, the long term promises more rewards and the continued local and international expansions appeared as very good prospects. That was what many thought. In hindsight, the market was already then factoring certain “value-challenged” acquisitions, such that in February 2019 it started to hold back the bulls from charging higher.
Of course , and now also an afterthought, many were of the mind that $JFC was again just consolidating gains; a pause before resuming the trek to the stars. After all a stellar past performance and this long term chart speaks for itself.
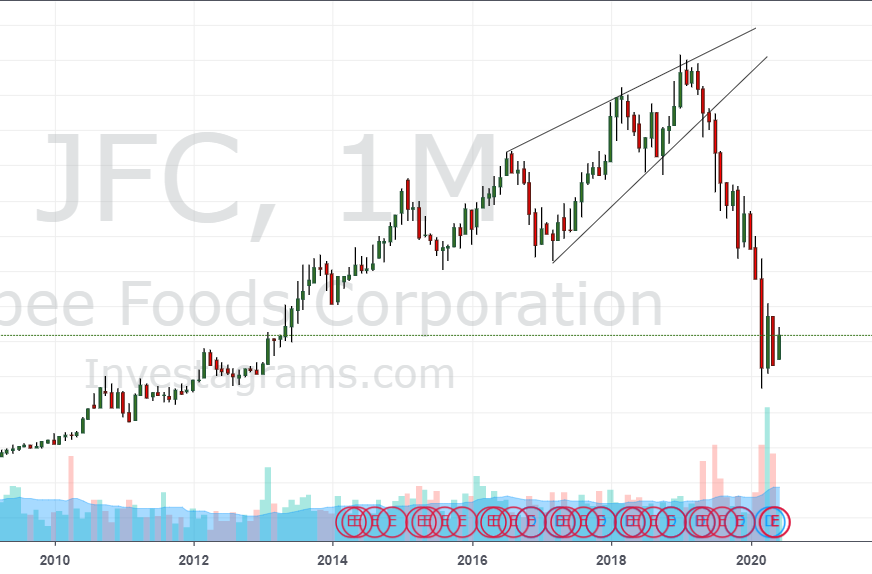
As a personal flashback, I distinctly remember certain conversations with relatives and friends on a Christmas occasion in 2018 where I was asked if JFC would make for a good long term investment. Knowing what I saw in the monthly frame chart, I politely told them that upsides were already limited at that point.
Of course there were exchanges as to how the fundamentals are great and all those similar praises, but having my faith in technicals, I simply smiled off from getting into any argument.
Because for TA believers as myself, there can only be very little doubt that a BEARISH RISING WEDGE had already formed in the near term perspective.
And as can be seen clearly in this monthly frame chart, its post effect was simply catastrophic.
MULTIPLE TIME FRAME ANALYSIS
In the mid 80’s, now a renowned trader and book author Dr. Alexander Elder made popular the concept of TRIPLE SCREENING. Being a man of science in the medical field, the standard practice was to have a patient go through a series or a battery of tests. This is obviously done for the purpose of correctly diagnosing a disease or simple ailments that a patient may be going through. As only after all proper examinations are run and cause identified, can prescriptions and or interventions be given to a patient.
Dr. Elder translated this simple idea into the realm of technical analysis. He espoused that looking at a chart in its different TIME FRAMES, specifically in the daily, weekly, and monthly frames can give a trader the objectivity to make a plan on how to trade that name. Dr. Elder’s bestsellers TRADING for A LIVING, and COME INTO MY TRADING ROOM are must-read books for beginners and intermediate traders.
And as we are now more advanced in our charting capabilities, we take this TRIPLE SCREENING concept a step farther and add other layers of INTRADAY frame charts to give us more in-depth views of price behavior and action. Thus without a doubt, our ability to make MULTIPLE TIME FRAME analysis, immensely and especially enjoyable using INVESTAGRAMS charts, are indispensable tools that can provide us with the most reliable information.
BULLS AND BEARS LIVE IN ONE ECOSYSTEM
Markets or stocks are usually labeled as either bullish or bearish. Both go through range-bound price action which we call and mark as areas of consolidations; In plain speak, PAUSES before it resumes to the path or whatever the trend it is on.
Corrections happen in bullish names, as bounces also occur even in a bearishly trending environment. The practical reality is that there are bears in a bull market and bulls in a bear market. The only question is who dominates the majority of the time.
Multiple time frame views will almost always correctly tell us how to formulate and manage expectations. As the analyses and conclusions will differ in each time frame (intraday, daily, weekly, and monthly) it is IMPERATIVE that one must focus on the time frame from which your trade is taking place in. The patterns that show up in the different time frames will have its own probability of realizing its potential. In the long term however, the ongoing trend should also likely prevail.
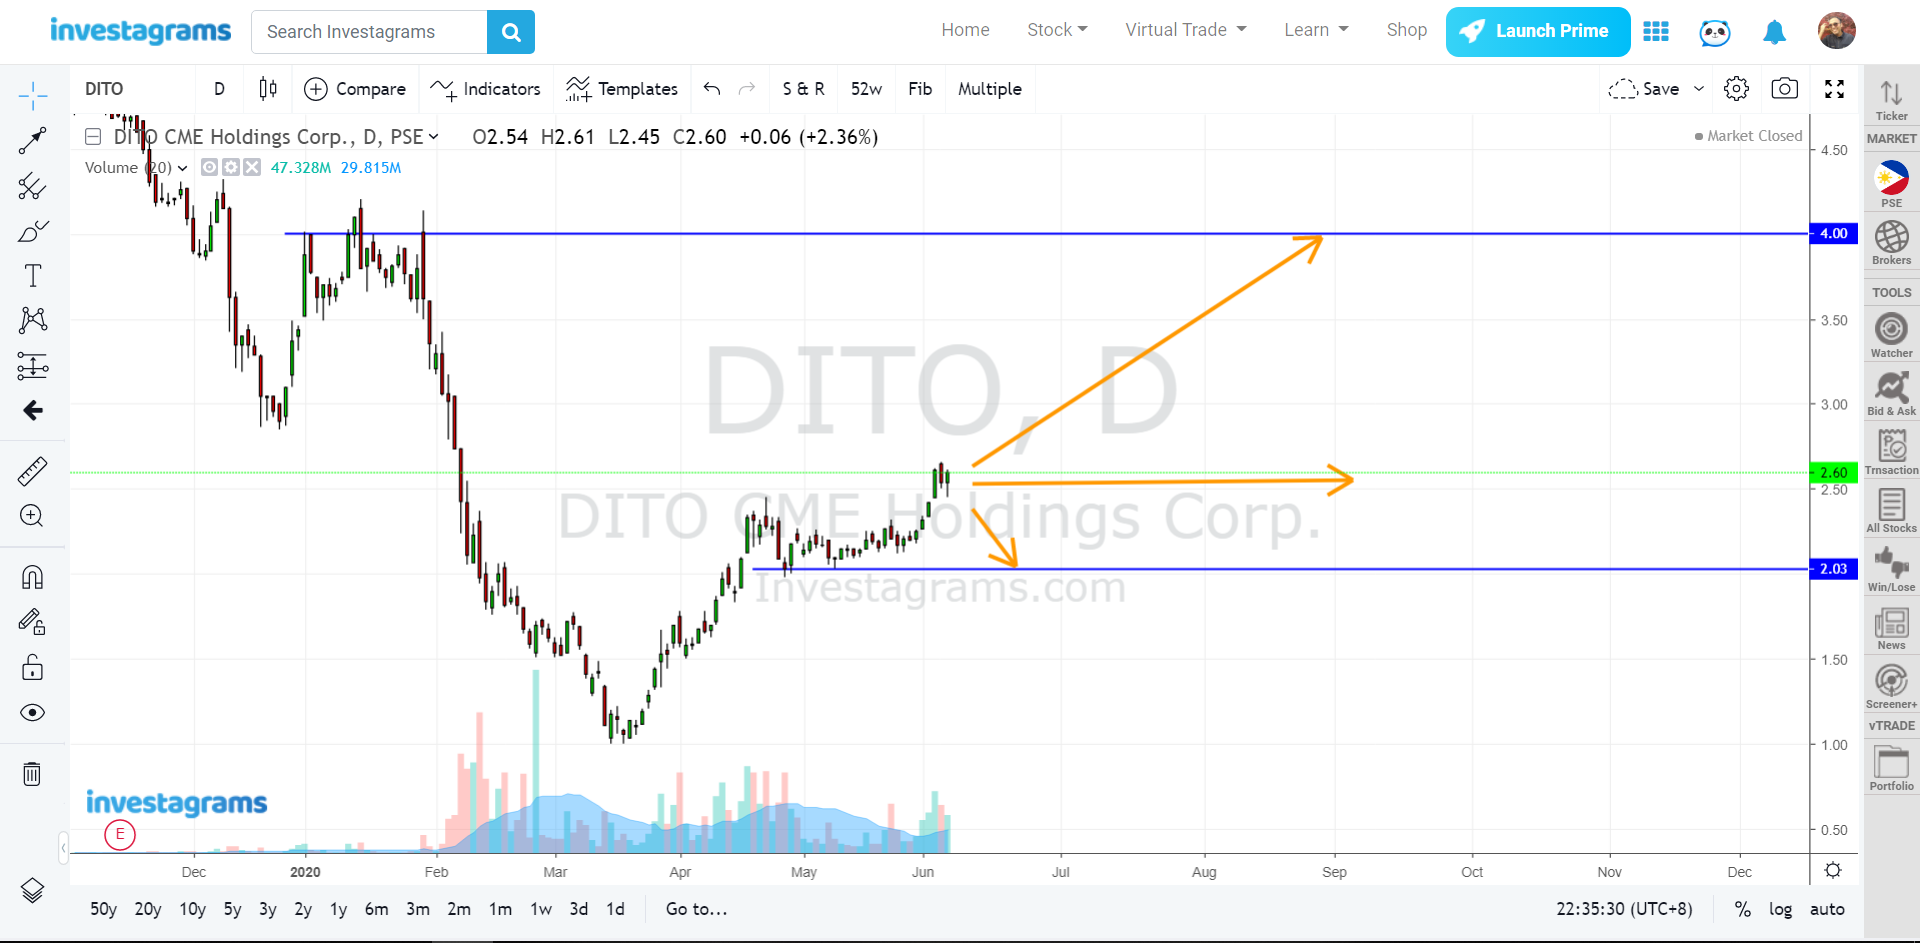
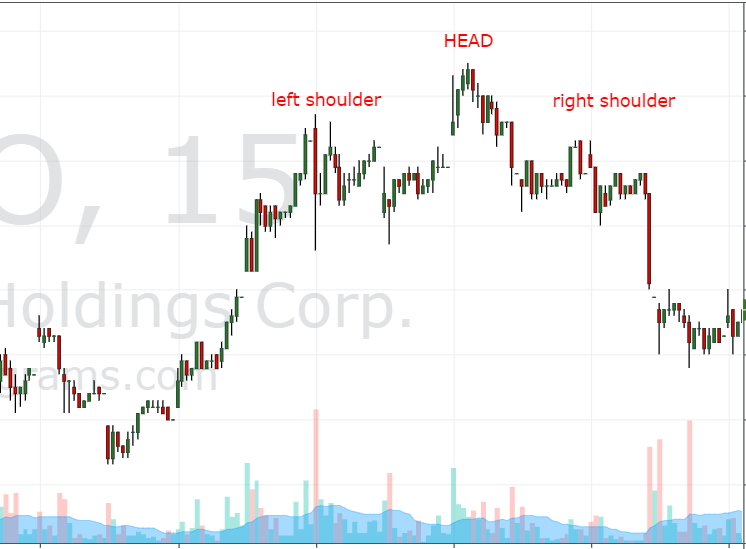
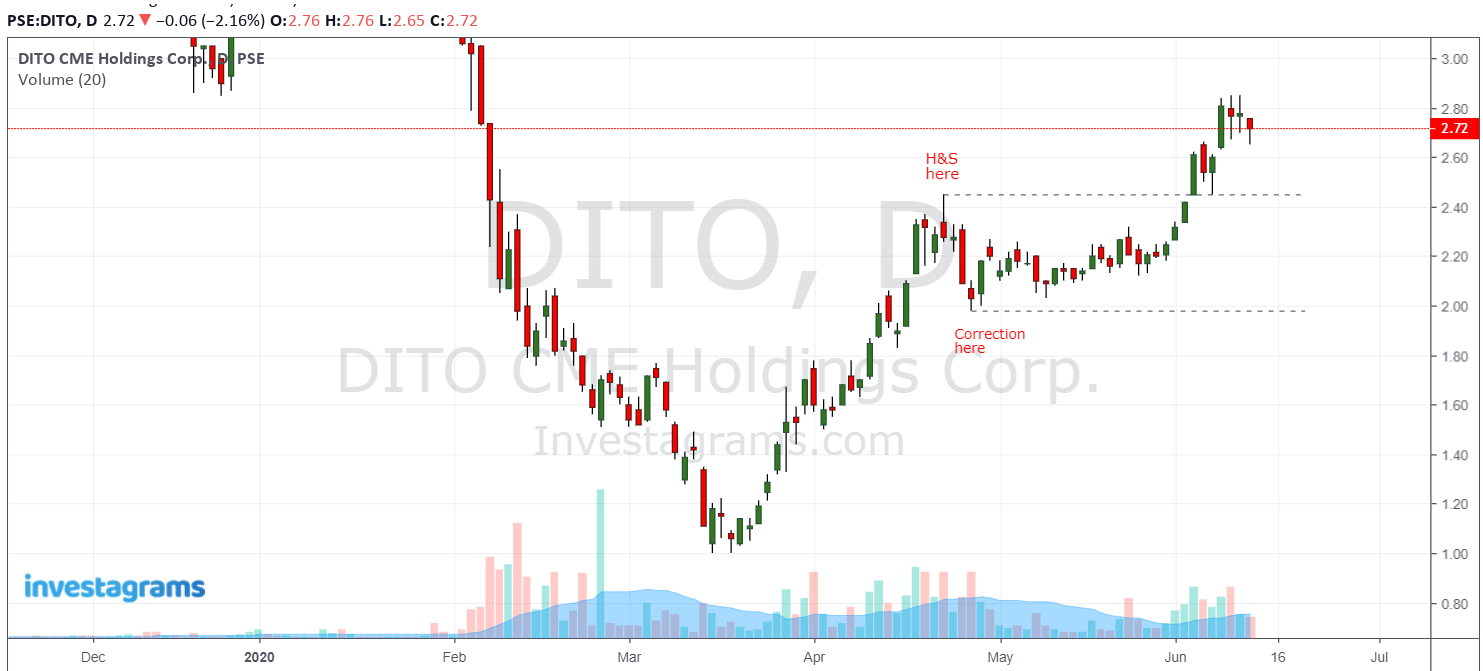
Take for instance this illustration of a 15-minute chart for DITO CME Holdings Corp. ($DITO) recently.
While this bearish head and shoulders pattern attempted and successfully achieved the expectation, the correction in this shorter time frame view presumably only spurred more participants to enter at the lower price points during this pullback.
Eventually, the bulls took over and the uptrend resumed as can be seen here:
To sum up, here are the key takeaways, we must all remember:
1. Technical analysis must always be FLEXIBLE, as patterns will occur in different time frames. While forming a bias is necessary to commit to a trade, it should never be rigid that it rejects what price action is actually saying.
2. The higher time frames will at most times be more significant. Most corrective pauses or consolidations will likely just become CONTINUATION patterns to the prevailing trend.
3. Multiple time frame analysis is essential in framing one’s expectations. It gives an objective basis to formulating trading plans and creating strategies.
Playing the market means learning to live with the bulls and the bears. It is most important that we recognize that they both lurk in the backstage. And when they each make an appearance to find the spotlight in moments we may least expect, we should all be ready to welcome them with open arms.
Although not necessarily with open positions since ours is a long-only market.
At present, the idea of short-selling being finally allowed might be as far-fetched as finding mythical fire-breathing DRAGONS sweeping through the ticker.
Oh well, nothing wrong with DREAMING. Hope springs eternal.
Jojo Gaston is a partner/mentor at BoH Society, an online trading support group that provides traders’ education, and data-driven trading format for local stocks, forex, and other foreign markets.
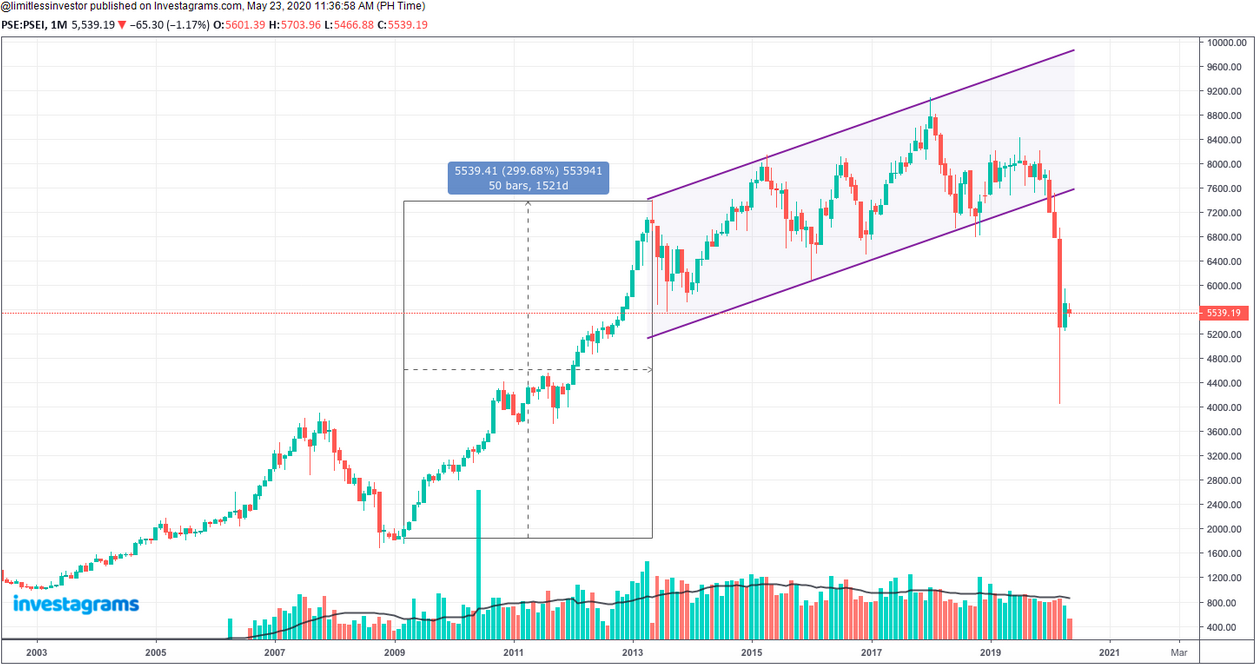
In my previous article, When is the Best Time to Invest? where I discussed when is the best time to invest, I made it clear that buying fear and selling greed does not apply all the time.
The $PSEi has enjoyed a long run bull run from 2008 bottom-up until middle of 2013 posting a +300% from the bottom. But still hasn’t changed the trend from 2013 to 2018 and just resulted in multiple pullbacks.
The country pre-Covid19 was one of the top producers of millionaires. These are not just peso millionaires but in dollars as well. With an economic boom of the rich getting richer, money flows from one place to another. Thus producing more millionaires along the way and this growth is attributed as well to stock market gains.
One of the most popular brands and stocks, Jollibee ($JFC) gained more than +800% from the bottom of the 2008 crash till its peak in the middle of 2018. A capital of Php100,000 invested in this stock would have become Php900,000 in just 10 years if one sold in the middle of the 2018 peak.
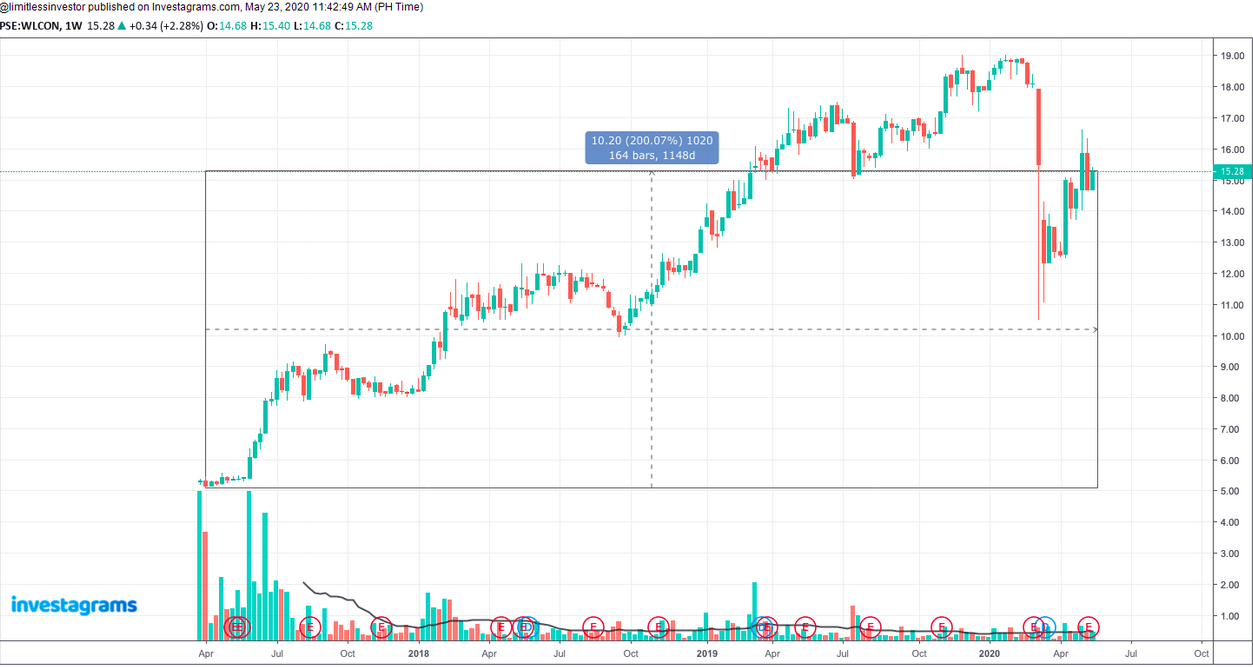
As posted in the previous article, in a bull market when everyone is earning and everyone feels like a genius including myself, you will hear a lot of success stories made from the surge in stock prices. There have been many successful IPOs (initial public offerings) such as Wilcon ($WLCON) trading from Php5 now at php15.28 as of the posting of this article. That resulted in 200% gain.
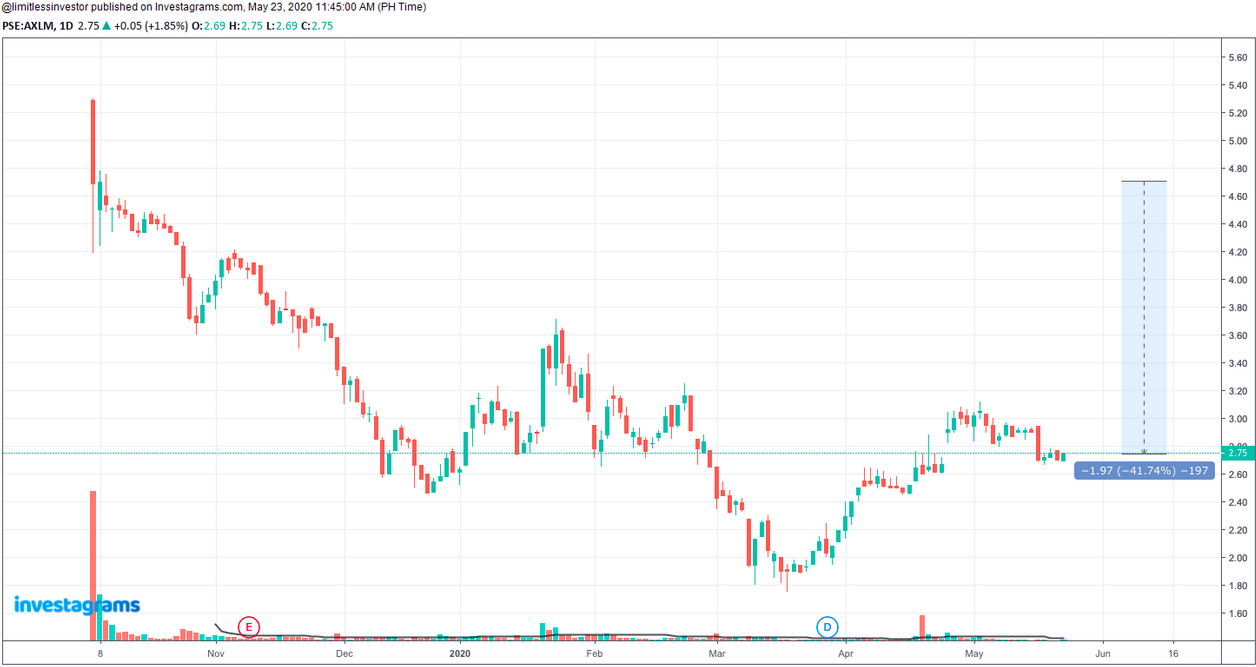
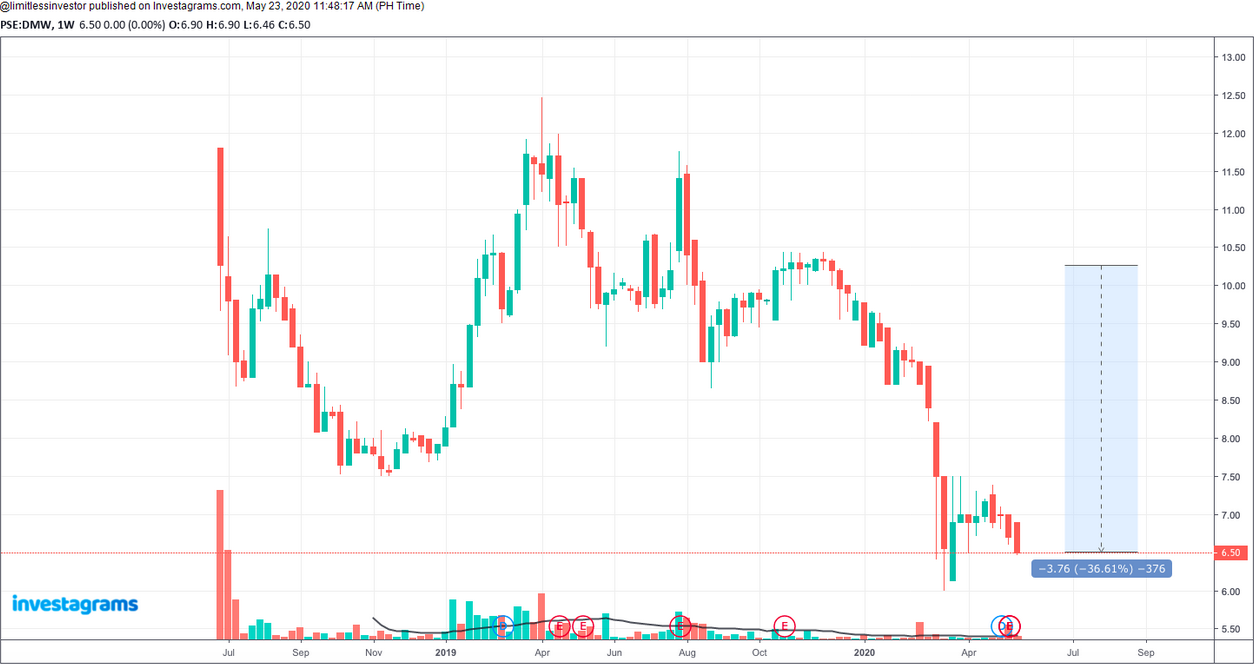
But it’s not Christmas every day. There are also recent IPOs that did not materialize positively. Such as Axelum ($AXLM) from its IPO price of Php5 is now trading Php2.75 as of this posting which resulted in -41% loss. Another example would be $DMW, a property company with an IPO at around Php12 to now trading Php6.50 as of this posting. That resulted in a -50% loss in value.
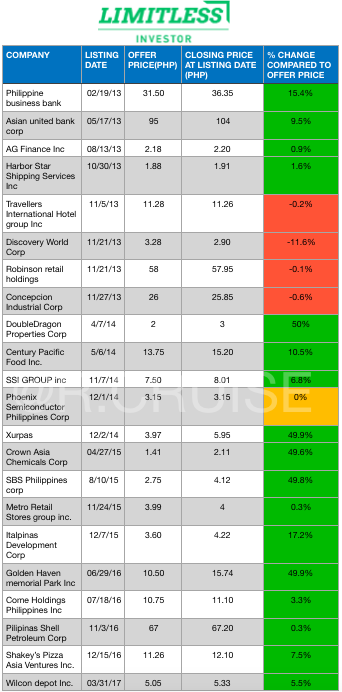
Most IPOs come from a bullish stance. When a company wants to list in a stock exchange, they either want/need to get more funding or pay the debt. They are bullish that the public will buy shares of their company. We had 22 IPOs on record from 2013-2017 and based on their first trading day out of the 22 stocks on average it returned 14.3% on the 1st trading day. There are 17 issues up including Wilcon which was mentioned in this article.
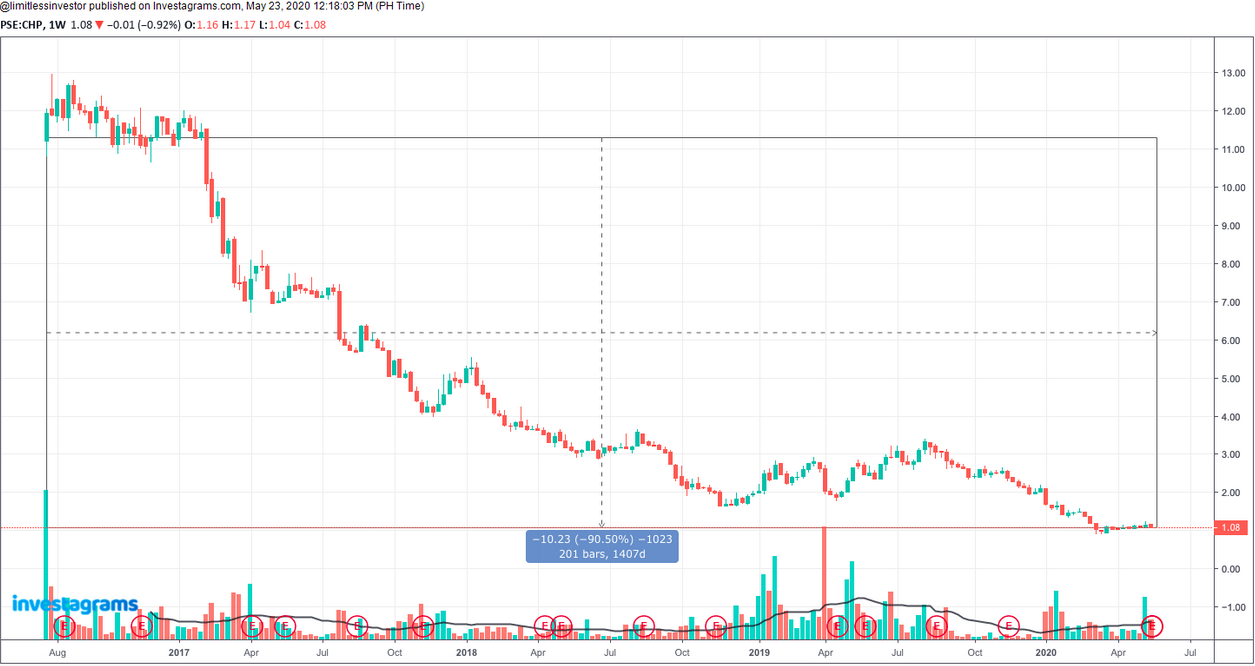
One of the IPOs in the table mentioned was $CHP or Cemex Holding Philippines. A cement company that decided to go public due to the BuildBuildbuild (BBBx3) program of the administration anticipating that demand for cement will be high.
On its first trading day, it reported a 3.3% gain. It was trading around Php11 in 2017. But as of this posting, it’s trading close to Php1. From its IPO price to the current trading price it has now resulted in more than -90% loss. Imagine being a director and shareholder of a company you helped build, but your investment in terms of paper value has already lost -90% if you held since the stock went public.
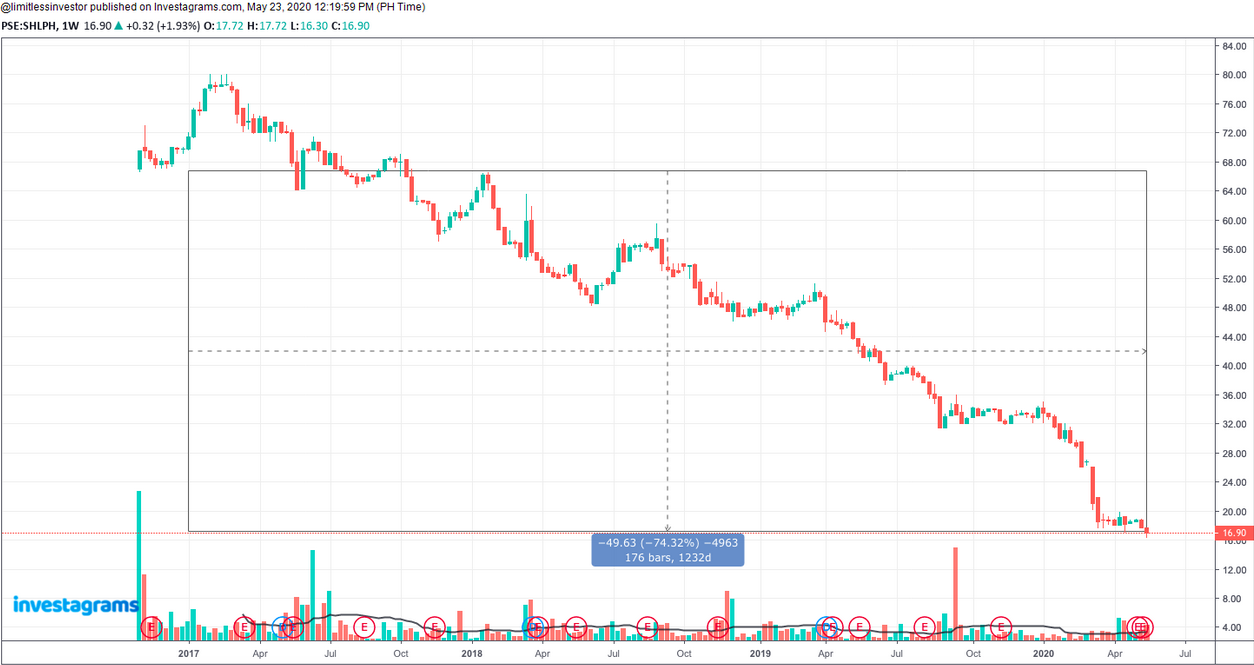
There are more cases like this, for this example, a big name like SHELL ($SHLPH)
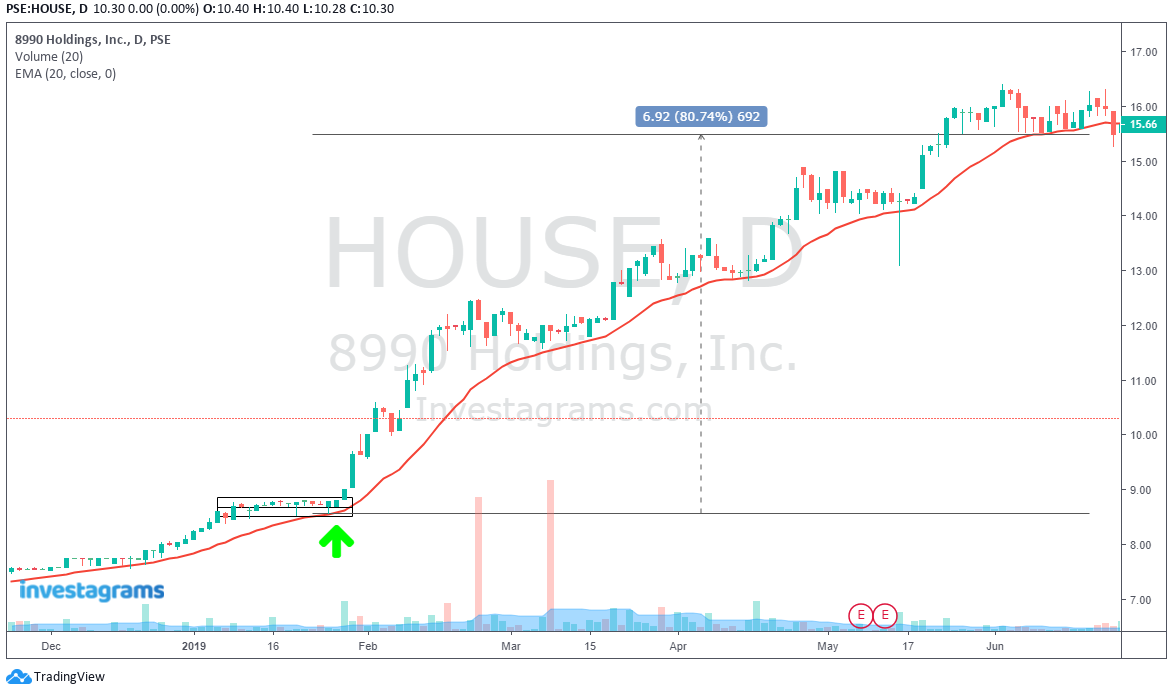
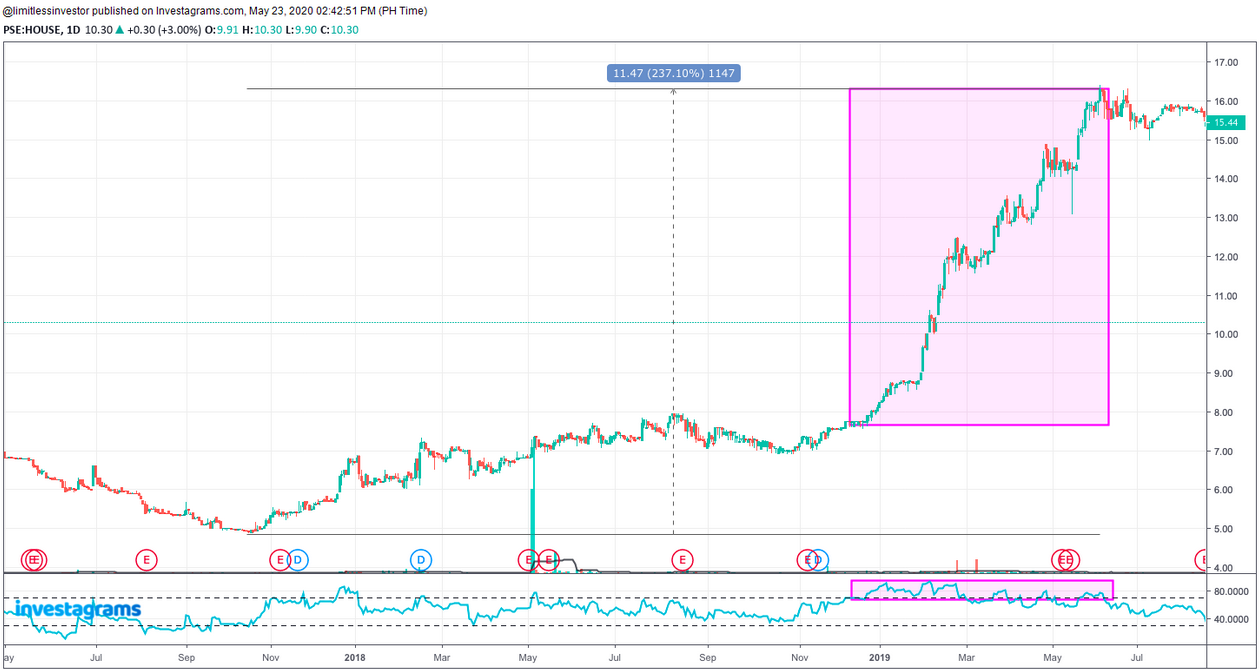
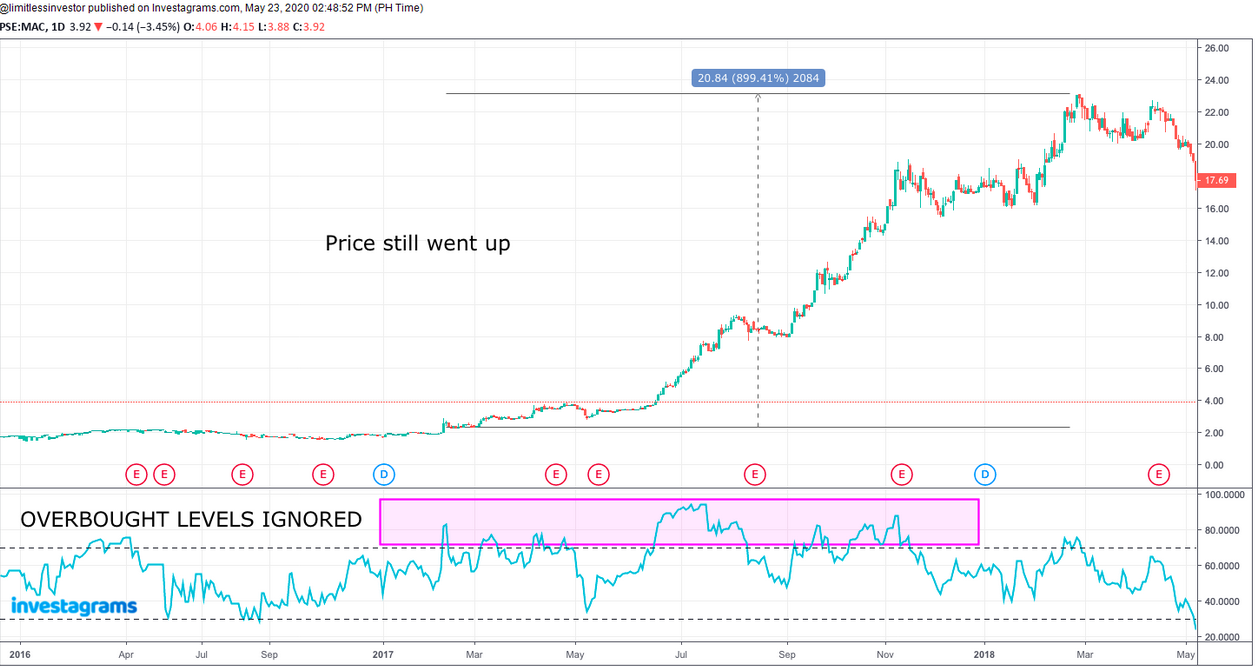
Not all stocks go to heaven. Cheap stocks can get cheaper and at the same time expensive stocks can get more expensive regardless if indicators are showing signs of weakness and/or overbought level. See $MAC and $HOUSE charts above.
In conclusion, risk management is the name of the game. Whether in stocks or other assets like real estate, commodities, paintings, cryptocurrencies, etc. It is important that you must know when to exit your investment or trade when it goes against your initial bias.
You need to understand the risk you’re taking relative to the potential reward. Do your own research so you can make INFORMED decisions. It’s not Christmas every day and nothing is permanent. This current Covid-19 crisis has wiped out a lot of wealth globally. The only thing we can control are our emotions and risk.
Limitless Investor / R Cruise – Elliottician, private fund manager, and cryptocurrency liquidity provider. Trading for 6 years already but considered a true trader for the previous 3.5 years only as he believes that a true trader must have gone through and traded a bear market. Whether in the long or short side is profitable. Specialty in reversal trades, psychology combined with Elliott Waves and fundamentals.
Now that we’ve gone around the globe and taken a look at some of the most prominent stock markets, it’s time to delve deeper into the US markets. Typically, many Filipino investors looking to diversify their portfolio begin with the US stock markets as these are the most reliable and accessible from here. We’ve already gone over the two main exchanges, the New York Stock Exchange and NASDAQ, in the last article, but here, let’s go even deeper into these exchanges and the indexes that guide them, in order to truly understand their complexities. Additionally, we will take a look at the Dow Jones Industrial Average, another important index in the US markets.
The New York Stock Exchange
The NYSE is the largest stock exchange in the world. Dating back to 1972 and with over 1,900 companies listed, it’s no surprise that it’s a hallmark in the world of investing. For a company to be listed in the NYSE, it must have at least 400 shareholders each owning more than 100 shares of stock, at least $1.1M shares of publicly traded stock, a market value of at least $40M, and it’s Initial Public Listing (IPO) must have a market value of at least $100M. Additionally, it must meet basic earning standards, which is either a pre-tax income of $10M or $200M in global market capitalization. As the exchange also houses international companies, these companies must meet the additional standards of having at least 2.5M shares outstanding and 5,000 public shareholders. With that long and exhaustive list of requirements, the quality of every company is assured. Another benefit of the NYSE is its global diversification, with stock listings from around the globe, including countries like Canada, China, and the UK.
To track the performance of its stocks, the exchange uses the NYSE Composite Index. It measures all stocks that are exclusively listed on the NYSE. The weights of the index are calculated based on the company’s market capitalization – the total market value of its stocks – while the index itself is calculated on the basis of price return and total return. The NYSE Composite Index is maintained by the S&P Dow Jones Indexes, a resource that tracks many other indexes and data regarding financial markets.
NASDAQ
Short for National Association of Securities Dealers Automated Quotations, it is the second-largest stock exchange after the NYSE in the world. It’s known for being dominated by technology giants such as Apple, Microsoft, IBM, and Facebook. However, the NASDAQ also lists a number of other influential companies in the fields of finance, energy, transportation, and healthcare. It’s listing requirements include having a shareholder’s equity of at least $2M, at least 100,000 public shares, a minimum of 300 shareholders, total assets worth $4M, a minimum of $3 per stock price, and public market value of at least $1M. As with the NYSE, this exhaustive list of requirements ensures the utmost quality of each company listed.
The NASDAQ-100 is the index used to track its stocks. Unlike the NYSE Composite Index, it tracks the price movement of only the top 100 largest stocks listed in NASDAQ. Additionally, it does not include financial institutions listed. It utilizes a weighting system to calculate the index, which limits the influence of large firms’ indexes by taking into account overbearing market capitalizations. This allows for a more accurate representation of the exchange. The index price is also calculated during pre and post-market hours, with market hours being from 9:30 AM – 4:00 PM (EST).
Dow Jones Industrial Average (DJIA)
The DJIA is an index in itself which is not tied to any specific stock exchange. It differs from the NYSE Composite Index and NASDAQ-100 because it is composed of 30 major companies that are leaders in their industry regardless of the exchange they are listed on. This index is run by the Wall Street Journal, whose editors make decisions about what companies make the cut. The DJIA only includes US-based companies that are traded either on the NYSE or NASDAQ. The purpose of the DJIA is to give an accurate and succinct overarching view of the US market – no trading goes through it, as trading only goes through the NYSE or NASDAQ. This index is widely viewed as the top representation of how the market is doing, with many top news channels and platforms displaying its calculations on a daily basis.
Standard & Poor’s 500 Index (S&P 500)
The Standard & Poor’s 500 Index, or commonly referred to as the S&P 500, is an index based on the market capitalization of the 500 largest publicly-traded companies in the US. This index is known to be the best basis or gauge of large-cap US equities. Investors use this as the benchmark for the overall market.
Why should I know all this?
If you’ve got this far thinking, “Well, this is all great to know, but how will this help me in my investing journey at all?” then that is totally understandable. Knowing what the stock exchanges are and the indexes that calculate their value may not seem that important, but having a good grasp of all this will also help you make wiser decisions when it comes to your investing practices. It’s much better when you are able to identify and understand the terminology used when referring to the different stock exchanges and their indexes, as well as the all-important difference between the DJIA and other stock indexes. This information is important as a first stepping stone into the US markets, with more exploration and discovery to come once you truly partake in the markets, because, as the saying goes, “Experience is the best teacher.”
The Going Global series aims to introduce traders, whether beginners or advanced, to the international stock markets. Throughout this series, we will explore the pros and cons of international investing, how to kickstart your international portfolio, and many more tips to navigate this more complex trading world.
So you’ve been trading in the Philippine market for a while now, and feel like it’s time to start diversifying your trade portfolio.
You think to start trading in international markets — it’s a good opportunity, and it doesn’t seem too difficult!
However, the more you think about it, the more you realize how little you know about how it works — what exchanges should you be looking at? What are the most stable? How do I start trading? With all these questions swirling in your mind, it’s easy to get daunted and never really begin your venture into international markets. You realize that you may need a little guidance when it comes to entering those markets — well, look no further! This article takes you into the world of international trading, and watch out for more from the Going Global series to fully understand these foreign markets.
Get ready to kickstart your journey and start taking your stocks globally.
International Stock Exchanges
Almost every developed country has its own stock exchange: the Philippines has the PSE, China the Shanghai Stock Exchange, and many more. Each stock exchange is composed of companies that are locally listed and traded on the exchange. Among the most prominent stock exchanges in the world are the New York Stock Exchange, the NASDAQ, Tokyo Stock Exchange, and London Stock Exchange. Let’s take a closer look at each below:
1. New York Stock Exchange
The NYSE is the largest exchange in terms of total market capitalization. It dates back to 1972, and most of the largest American companies are listed here. It used the NYSE Composite Index to monitor stock activity. Additionally, foreign-owned companies may also list their shares on the NYSE, as long as they adhere to some specified listing standards.
2. NASDAQ
Short for National Association of Securities Dealers Automated Quotations, NASDAQ is the exchange for many electronic companies such as Apple, Microsoft, and Amazon. It is headquartered in New York City and was the first stock market in the United States to trade online in 1971.
3. Tokyo Stock Exchange
The Tokyo Stock Exchange is the most prominent of Japan’s five stock exchanges. It uses the Nikkei 225 Stock Average, a price-weighted index composed of Japan’s top 225 blue-chip companies. These companies are selected by the Nihon Keizai Shimbun, Japan’s leading business newspaper.
4. London Stock Exchange
The London Stock Exchange was founded in 1801. It utilizes the Financial Times Stock Exchange 100 Index, nicknamed the “Footsie”, which lists the top 100 companies in the London Stock Exchange with the highest market capitalization.
Why should I invest internationally?
Individuals usually invest internationally for two main reasons — to diversify their investment portfolio and take advantage of the growth of other countries. It is often wise to spread the risk of one’s investments across many companies and markets, as to not be overly reliant on the market conditions of just one area. As such, by diversifying one’s portfolio, one will be able to mitigate risks posed by economic, political, and social events of a country. Additionally, buying stocks in another country is a great way to take advantage of the growth they are experiencing. If a specific country is seeing great growth, investing in companies listed there will allow one to partake in their advancements.
However, there are also some risks that come with investing in foreign markets. Firstly, in order to invest internationally, you must work with a registered broker, as compared to being able to do so on your own in Philippine markets. This incurs additional costs, as you will have to pay commission fees. The fluctuating currency rates may also affect your investment positively or negatively, depending on whether the rate is going up or down. The currency rate will directly affect how much profit you are able to gain from your investment, which can go both ways. Lastly, there is the risk of having an inadequate understanding of political, economic, and social conditions in the country you are investing in, which will affect stock prices. Being hundreds or thousands of miles away from where you are investing your money makes it difficult to have a firm understanding of its market conditions, possibly leading to less informed decisions regarding your investments.
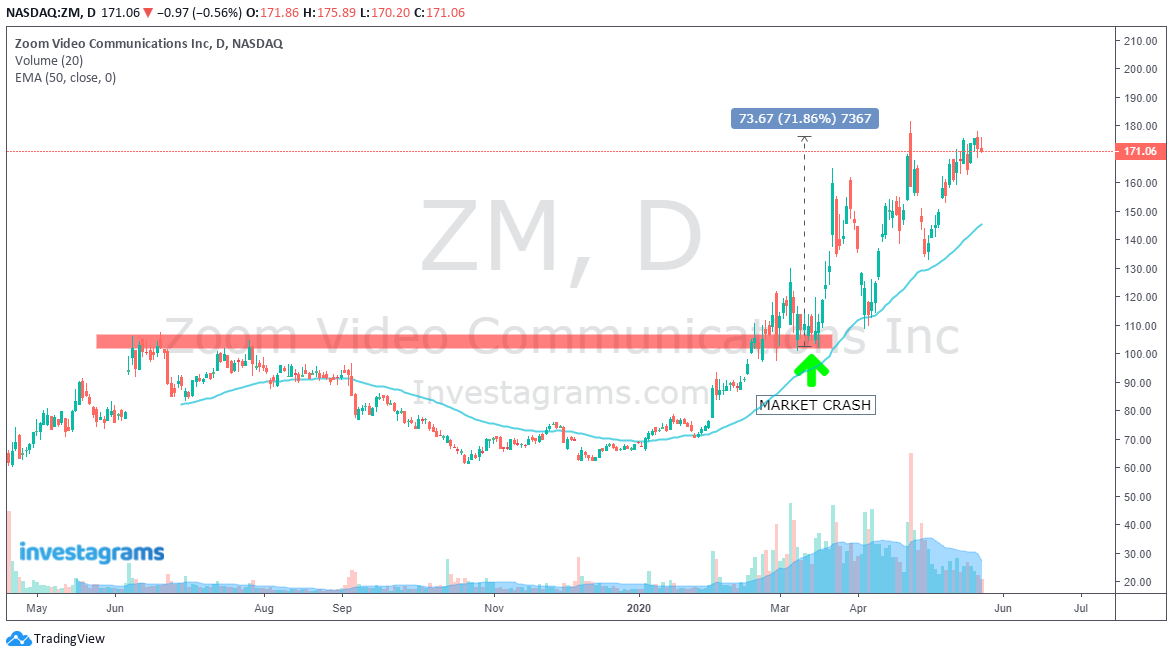
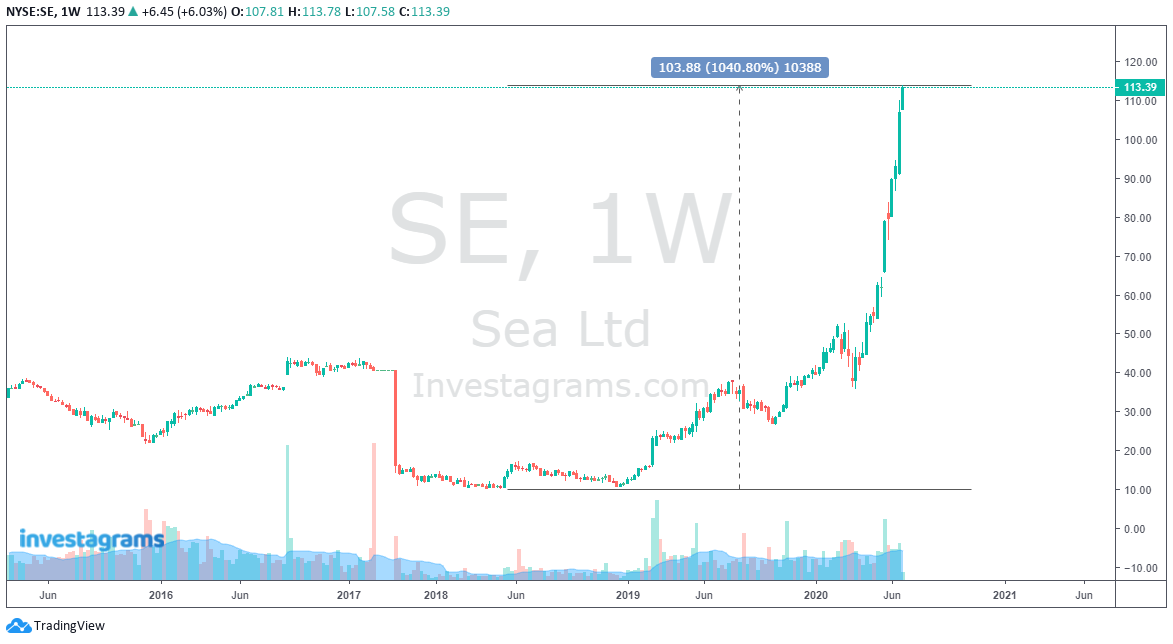
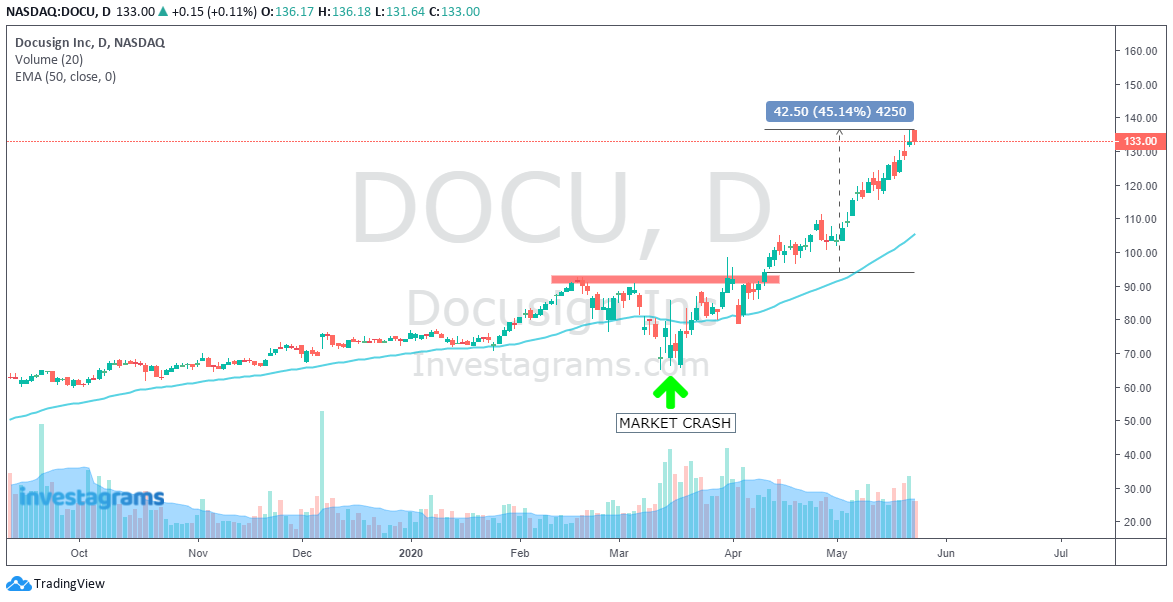
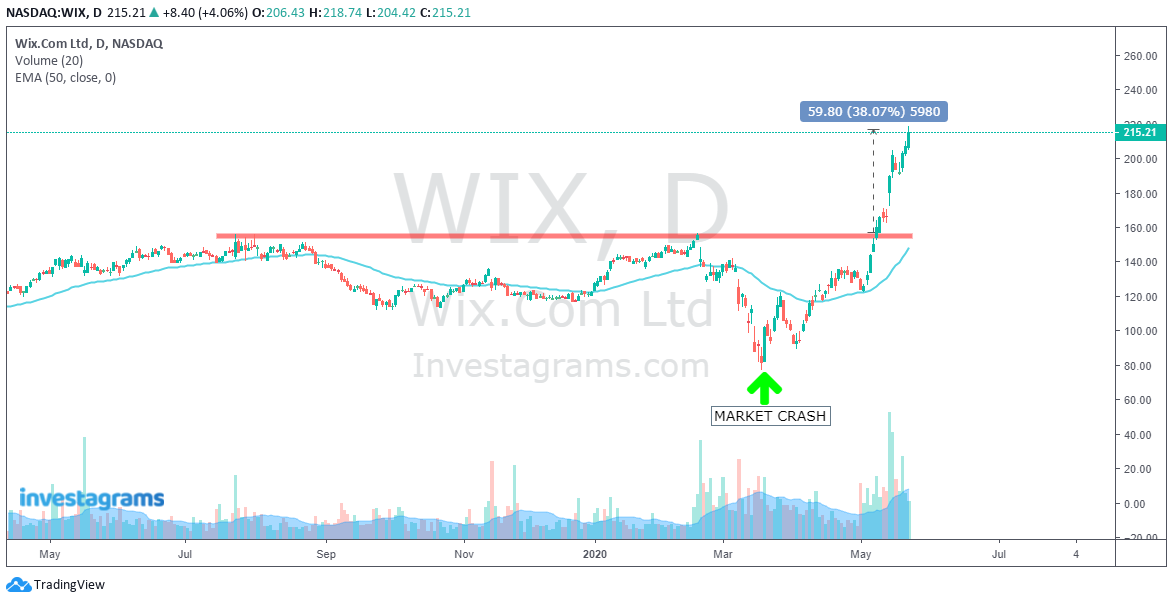
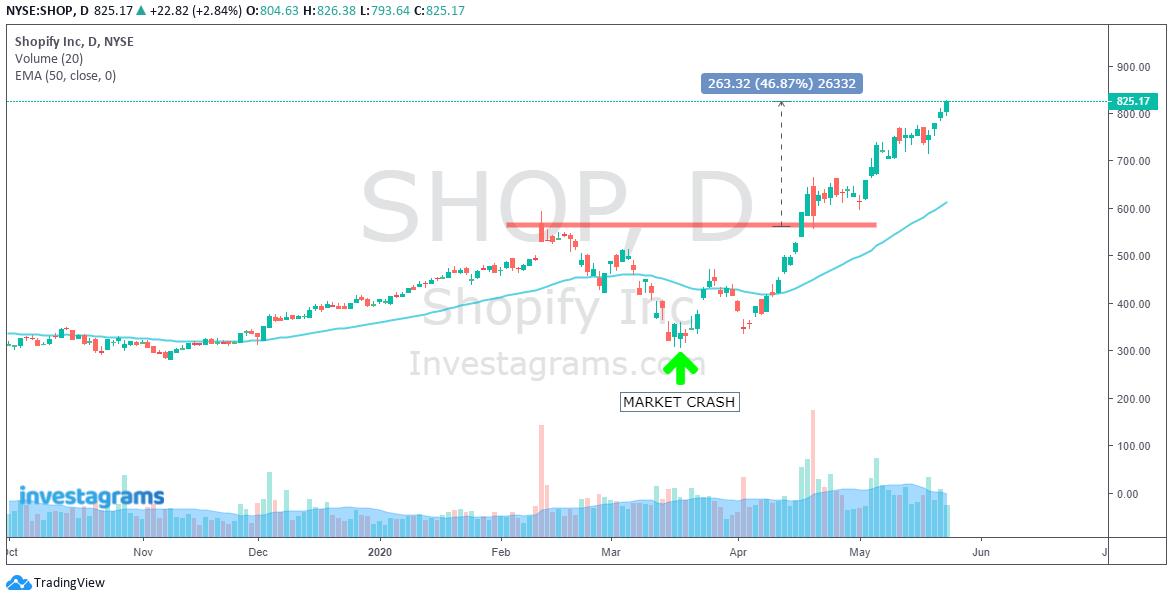
US Stocks vs Philippines Stocks since the market crashed
Just to show the difference between the US stock market and the Philippine stock market after the market crash we’ll be showing you guys the vast difference of opportunities on both markets. After the initial recovery, there were a few weeks where some stocks in the Philippines showed strong reversals like $MAXS, $IDC, $MAH, $JFC, $URC, $AC, $MRSGI, $PGOLD, and the like. However, only a few names went on to go up 30% or more. The stocks that made a strong move after the low at 4,000 levels are probably only a handful, and very rarely does everyone have the opportunity to capitalize on them.
However, while all the Philippine market had been reversals, the US stock market had hundreds of stocks close to making a new 52wk high and all-time high. A new breed of market leaders were already showing up in the global markets, while only a few stocks remained resilient and did not make news lows during the crash here in the Philippines; specifically, $GLO and $TEL.
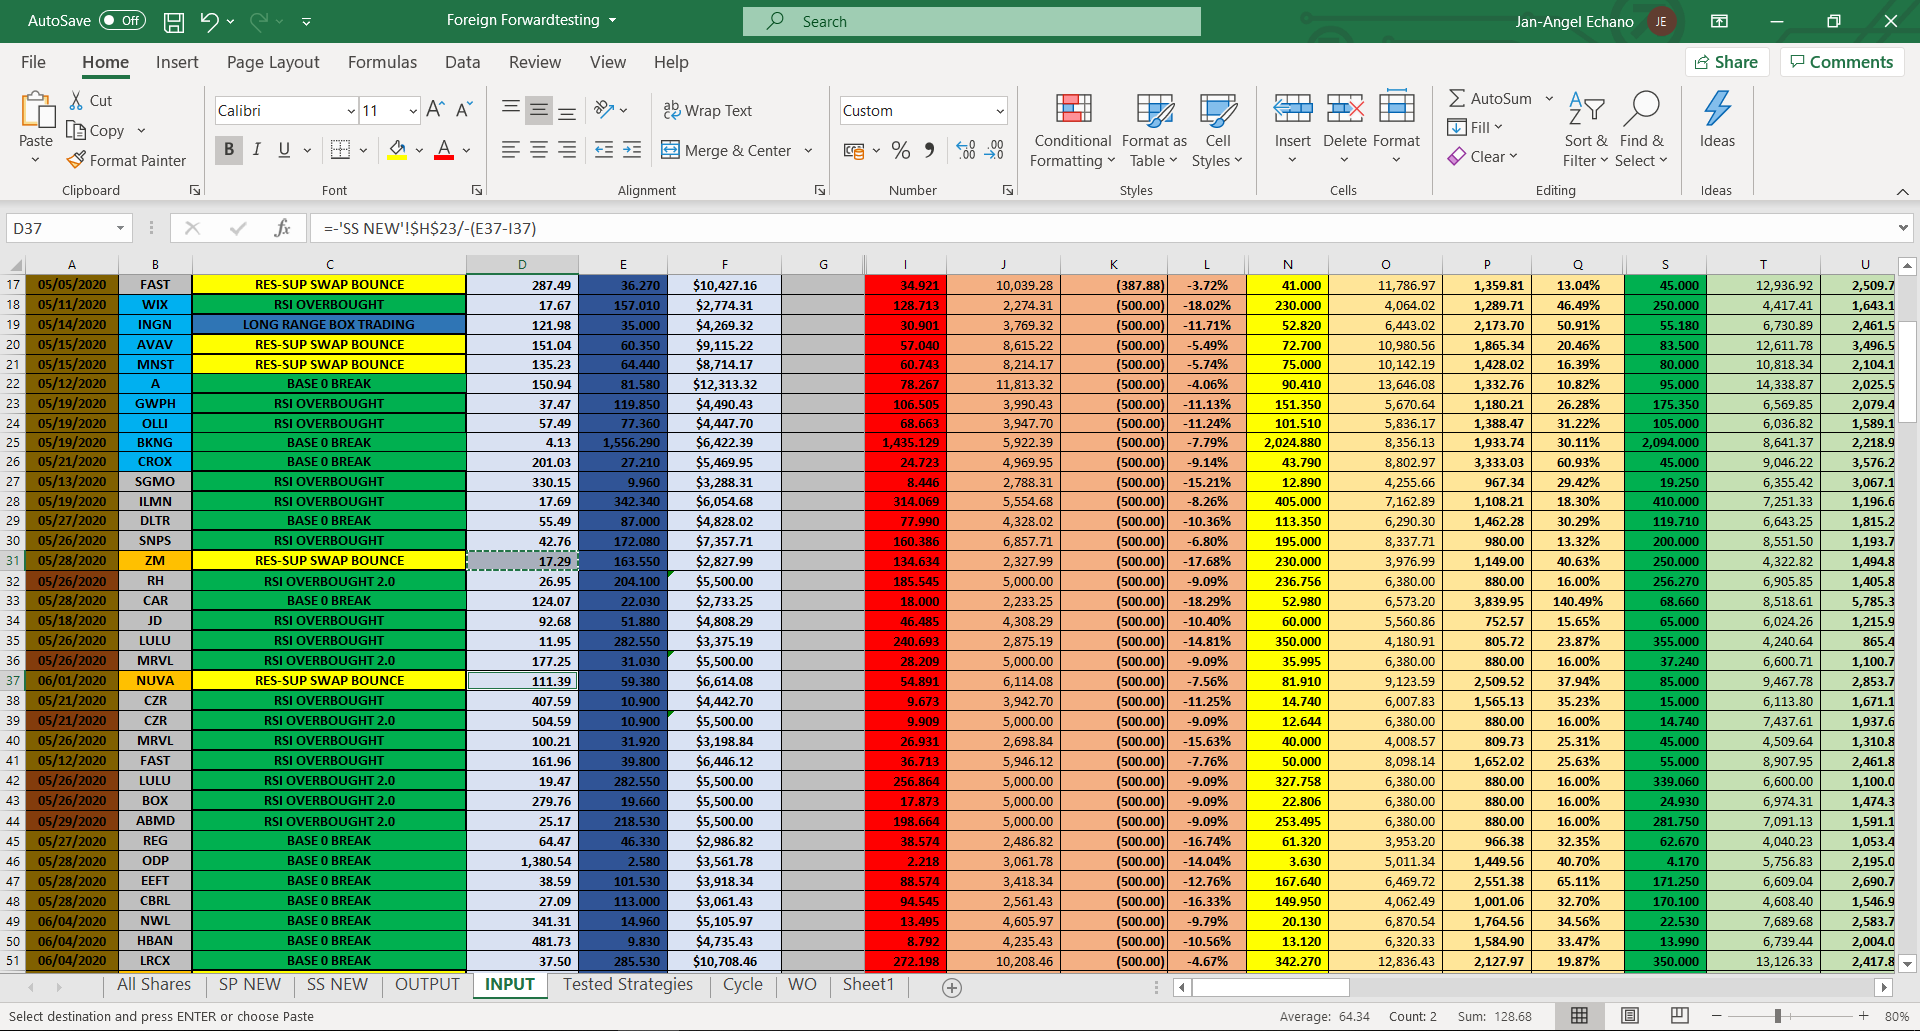
Stocks in the US like $ZM, $SE, $WIX, $DOCU, $SHOP, $SGEN, $PYPL, $OKTA, $NFLX, $MASI, and so much more went on to make new highs. Here’s a look at a few of their charts as of May 26, 2020.
Conclusion
With all this being said, investing in foreign markets is still a good and profitable way to diversify your portfolio. It is recommended that 5-10% of your portfolio be foreign investments, with the majority still being from locally-listed companies. Before venturing into the international markets, it is best to be well-informed of the benefits and risks of doing so and to start investing confidently in your knowledge of foreign markets and its implications to your investment portfolio.
Watch out for more from the #GoingGlobal series of articles to further enhance your understanding of investing in foreign markets!
The Going Global series aims to introduce traders, whether beginners or advanced, to the international stock markets. Throughout this series, we will explore the pros and cons of international investing, how to kickstart your international portfolio, and many more tips to navigate this more complex trading world.
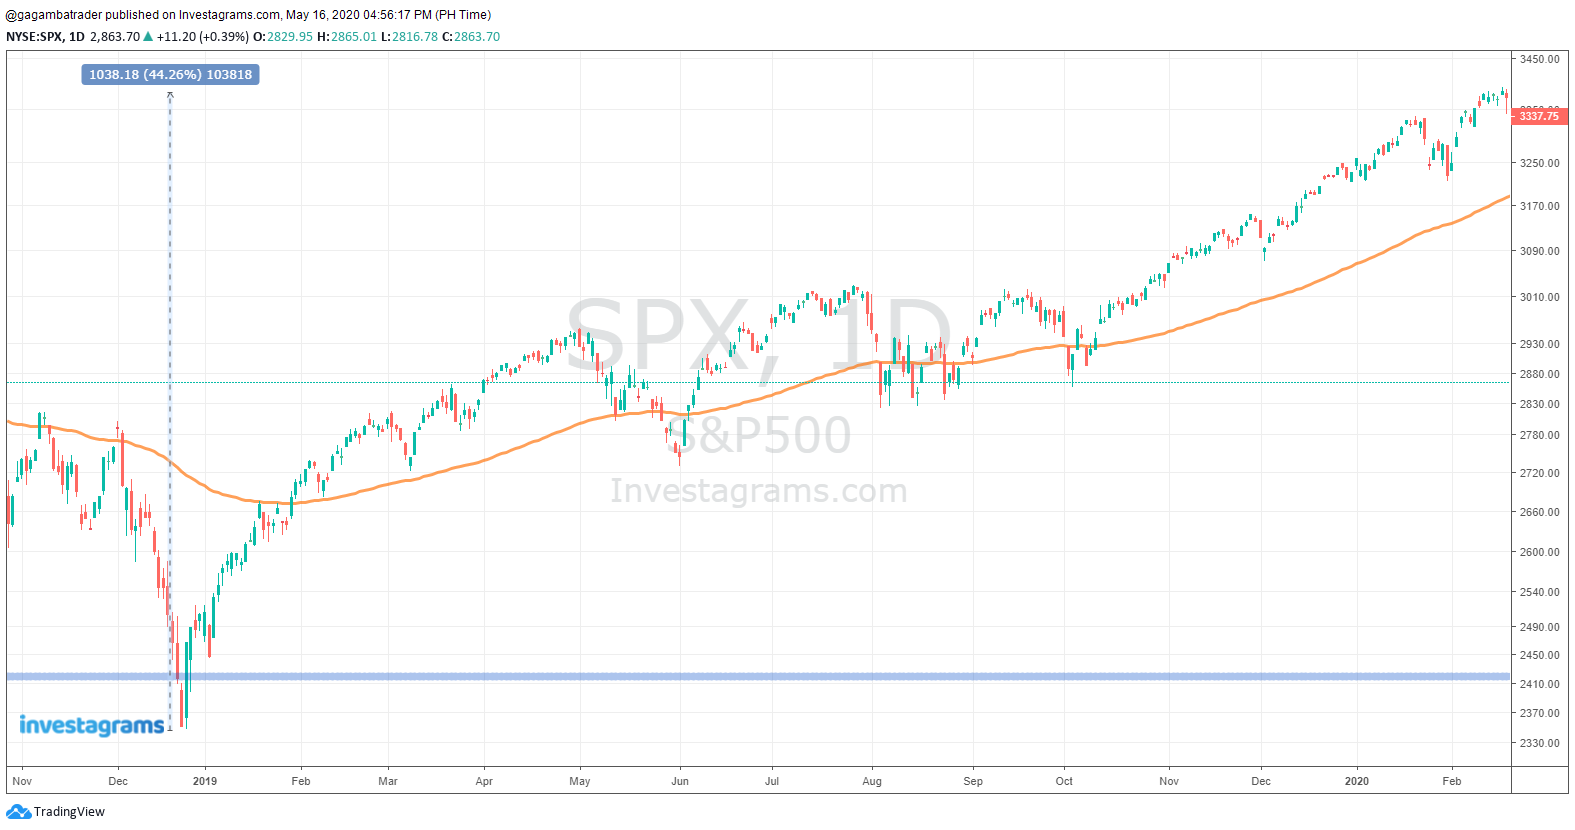
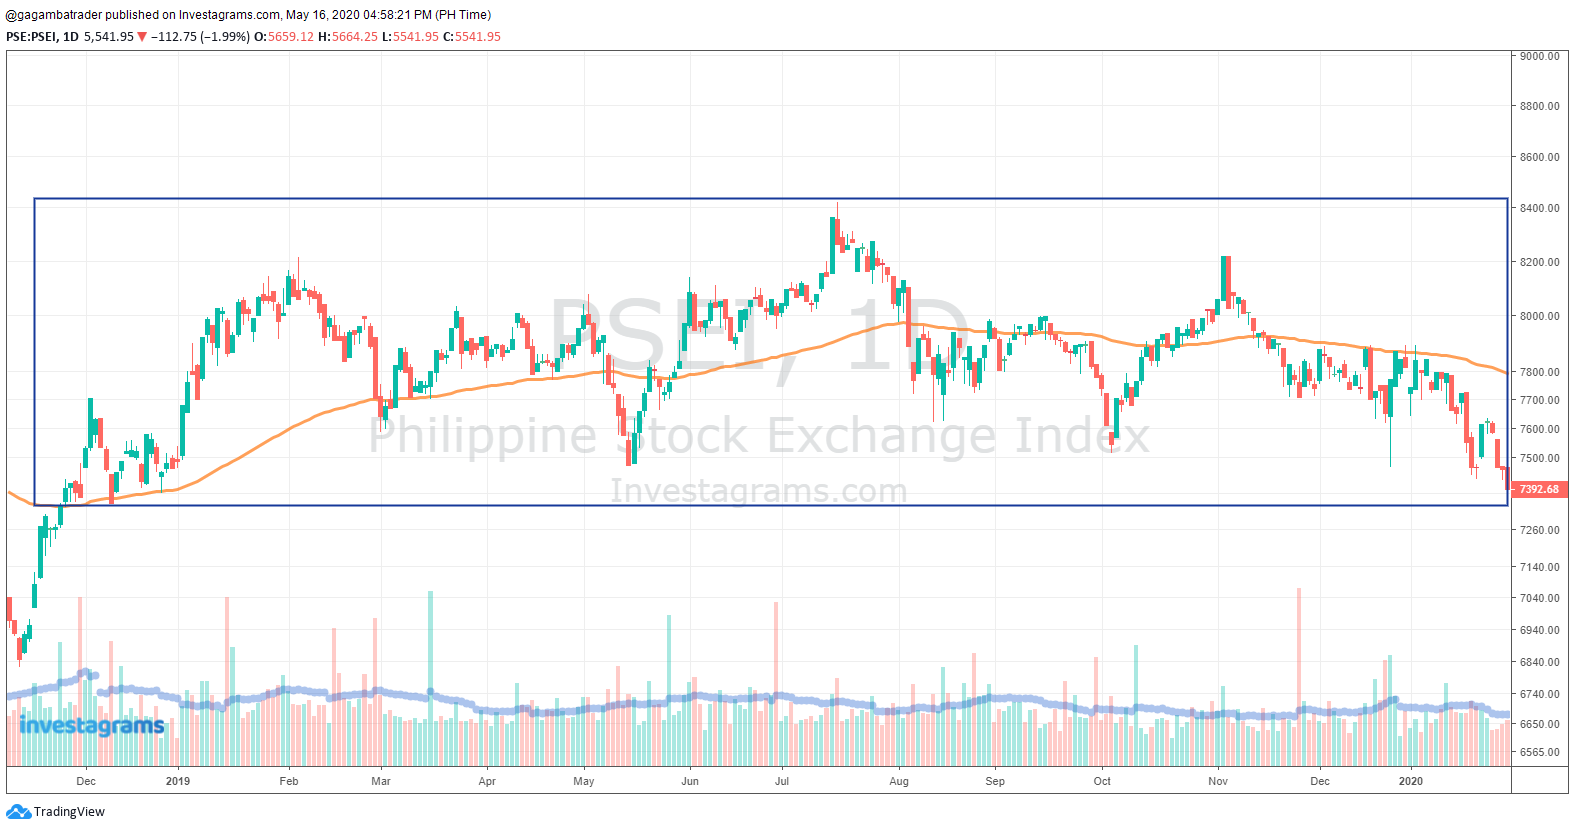
Trading both the Global Markets and the PSE is not an easy task. It will be difficult at first, but you will get a hang of it. As traders, it is our mission to look for strength and uptrends outside our local market, once the opportunities, based on your grade A setup, run out in the PSE.
Referring to the figures above, while the SPX was trending from 2019 to early 2020, PSEi was in a sideways movement. Certainly, I advocate the Bottom-Up Approach which I first learned from Mark Minervini in his book “Trade Like a Stock Market Wizard”, which simply means that a trader would focus on individual stocks first. Although, the opportunities in the US Market were far superior to that of the opportunities that sprung out of the $PSEi in the same period.
Did you have a hard time trading the PSE during 2019? I will be honest with you all, I started trading the PSEi in early 2019, and I found it difficult to trade. Fakeouts and shakeouts happened quite often. Although, there were a few names that were still making new highs while the PSEI was moving sideways such as $WLCON, $CPM, $SLI, and $HOUSE. Although, given that the US Markets contain approximately 7000 stocks (in the case of NYSE and NASDAQ), hundreds of stocks were making new highs, in comparison with the PSE.
That is why it is important to follow the opportunity present across markets. If you were to succumb to the PSE, chances are that you found it difficult to trade. Back in 2019, I was not prepared to venture out of the local market because I thought of it as my comfort zone. I found it daunting to explore other markets. I thought that being in the PSE is enough to suffice my goals as a trader.
In my personal experience, trading the global markets while trading the PSE was not easy at first. There will be several factors that you need to assess before you commit to trade across markets.
Are you eager to put in more work to achieve your trading goals?
Can you trade from 9:30am to 1:00pm (adjusted market hours until further notice) in the PSE, and trade from 9:30pm to 4:00am (due to time zone difference) in the US Stock Market? Other than that, can you also trade in between those times (given that Forex and Commodities are 24/5, and Cryptocurrency is 24/7)?
This doesn’t mean that your eyes will be glued to your monitor 24/7. Before the market opens, one must PLAN THEIR TRADES so that you could set all your MARKET ORDERS.
I put orders in advance so that I do not get left behind when the potential trade goes in my favor. I do this especially on 24-hour markets such as the Forex, Commodities, and Cryptocurrencies.
Are you willing to come out of your comfort zone (the Local Market)?
Willingness to learn:
A New Platform.
How trading with leverage works.
How shorting works.
Accepting the risk involved in trading the Global Markets
The US Market is prone to gap ups or gap downs during earnings season.
Each asset class has a different DNA, wherein one may be more volatile than the other and driven by different fundamental factors.
The Global Markets will be a new environment that will require more effort in comparison to trading just the PSE. As Michael Jordan said, “You miss all the shots you don’t take.” It is such an overwhelming and eye-opening experience to trade across several markets. Indeed, continuous learning and building new experience is the key to navigate through our trading journey.
Contributor:
Full Name: Miguel Lorenzo L. Cagampan Investagrams Username:@Gagambatrader
Gagambatrader is a personal brand that aims to provide value and content with regards to trading in the financial markets using Technical Analysis. Gagambatrader aims to influence and provide to the growing community of traders in the country.
Subscribe to our Newsletter
Join our mailing list for investing tips and stock market advice to help you reach your first million.