Categories
Latest Posts News & Features

Featured Trader for the Week: Tardigrade Trader a.k.a. @tardigradetrader

For this week, we would like to congratulate our featured trader: Tardigrade Trader a.k.a. @tardigradetrader!

This trader was able to spot a sleeper. $ALLHC or AyalaLand Logistics Holdings Corp. was not talked about not until it broke out of its initial base supported with enormous volume. Tardigrade Trader a.k.a. @tardigradetrader is an active member of the Investagrams community who endlessly spreads his knowledge on Technical Analysis along with his complete thought process in each of his stock selection.

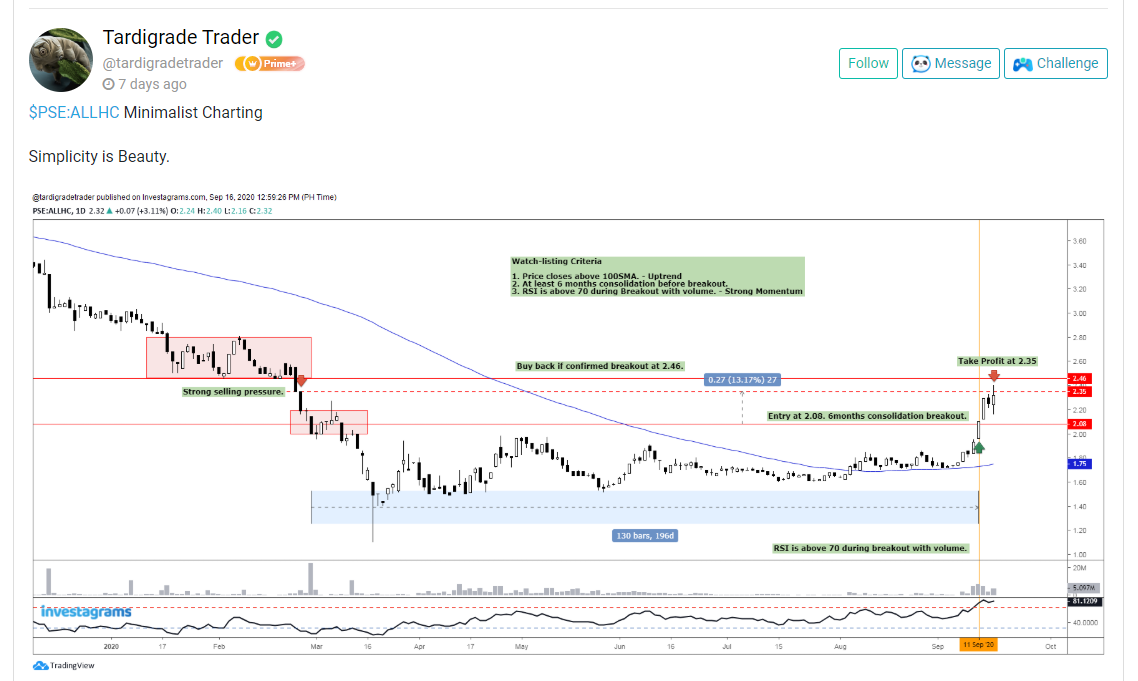
Along with his qualitative assessment about the said stock, he also exclaimed about how minimalism can be applied in trading as well. As mentioned in the previous posts regarding the featured traders, whether the strategy of a said market participant is basic or advanced, their performance will always depend on the end-user itself.

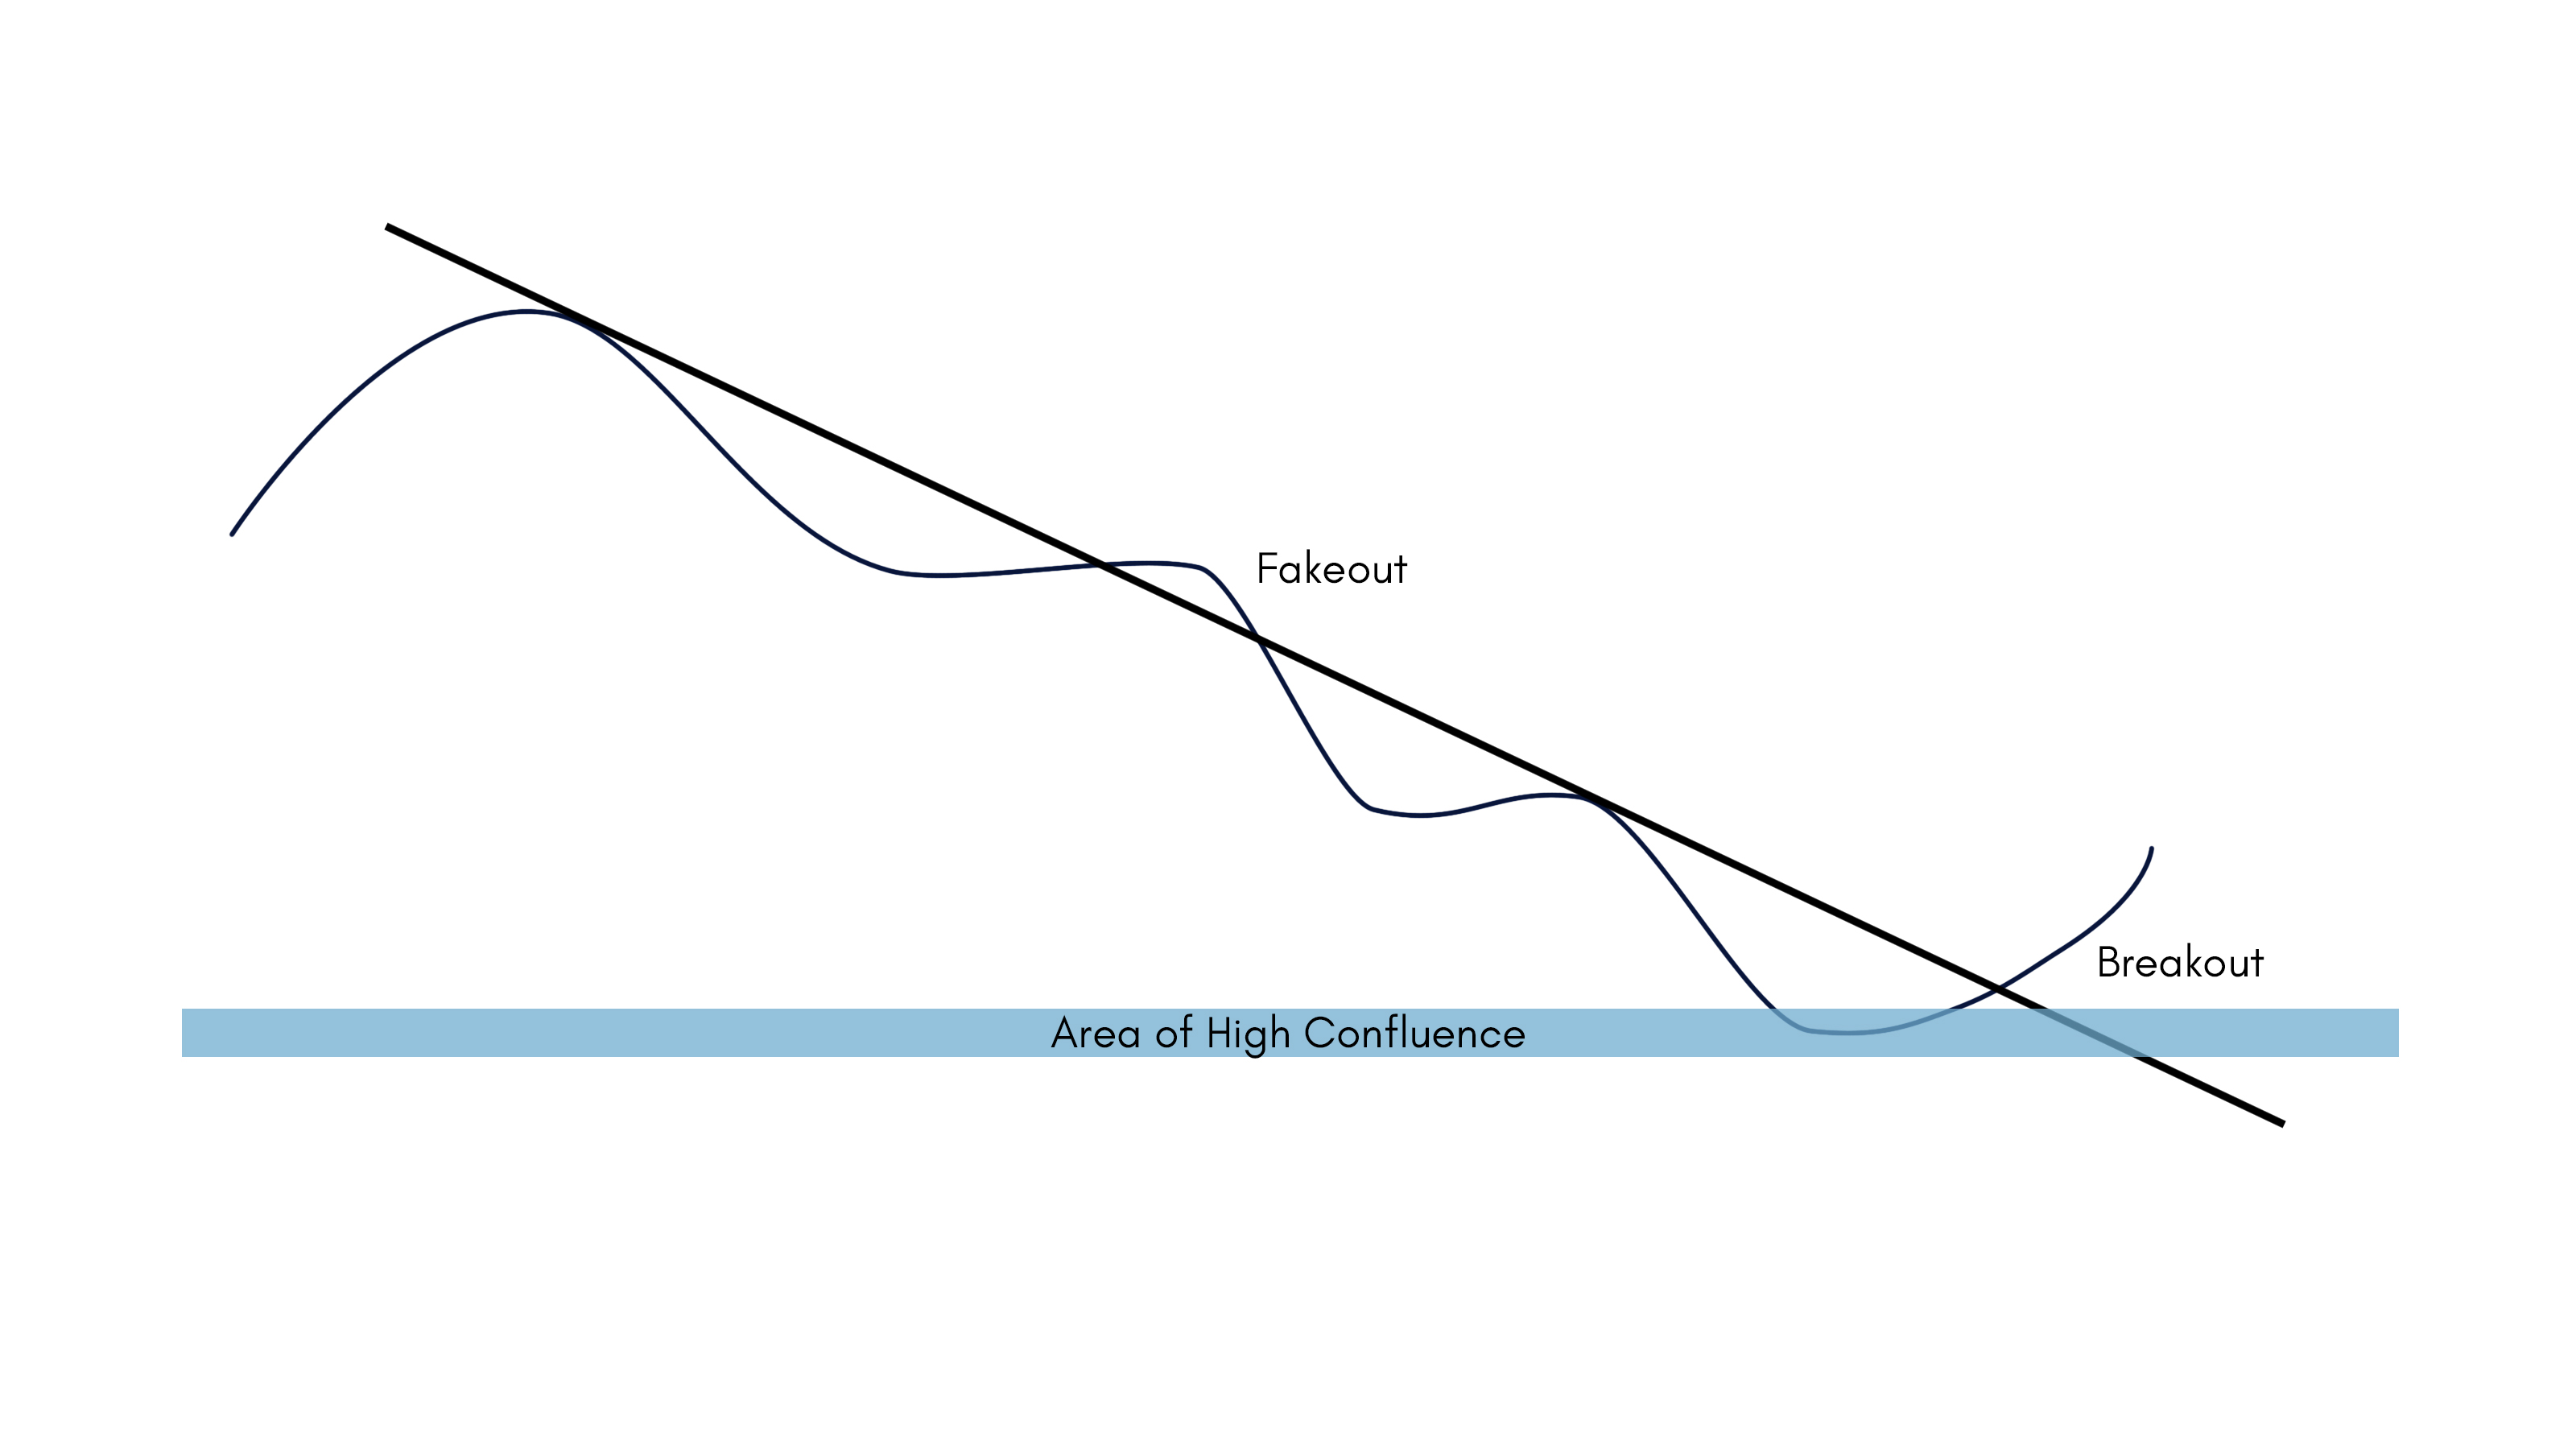
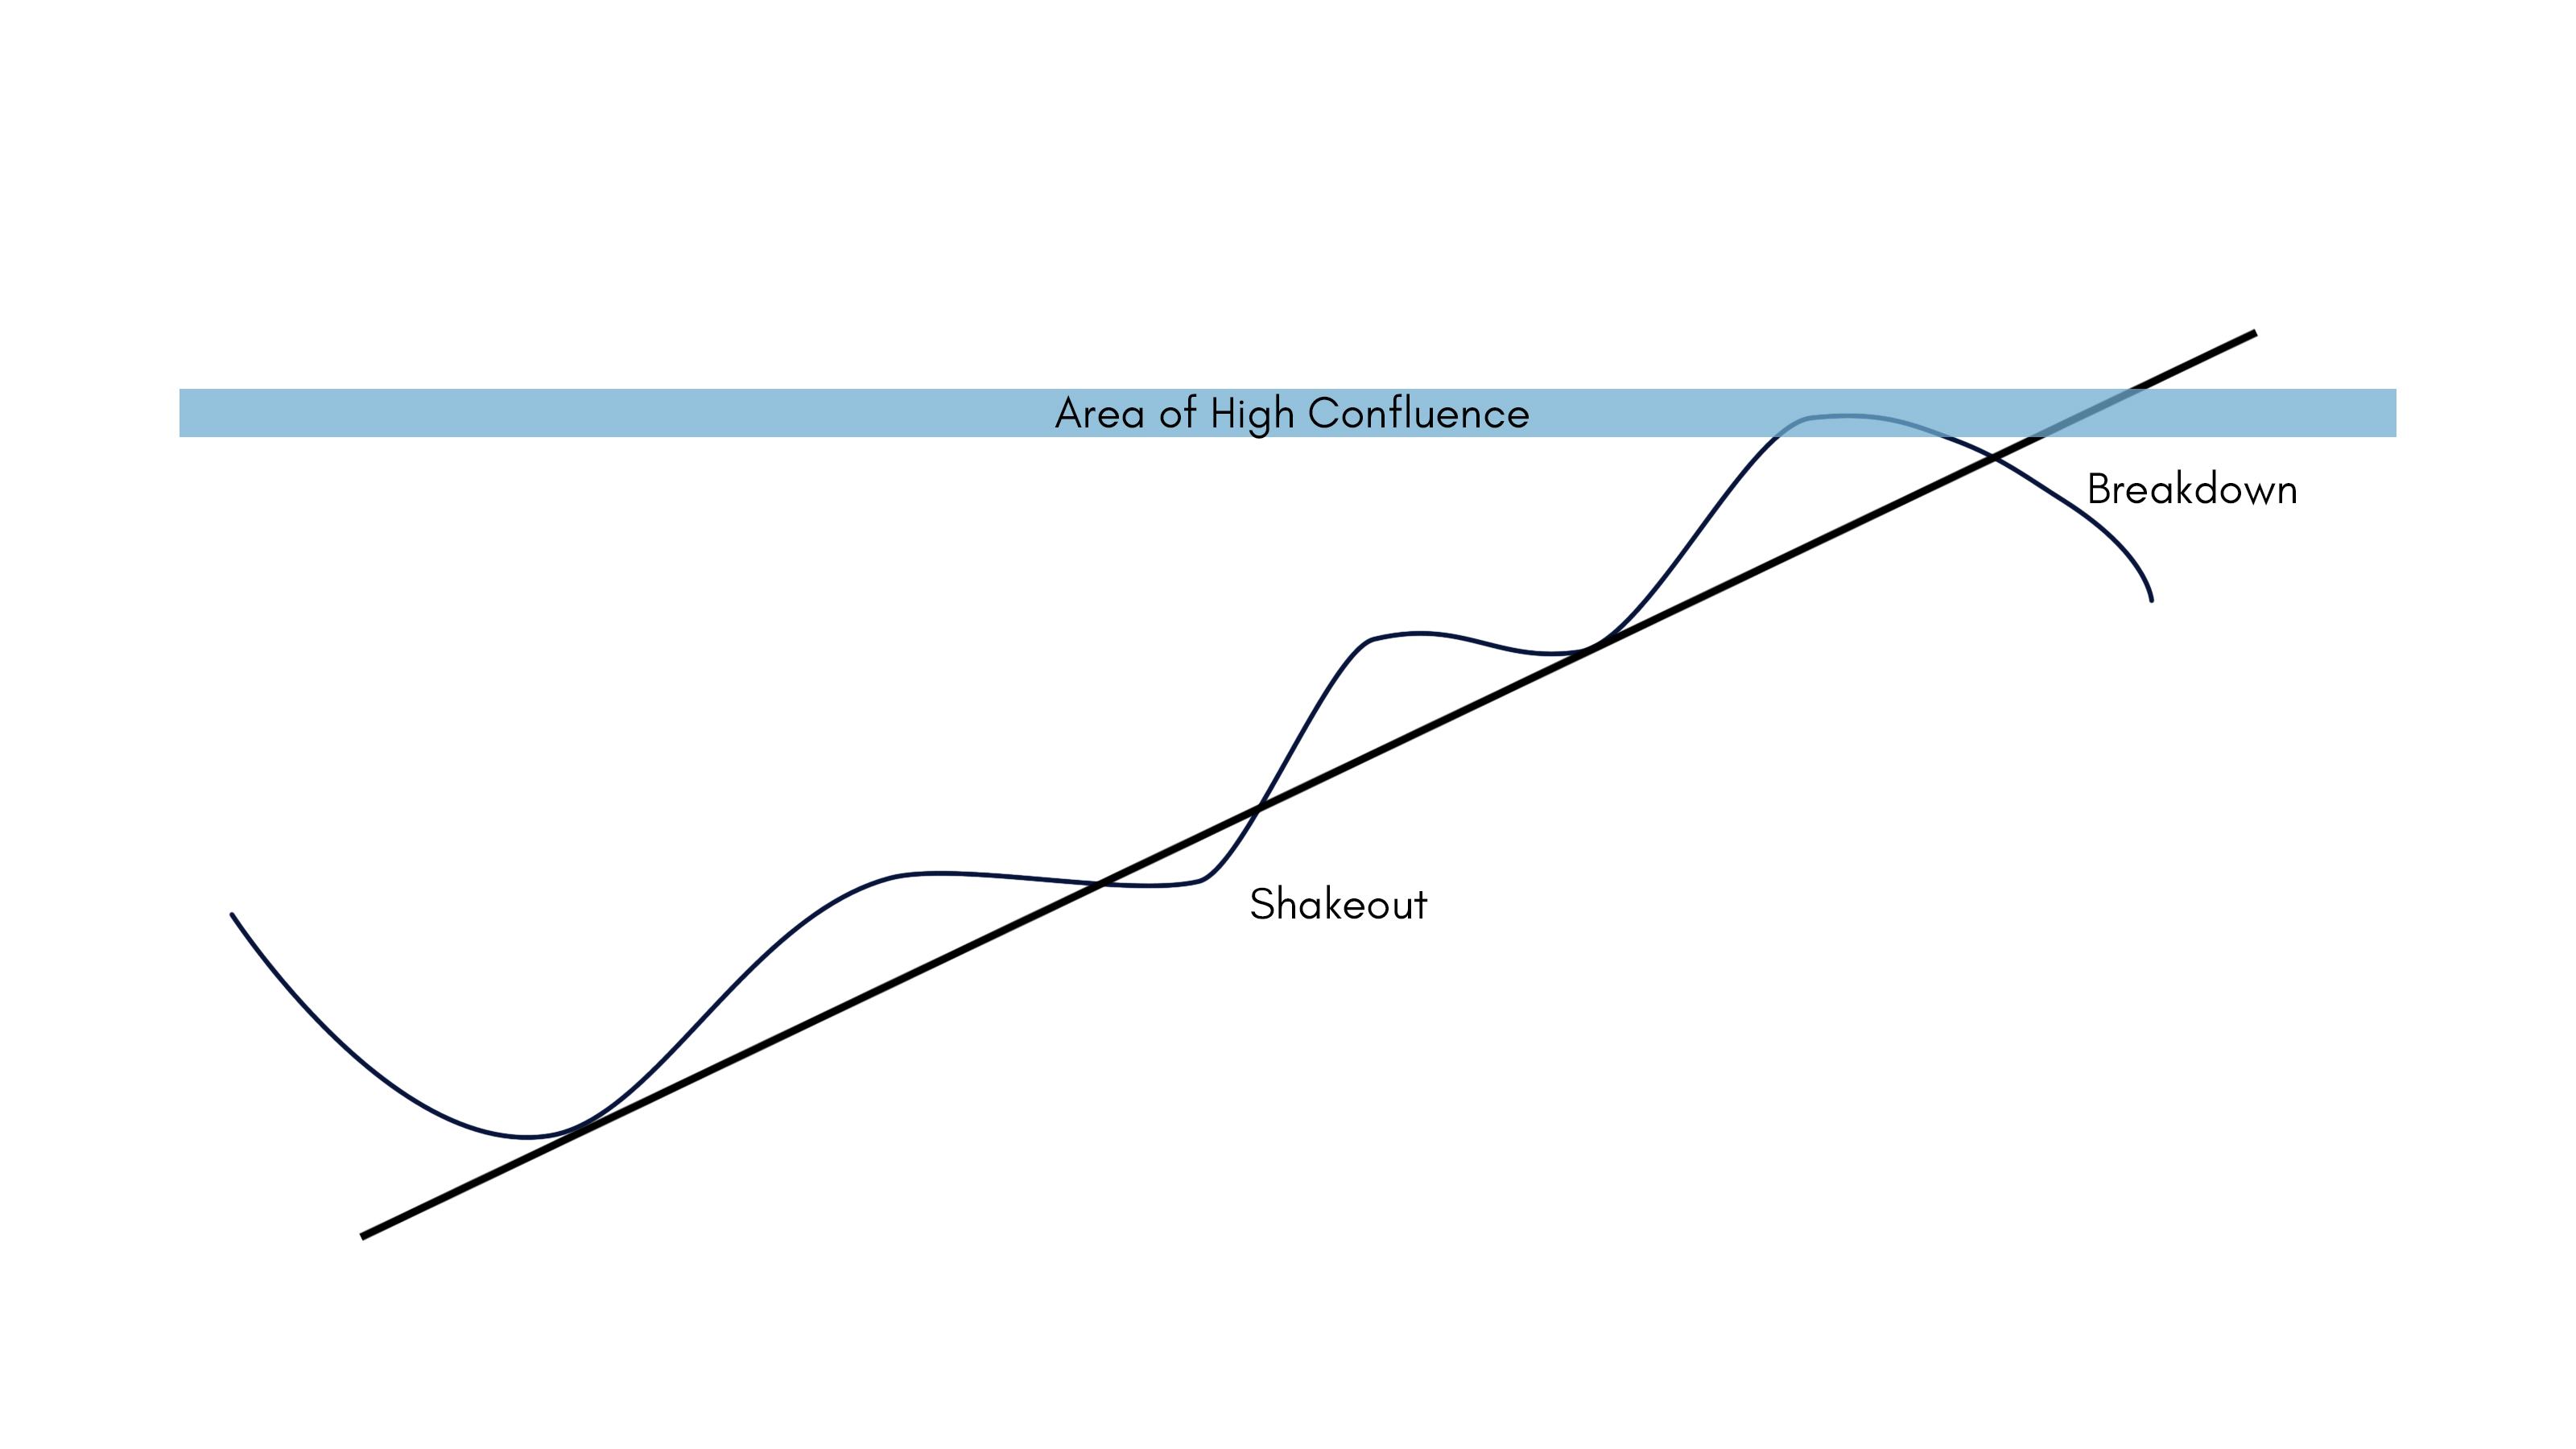
Tardigrade Trader highlighted the importance of an initial consolidation phase before a much-awaited breakout. Patience is the key to spot market leaders. There will be countless times that it will take several weeks or months for a trade to blossom. Moreover, he also added the significance of RSI (14) 70 breaches along with massive volume in the breakout of the pivot high, which further solidifies the said trend.

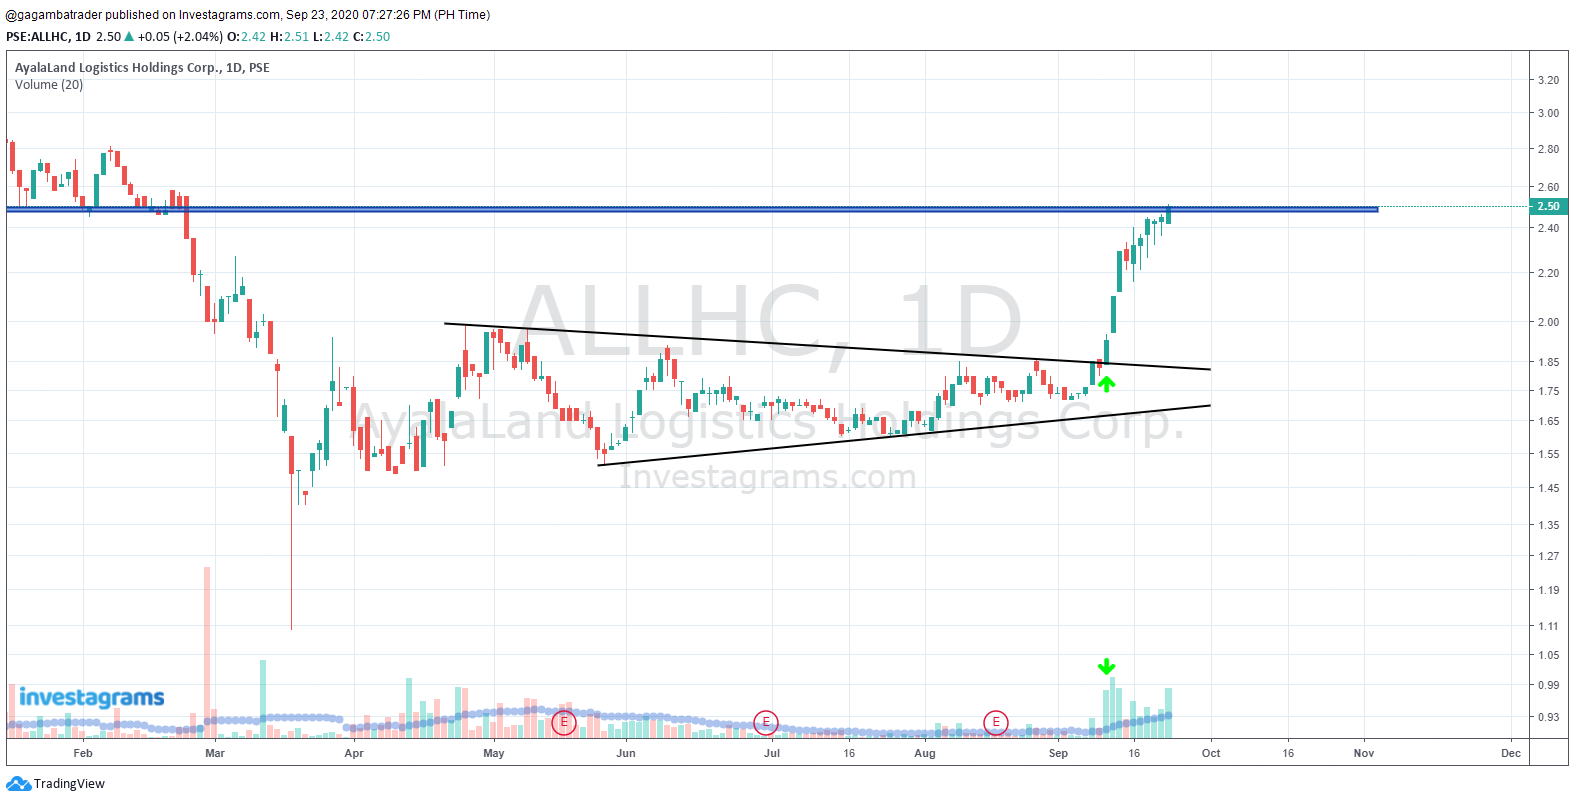
A breakout of the 1.9 to 2-peso area was an ideal buy point as it was the breakout of the initial base or the symmetrical triangle supported with increasing volume on its up move. It is a low-risk, high-reward trade, as the stop loss levels for the said breakout point could be below 1.8 (-4.5%) if you bought it on a symmetrical triangle pattern. On the other hand, the stop-loss levels for the said breakout point could be below 1.9 (-4.5%) if you bought above the 2-peso psychological resistance level. Take profit areas could be the structural resistance at 2.5 (24%-33%).

It is a must for this stock to hover and sustain above the 2.5 psychological levels to further signify its ascendency. If it does, we may see it consolidate from here. The next significant resistance level would be the 3-peso area being the next structural and psychological levels, along with the 3.8-peso levels being the 52wk high of the said name.

It is a non-negotiable for traders to wait for the right setup. A setup where you could spot names to emerge just like $ALLHC. Waiting for the right moment to click the buy or sell button when all your parameters are finally aligned with a particular name is the ultimate embodiment of professional trading.

Congratulations to those who were able to maximize the technical swing of $ALLHC. Lastly, kudos again to Tardigrade Trader a.k.a. @tardigradetrader for sharing his trade analysis. Your FREE 1 Month InvestaPRO access is on its way!


Click on the photo to join.
Categories
How to & Advice Latest Posts

Mastering The Trendline: A Guide to the Most Basic Charting Tool

If you are a technical trader, chances are, the trendline is one of the first charting tools that you have learned to use. Its elegance comes from its simplicity: just trace the line and either follow the trend or wait for a breakout. However, like supports and resistances, trendlines are prone to both fakeouts and shakeouts. If you find yourself a constant victim to these fakeouts and shakeouts, then maybe your trendline strategy is missing the most important component: confluence.

In the world of trading, confluence refers to the convergence of different trading strategies. An example would be a set of moving averages, structural supports, and fibonacci retracements all indicating the same critical level for a certain stock. This critical level is often referred to as an area of high confluence. The idea behind the importance of an area of high confluence banks on the fact that different traders use different trading strategies.

From time to time, a high number of traders will consider a price level critical in accordance with their strategy. Once the price reaches this level, there will be a surge in the number of buyers/sellers since a lot of traders consider the price as a critical level. In a nutshell, areas of high confluences often equate to higher probabilities.

Incorporating areas of high confluences with your trendline strategy is as easy as making sure that the price touched an area of high confluence before approaching a trendline. This removes the small errors from mistakes in drawing your trendline as well as irregular market behavior.

Essentially, the key takeaway is that trendline breakouts and breakdowns are invalid if the price did not come from an area of high confluence prior to the breakout/breakdown. This strategy goes well with both breakout trading and trend following since a breakdown from the trendline without a bounce from an area of high confluence is probably a shakeout and not a trend reversal.

Fakeout vs Breakout
Shakeout vs Breakdown

Areas of High Confluence can be composed of (but not limited to) any of the following:

  1. Chart patterns
  2. Range support and resistance levels
  3. Moving Averages
  4. Bollinger Bands
  5. Ichimoku Clouds
  6. Fibonacci Retracement Levels

It is important to note that for your trendline strategy to be effective, you should not only consider areas of high confluences but also the plotting of the trendline itself. The price should touch the trendline at least two times, the more touches, the better. Including the wicks depends entirely on your judgement as a trader as well as the “DNA” of the historical behaviour of the stock. With all this said, let’s head on to some examples.

$ALI [DAILY][2016]

In the photo above, there is a defined trendline on the daily chart of $ALI. We can see that the 40 price level is an area of high confluence because of the following factors: (1) it is a psychological resistance, (2) it is the high of the previous uptrend, (3) the price is already at the top of the Bollinger bands, (4) the RSI is near overbought levels.

Because the price bounced from an area of high confluence before breaking the trendline, there is a high probability that the price action is a breakdown and not just a shakeout. As we can see through what happens next, the move is in fact a breakdown of the trendline. 

$SMPH [WEEKLY][2016-2018]
In the case of $SMPH, the 40 price level serves as a psychological resistance which the stock tried to break prior to the breakdown from the trendline. Aside from a trendline break, we can see that the chart actually looks like a normal bearish RSI divergence. This validates our initial hypothesis that the move is a breakdown and not a shakeout. Aside from this we can see that the MACD is showing bearish signs with the histogram expanding below zero. 

This trendline strategy shows us that although we should develop a trading system that is tailored to our specific needs, we should also be familiar with tools and indicators outside of our system. This helps us widen our understanding of where the market might be headed since we are not only tapping into one strategy, but to multiple ones at the same time.

The stock market is basically a psychological battle between traders of different niches after all. Normal trading rules (take profit, position sizing, and stop loss) still apply. All of these strategies will help you trade the confluence and hopefully take you one step closer to financial freedom.


Take your trading to the next level.

Join the INVESTACUP 2020 and get a chance to WIN OVER HALF A MILLION WORTH OF CASH PRIZES!

Categories
How to & Advice Latest Posts

InvesTHINK! Who are you?

Never just invest, but invest with a clear mind, invesTHINK!

A good and great trader and investor must refrain from having a prejudice or biased preference. Lots of mistakes can also be rooted from a common mistake, which is then again, having a fallacious and biased concept about the stock market. Exhibiting and executing decisions based on emotions, peer influences, or your confidence towards the market, may happen at times. However, it is a sign of poor financial literacy towards the stock market.

What are your signals and indicators when you begin to enter and exit from the stock market? Were you just hyped among your peers? Have you monitored and checked the 20-day moving average and 50-day average? Here are the common biases you might encounter while creating decisions and analyzing your stocks. Who are you among these?

The Hyped: Social proof 

One of the most common biases and errors occur are due to being hyped with the decision of peers and trends in the community. People tend to be under peer pressure and follow the idea of the majority. Which on the latter, we deem it to be true. Now, the wrong thing about this is that we overlook on the importance and essence of doing our own analysis. It’s just like eating the same flavor of ice cream with your barkada, not knowing that it contains peanuts, which you are allergic too! Do you now realize the danger?

The Follower: Confirmation bias and Groupthink

Ano gagawin mo? Bibilhin mo na ba ngayon?

Down market diba, mag-aaverage down ka na ba ng stock mo?”
This type of thinking shows a flaw, a misconception. Now following and agreeing turns out to be a bias if you try to prove and justify your decision based on the actions of someone else. You try to seek out the support and the same thinking among your peers. 

Now with groupthink, just because everyone else says that “babagsak na yan, benta mo na” does not always mean they are right. Once you set foot in this bias, you lose the discipline and creativity of solving your own problems.

The Madame Auring, Manghuhula: Hindsight bias

Regrets and disappointments run fast, once you begin to suffer. Some investors and traders try to predict the movement, value, and the future of the stock based on their indicators. “All time low siya noong 2020, 10 pesos na lang siya. Ngayon 11 pesos na lang, bilhin ko na ulit!” The misleading factor on this is that, you tend to look for a similar cause that would make you react whenever the market crashes. You try to create your own predictions and make poor decisions whenever a certain event have occurred. To avoid this, always examine, record, and journal your outcomes.

The Blind: Clustering Illusion

In order to analyze charts, we use several indicators such as candlestick patterns, moving averages, RSI, volumes, and support and resistance. It is also necessary to check on the historical performance of the stock, may it be a daily, weekly, monthly, or yearly basis. However, clustering illusion happens when people tend to become oversensitive and seeing patterns where actually none have existed. Is it possible? Yes. If a trader or investor sees that the market structure repetitively illustrates higher highs, higher lows, higher highs, higher lows, the investor or trader may think that the market is going uptrend. It may seem like it, but always be cautious on the movement. Never create assumptions based on seeking certainty on your own perception.

Conclusion

Always be grounded with a strong foundation of principles and rules, in dealing with the stock market. Decision making will always be difficult, and that should be recognized. However, to be able to create a sound decision takes a lot of learning and re-learning. Always have a discipline in your study routines. And one day, you will achieve success too.


Are you up to the challenge of becoming the Champion of the Biggest Trading Competition in the Philippines? JOIN THE INVESTA TRADING CUP 2020: BOUNCE BACK CHALLENGE.

Click the photo to join.


Categories
How to & Advice Latest Posts

TEST YOUR LIMITS: Discover How Competitions Can Give You an Edge

With the increasing number of competitions available to the public, newbie traders might be wondering whether or not joining a competition may offer significant advantages as opposed to sticking to virtual trade. With Investagrams, the platforms for virtual trade and competitions offer similar features. They both offer a way to trade with virtual cash while using real time data which simulates real time scenarios without the risk of losing capital. Obviously, competitions give you the chance to win prizes. But the advantages of joining competitions extend beyond monetary value. 

Thinking Long Term

The advantages you can get from joining competitions mostly revolve around your discipline as a trader. When joining a competition, you are encouraged to look beyond short term gains and onto sustainable growth. This forces you to protect your capital through proper position sizing and appropriate exits. Although you can do this through virtual trade, it is very easy to just reset your account or to lose interest in your virtual trade portfolio if you get a losing streak. It is important to note that competitions are marathons, not sprints because local competitions usually last for around 4 months. This means that no matter how much gains you get with one trade, if you can’t sustain this growth then you’ll most probably get overtaken by your competitors. 

Beating the Market

Competitions also encourage you to push yourself beyond merely being profitable to actually being more profitable than the rest of the market. Of course, there are ways to do this through virtual trading such as setting a monthly goal or using the index to track your performance. However, these goals are not as dynamic as directly comparing yourself to similar traders at the same level. Having the ability to compare your performance to other traders in real time will have you constantly searching for high probability trades instead of passively riding on trending stocks. 

Being Part of a Community

Aside from prizes and technical benefits, you also get a better sense of community. For example, Investagrams’ group feature offers a way for Trading Cup 2020 participants to share their learnings and insights throughout the whole competition. Because competitions let people have the same initial capital as well as the same restrictions on the number of trades per day and lock in periods, all participants effectively start on the same level which makes it easier for participants to relate to each other. Ideally, this behaviour will spillover to the whole trading community even after the competitions end.   

Overall, joining a competition offers a good benchmark on whether or not your strategy is optimal. If you find yourself underperforming compared to your competitors, then you may want to realign your learnings and backtest your strategies in order to find the optimal system for you. However, if you find yourself performing better than others, then maybe you should think about transitioning to using a real portfolio with real cash or maybe even consider a career in professional fund managing. Joining a competition is truly a great opportunity that newbies and intermediate traders alike should not pass on. 


It’s time to challenge yourself.

JOIN THE BOUNCE BACK CHALLENGE, be hailed as the INVESTACUP 2020 CHAMPION, and get a chance to win awesome prizes — PRIZE POOL NOW PHP 500,000! 

Click on the photo to join.
Categories
How to & Advice Latest Posts

How Important is Reflecting on Your Trades?

“Successful traders know that a consistent and systematic review of their daily trading activities is the direct path to growing and improving” 

– Van K. Tharp

While looking at the movements of your charts, play the Reflection song by Lea Salonga and sing along with these lines: What is that trade I see? Staring straight, back at me. Why is the reflection something I don’t want?

Reflecting is not only done for the state of your mental health, to have a clear mind, or even to create better decisions. Reflecting must also be done when investing and trading to create sound and correct decisions. In order to do this, you must have a good, healthy, and peaceful environment. At the same time. It is very essential to have your thoughts and actions documents. Just like how you journalize the things you do every day; you must also journalize your investments and trades! 

For investors and traders, journalizing helps develop a more efficient and effective strategy in dealing with the market. With journalizing, you can see your mistakes clearly and what were the principles and rules that you have went against. At the same time, you can look at where you have excelled in! That’s the great thing about journalizing, it gives a peace of mind and determines the areas where you need to improve on. It instills the value of sticking with the rules and principles in beating the market.

One thing to know about journalizing your trades and investments is that it develops the discipline and habit of documenting every transaction that you have made —  from buying to selling, and even checking the chart movements.

Here are the things you should know when creating a journal for your trades.

Step 1: Determine what stock to purchase and what type of stock

It’s a must to know the stock you will be purchasing. But not only that, you must know what stock you will be purchasing. Is it a speculative stock? Defensive? Cyclical, blue chips, or tech stocks? This initial step already determines if you are a good trader. A good trader knows where he or she invests in. You can use either technical or fundamental analysis, or combination of the two. Remember, the organization of your trades starts on your discipline in analysis.

Step 2: Listing the quantity of shares bought

Do not rely on the information and journal given by your stock brokers. Record and list down the quantity of shares bought so you can be fully informed about your total investment. This will help you note if have already gained or made losses in your portfolio.

Step 3: The buy and sell point

This refers to the entry/exit point at which you decide on the price you would buy or sell your stock. To limit losses, you must note your target profit and stop loss. The benefit and essence of this step is to know the progress or status of your holdings.

Step 4: Type of time holding period

Determine on how long would you be holding the stock. Would it be for 3 weeks? For 2 months or 3 years? Decide whether you would be holding it on a short, medium, or for long term. 

Step 5: Trading Strategy

Trading strategies and holding period goes hand on hand. Journal whether you will be strategizing it with position trading, swing trading, day trading or scalping. Being informed with your strategies will help you on your decision making

Step 6: The buy signal and the reason

Journal the signals and indicators at which made you buy a stock. Were you just hyped with the news or alongside with the comments of traders? Always make a logical and clear decision with a good foundation of analysis, not with feelings. This will also help you understand more the importance of understanding the market structure and indicators. Was there a breakout? A hammer candle stick? A double bottom or an ascending triangle?

Step 7: Date when sold

Consider all dates important, as if they were your anniversary or even your birthday! Treat this as an important component of your trade for it will determine if you broke your rules and time frame.

Step 8: The sell signal and the reason 

Selling your stock also goes hand on hand with your time frame. Determine what was the reason for selling. Have you reached your stop loss or target profit? Was there a market breakdown or have you foreseen that the market is on downtrend?

Step 9: Principles and Results

As much as every step is important, you would and must also see the results of your trades! Have your stocks been performing well? Have YOU been performing well? Were your imposed rules and principles followed? If not, what were the results of your non-compliance with your principles?

Conclusion

Consider every step important. With the discipline of journaling, you will always continue to grow and develop the areas you need to improve more! 

Take note: You do not just record your success but failures as well! TAYOR!


Track your trading performance with InvestaJournal. Now available on InvestaPrime’s FREE 14-DAY TRIAL! 

Click on the photo to get your InvestaPrime FREE ACCESS.


Categories
Latest Posts News & Features

InvestaUniversity opens FREE Stock Market Classes for Everyone

Investagrams, the fastest growing social-financial platform, is opening the newest FREE Stock Market learning space named InvestaUniversity. The online university offers basic to advanced lessons about finances and investment to all. 

No matter the financial status, age, experience, and education — everyone can learn how to invest in the stock market. Everyone can improve their financial lives through wise investing.  Everyone is accepted into the InvestaUniversity. 

The mission is to create at least 10 Million investing Filipinos. And Investagrams saw that the only way to make this a reality is to help all Filipinos be educated about the unlimited opportunities in the stock market. Hence, the birth of InvestaUniversity. 

Investagrams pooled in a team of educators — JC Bisnar (CEO of Investagrams), Christian Silverio (Investagrams’ resident trader and private fund manager), and Paolo Tomacruz (Investagrams’ resident trader and private fund manager) who will break down the complex concepts of the financial markets to easy-to-learn and friendly weekly lessons. 

To further the students’ learning, InvestaUniversity has also prepared activities and homework which will be discussed in the live online discussions. 

“In InvestaUniversity, no one gets left behind. All the courses, the videos, the core curriculum, ia-upload natin ang mga lesson sa ating mga ng channels — on Youtube, Facebook, and on InvestaLearn platform — all for free. Kung gusto mag-participate, mas magkaroon ng commitment, magkaroon ng access sa mga benefits, then you can pay a tuition fee. At the end, bahala ka na literal. Dito sa InvestaUniv, we want it to make it as open and as inclusive as possible, and InvestaUniversity will make sure that no one gets left behind,” JC Bisnar, CEO of Investagrams said in their launch video. 

Your tuition, your call. 

Promoting education for all and inclusivity, Investagrams made InvestaUniversity’s core program to be free. But if you want to commit, participate in the weekly activities, and gain some perks, you can settle a tuition fee of your choice. Whatever the amount, it’s all up to you.

This program and tuition fee scheme may be the first of its kind in the Philippine Stock Market. 

To enroll in InvestaUniversity, simply follow these 3 easy steps:

1. Subscribe to Investagrams’ YouTube Channel (www.youtube.com/investagramsTV).

2. Follow the official Investagrams Facebook Page (www.facebook.com/investagrams).

3. Join the exclusive InvestaGroup community (www.investagrams.com/Group332).

Curious about InvestaUniversity? Know more here: http://invs.st/InvestaUniversity 

Categories
Featured How to & Advice

Philippine Stock Exchange Trading Periods

“Nag-enter ako ng buy order, bakit hindi lumalabas yung stock sa port ko?! HELP PLS!”
“Anong oras ba bumubukas stock market mga boss?”
“Ano po yung CLOSING?”
“HELP! GUSTO KO I-CANCEL YUNG ORDER KO PERO HINDI PWEDE. HUHUHU”
“MAMSER BA’T HINDI PWEDE MAG LAGAY NG TRADE? PANO BA TO? MAIIWAN NA AKO!!!!!”

These are just some of the questions that we, as beginners in the market, ask. I have to admit, I have asked these questions myself back when I was just starting out. So let me help you by explaining each trading period of the Philippine Stock Market in detail. Ready? Let’s go!

The Philippine Stock Market Trading Hours is divided into 9 periods. These are the following:
1. Pre-Open Auction Period
2. Pre-Open No-Cancel Period
3. Market Open
4. Continuous Trading
5. Market Recess
6. Pre-Close Auction Period
7. Pre-Close No-Cancel Period
8. Run-Off/Trading At Last
9. Market Close

Let us explain the periods one by one.

1. PRE-OPEN AUCTION PERIOD

9:00 am – 9:14 am

This is the first period of a trading session. In this period, you can enter, modify, or cancel your orders. However, no matching of orders will occur. That means if you place a “buy” order, you won’t see it in your portfolio just yet.

This is the time when you see bids and asks way off from the previous closing price just like this one:

2. PRE-OPEN NO-CANCEL PERIOD

9:15 am – 9:30 am

Unlike the pre-open from 9:00 am to 9:14 am, during this period, you are allowed to enter orders but CANNOT cancel or modify them. This is the period when you want to view the projected opening prices of stocks since most of the fake bids and asks are usually cancelled before entering this period. You can view the projected open of a price at https://www.investagrams.com/Stock/ProjectedPrice.

3. OPENING PERIOD

9:30 am

This is the period when the Opening Price for all Stocks is calculated. During this period, the Order book is frozen and you cannot enter, modify, or cancel an order. After all opening prices are calculated, the order book will be unfrozen.

4. CONTINUOUS TRADING

9:30am – 12:45 pm

This is when orders are automatically matched at the Best Price in accordance with the Revised Trading Rules.

5. MARKET RECESS

During this period, trading for all stocks is halted. You cannot enter, modify, or cancel orders during this period. Currently, there is no market recess in the Philippine Stock Exchange. Before the March 16, 2020 shortened trading hours, the market recess was from 12:00 nn to 1:30 pm.

6. PRE-CLOSE AUCTION PERIOD

12:45 pm – 12:47 pm

This period is the same as the Pre-Open Auction Period. During this period, you can enter, modify, or cancel Orders.

7. PRE-CLOSE NO-CANCEL PERIOD

12:48 pm – 12:49 pm

During this period, you are allowed to enter Orders but cannot cancel or modify them. If you want to cancel an order, make sure to do it before this period to avoid unnecessary losses.

8. RUN-OFF/ TRADING-AT-LAST

12:50 pm – 12:59 pm

Traders can enter Orders ONLY at the Closing Price. In this example, $MM closed at 2.65 with 1.03M shares of unserved offers. If you want to buy this stock, then you can place a buy order at 2.65 and you will see it in your portfolio after the transaction. If, however, you already owned some shares and you want to dispose them 1-tick lower at 2.64, you will have to place the sell order at 2.65 even if you are willing to sell it at a much cheaper price.

9. MARKET CLOSE

1:00 pm

This is the last period of a trading session. No trading activity occurs here. This is the time when you reflect and journal your trades and screen stocks for a potential play in the next trading day.

CONCLUSION

The key to an effective trading is to keep these market periods in mind before you enter or exit a trade. If you want to place orders at the opening price, you may place them during the pre-open no-cancel period since fake paddings from other market participants are usually cancelled before entering this period. The same is true if you want to place an order at the closing price — you may place it during the pre-close no-cancel period. These simple gestures will save you a lot of headache.
You don’t want to get confused during market hours. So set forth children of the market, use these information to your advantage and dominate the trading world!

Contributor:

Full Name: Geyzson Kristoffer S. Homena
Investagrams username: @GeyzsonKristoffer

Channels:
www.facebook.com/GeyzsonKristoffer
www.investagrams.com/Profile/GeyzsonKristoffer

About the Contributor:

An Applied Mathematics graduate and a full-time teacher, Geyzson Kristoffer is a part-time trader who has been an active user of Investagrams since 2017. He spends his mornings, afternoons, and evenings learning about trading and reading books: Alexander Elder’s Trading for a Living being his favorite. Cohering to his passion and profession, he set his heart on teaching and helping newbies, but only the dedicated ones.

Subscribe to our Newsletter

Join our mailing list for investing tips and stock market advice
to help you reach your first million.

You have Successfully Subscribed!