Categories
Featured News & Features

Mark Ritchie: Lessons from a Market Wizard

A market wizard is a trader who has placed blood, sweat, and tears into mastering the craft. Market wizards are the few who are able to outperform the market and their peers by an astounding number. A market wizard is someone who, in the face of adversity, continues to persevere. Hitting rock bottom may be where others quit, but this is where market wizards learned the most essential things to make them successful in the financial markets.

If you’ve read The New Market Wizards by Jack Schwager, you should be aware of Mark Ritchie. He, like many other traders, went into the market and lost a fortune. However, unlike most traders, despite hitting rock bottom, Mark Ritchie did not give up. Hitting rock bottom is one of the most difficult moments to experience in life. However, it is only those who can rise up in the face of adversity who truly take their craft to the next level. That’s what Mark Ritchie did. This is why he is a true market wizard.

We conducted a short interview with David Guerrero, an equities trader from California. He has been a long time fan of the Market Wizards series throughout the years, he takes pride in having read all four. David says that one of the keys to his consistency in trading was being able to learn from those who have outperformed the market themselves, the market wizards. We asked to talk about what he learned specifically from Mark Ritchie in The New Market Wizards.

David said that one of the most significant things he learned from Mark Ritchie was to conduct his own research. When he was just starting out, he always relied on tips from his friends or from brokerage recommendations. “I thought following brokerage advisories was a no brainer since the recommendations came from professionals, I was dead wrong!” After reading about Mark Ritchie, David made a commitment to only rely on his research alone.

“Another rookie mistake I used to make was trade a large position size relative to the size of my portfolio. Even worse, I traded more when I was in a losing streak. I thought to myself, ‘If I trade twice as large then I can regain all my losses twice as fast.` Yet again, I was wrong. Another important lesson I learned from Mark Ritchie was to keep each position size small, especially if the trade hasn’t shown a profit. I will only increase my size once the position shows me a profit.”

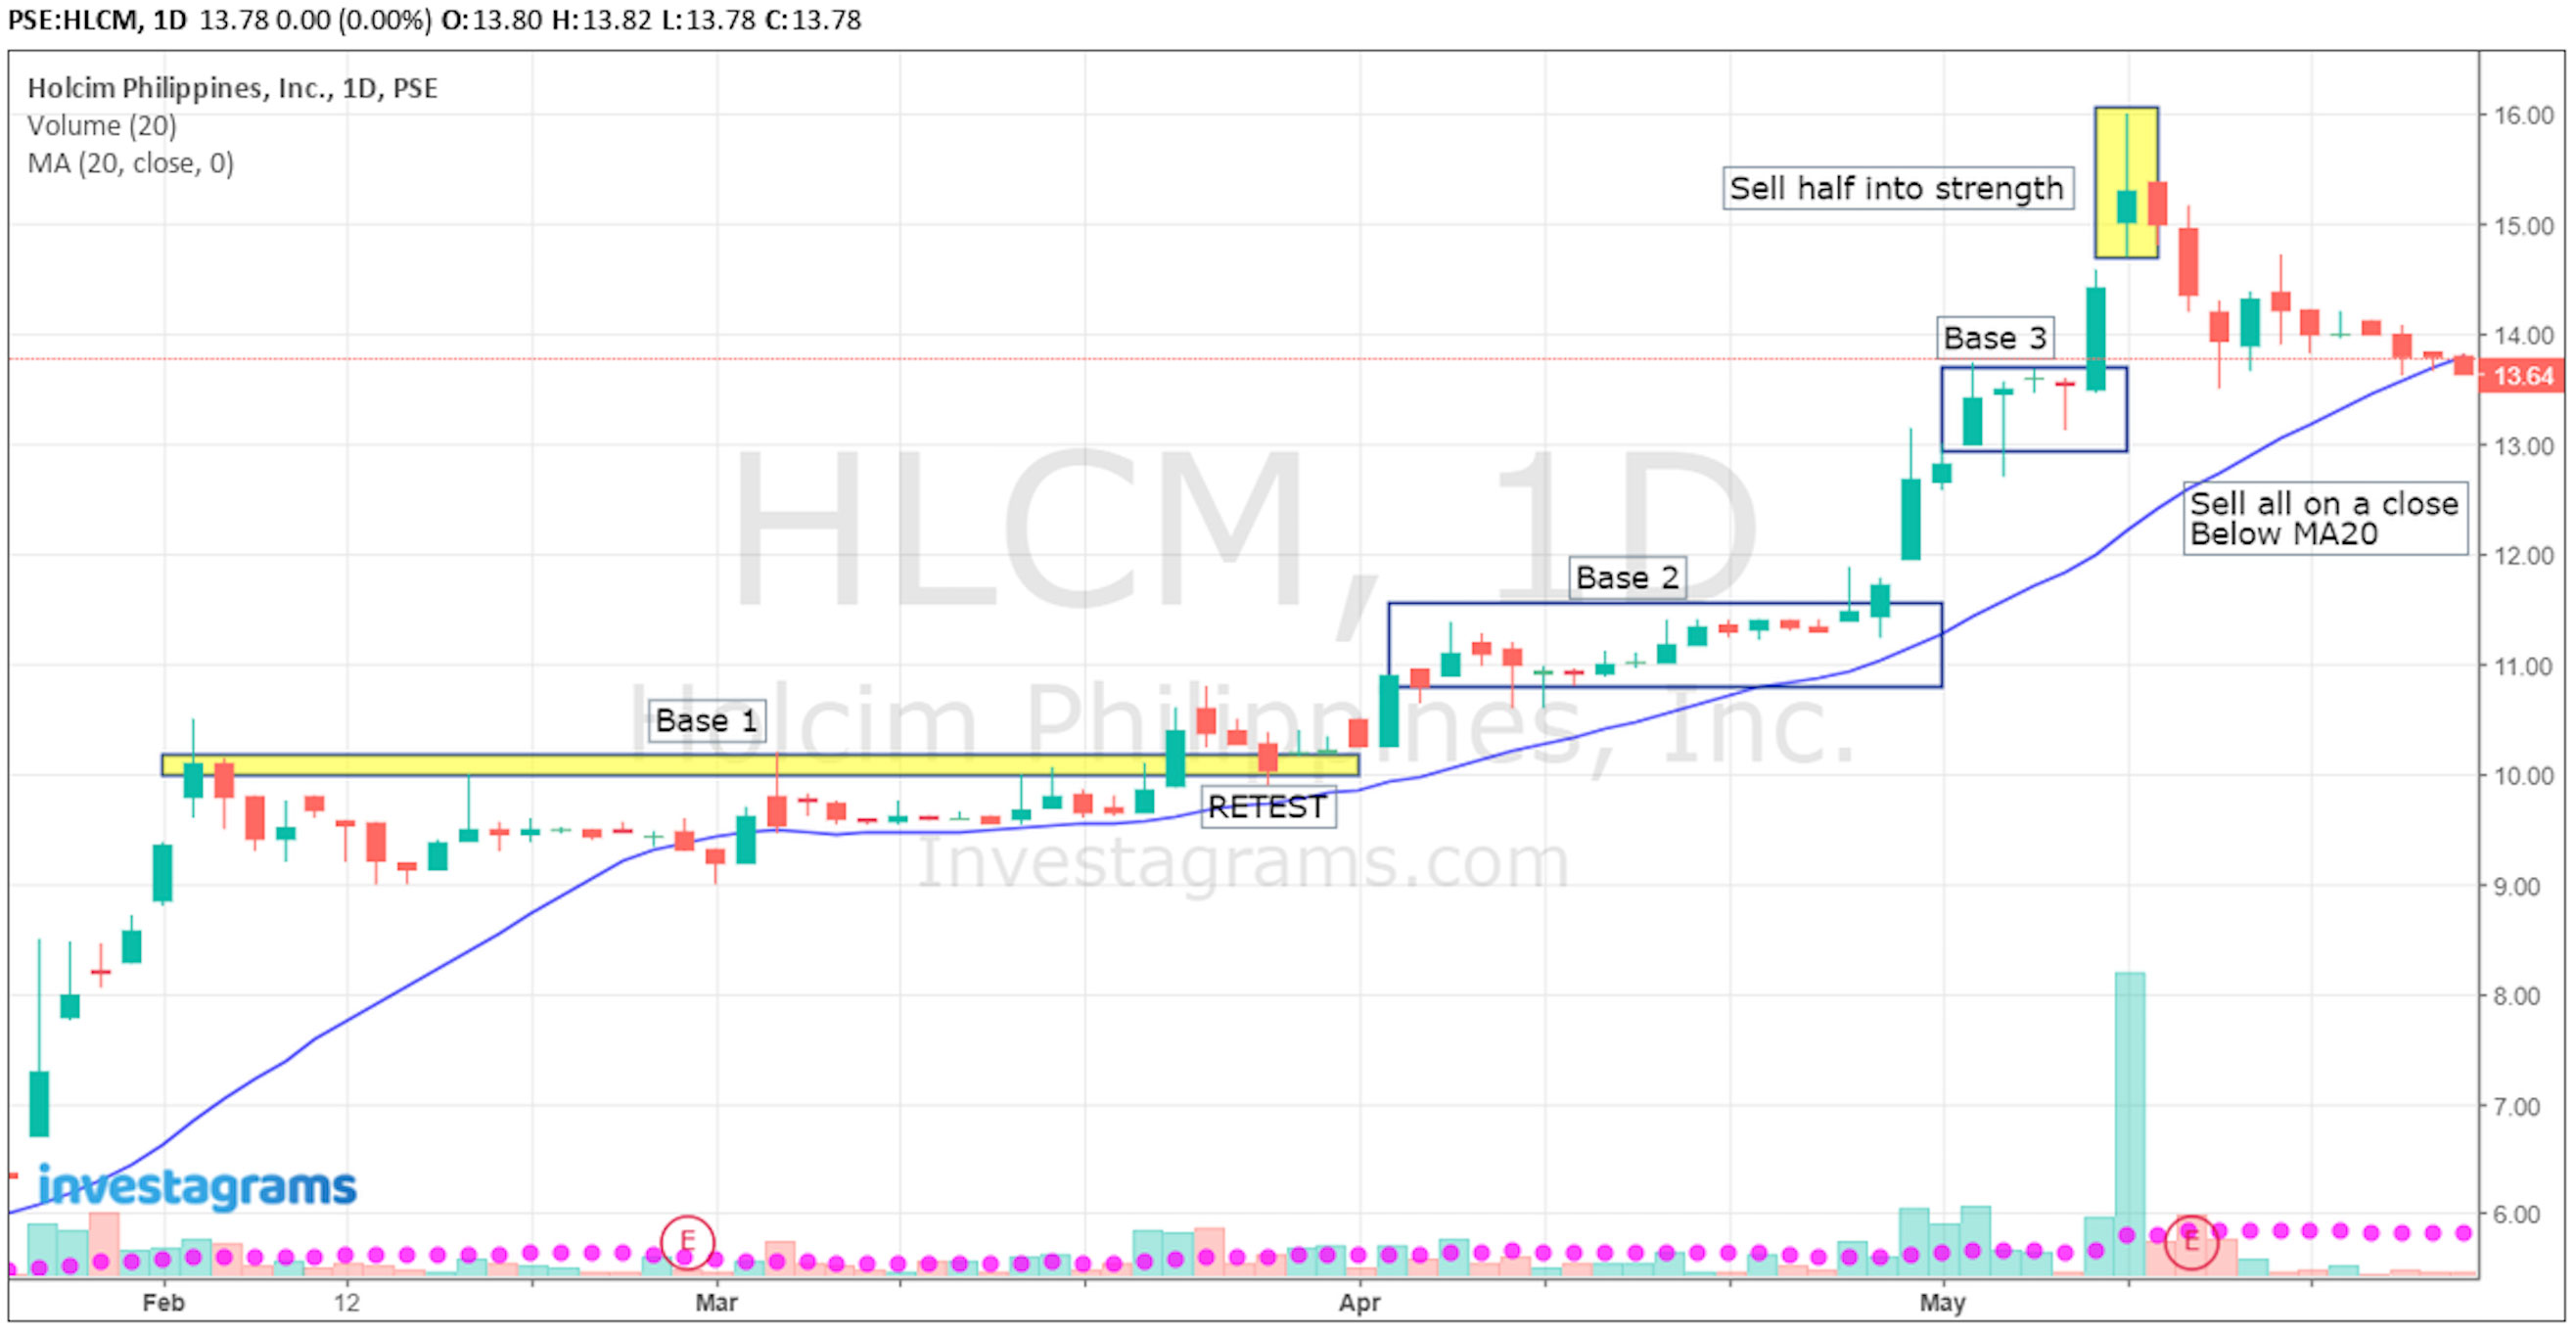
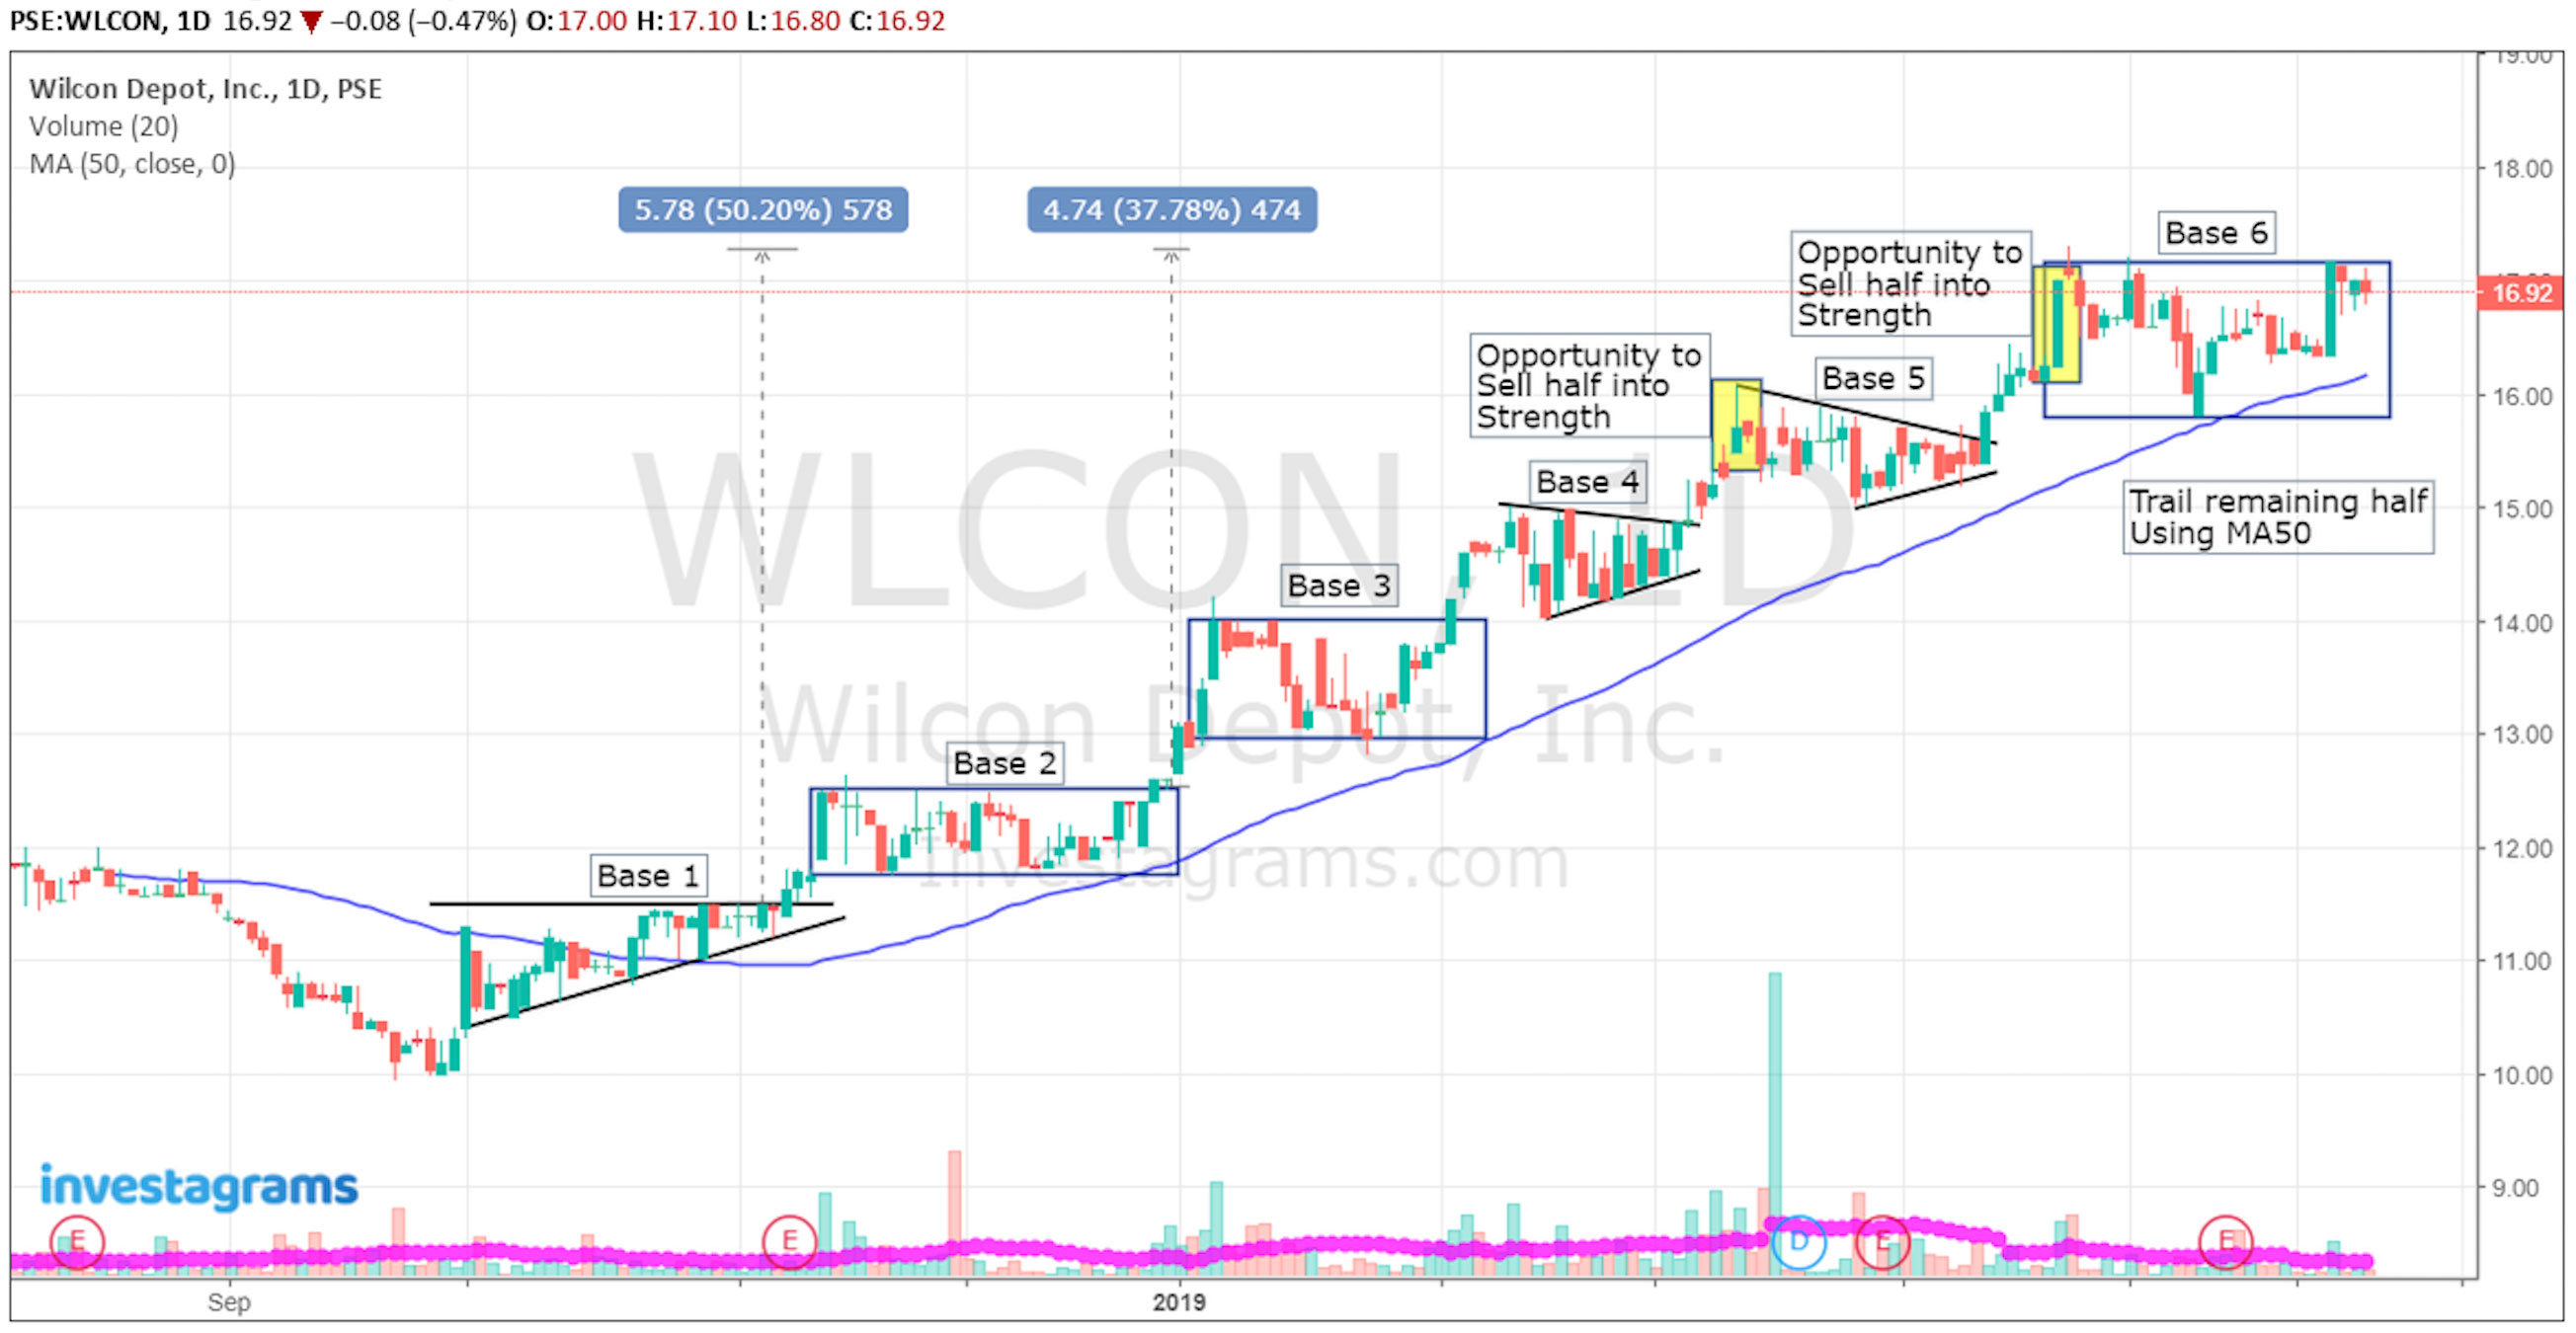
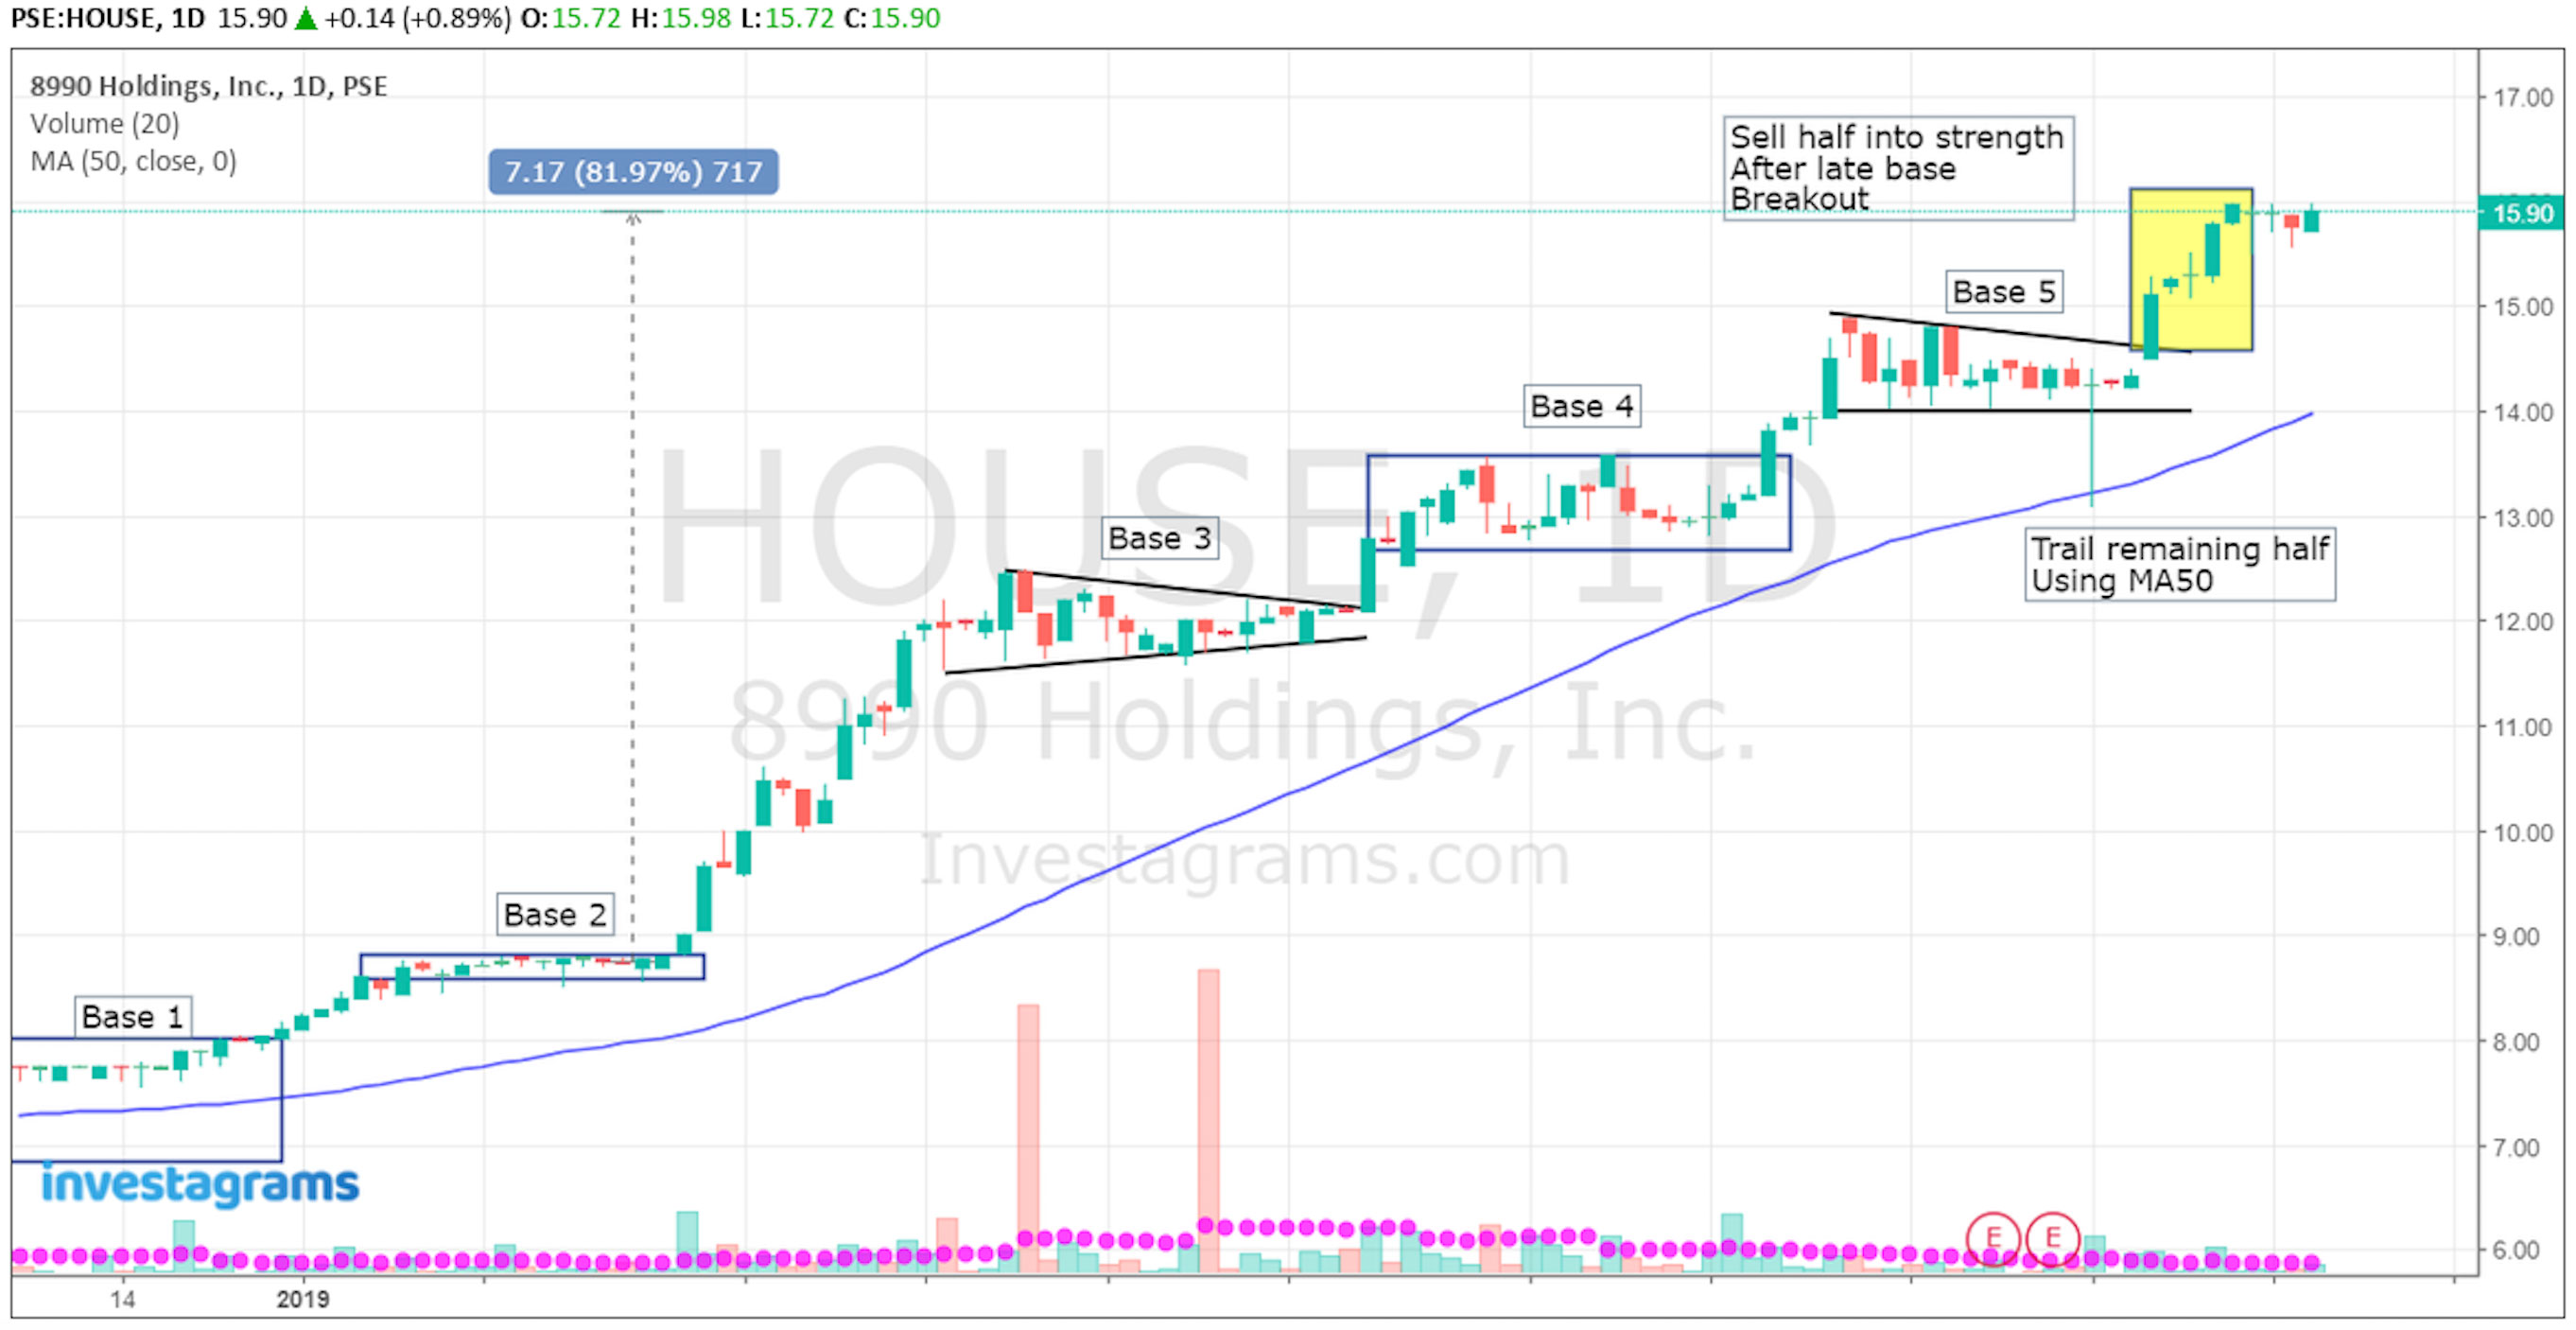
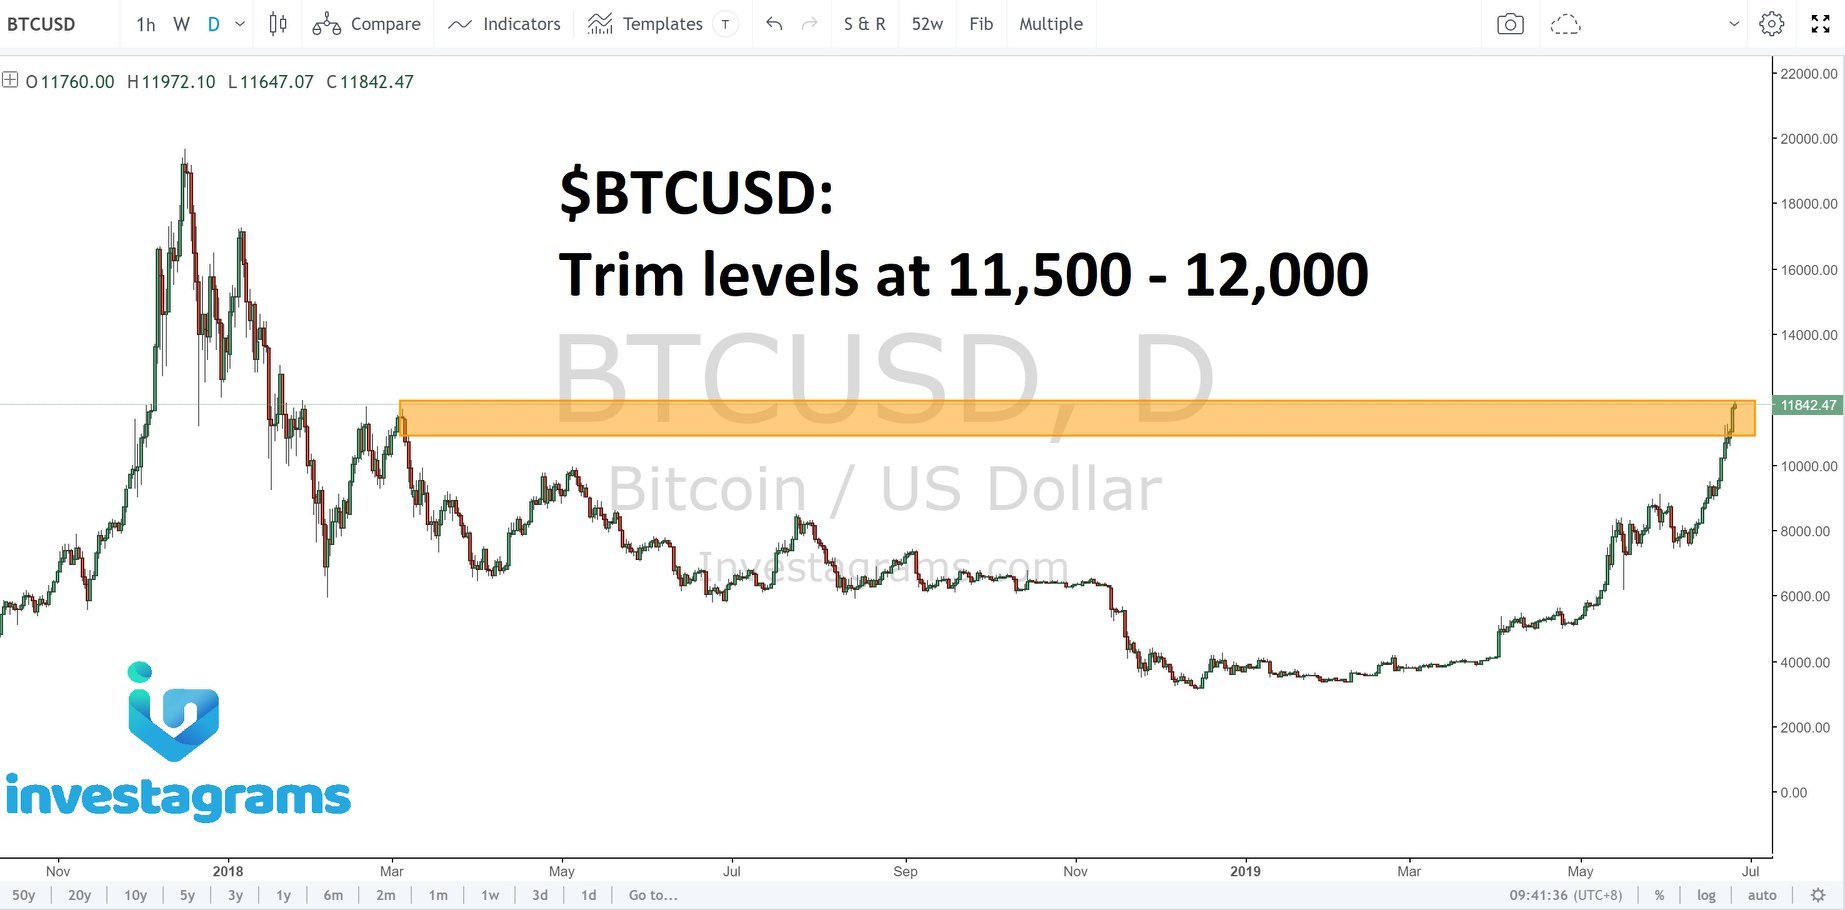
“Lastly, I also used to be afraid of leaving money on the table, so that usually lead to me closing my positions too early.” David said. “After reading about how Mark Ritchie holds his positions for a long period of time as long as they’re still working, I began to gain confidence in allowing my winning positions to continue their move without selling prematurely. Later in my career, I started to sell a portion of my position at significant resistances in order to lock in some profits on the way up.” He added.

The story of David’s trading journey is not so uncommon. One way or another, the Market Wizards series have definitely helped a lot of traders. From the entire series, it’s easy to find that market wizard we can relate to, especially during our rookie years. Up to the time we start profiting in the markets, the Market Wizards series never fails to inspire us to continue doing better. We all aspire for their accomplishments, and yearn to be better in trading everyday.

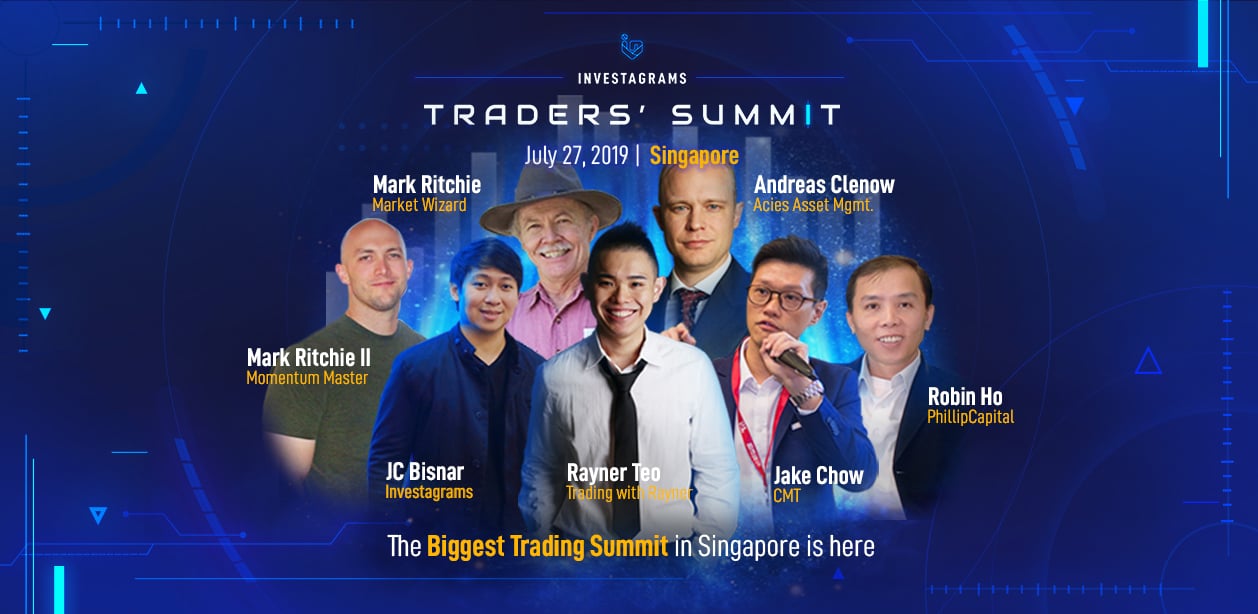
This time, we have the chance to meet Mark Ritchie, one of the most famous Market Wizards. The experience to learn from him live, and how he has improved over the years is one of the rarest opportunities a trader can experience. This is exactly the opportunity Investagrams is giving to the community.

This July 27, at the Joyden Hall, Bugis, get to meet Mark Ritchie as he preaches about the challenges of how to be a successful trader.


Categories
Featured News & Features

Sonic R System Joins Investa Traders’ Summit Singapore this July!

KYAW

Kyaw is the founder of Sonic R System, which is one of the most popular thread in Forex Factory with thousands of followers: 78,000 post replies with 14 million views to date.

Forex Factory is ranked as the world No. 1 Forex Trading website. Sonic R System is also very popular among the FX/Index/CFD communities with the existence of growing audience of Sonic R System’s Facebook Group.

Kyaw conducts exclusive seminars for keen trading enthusiasts. His signature course Sonic R Mastery has been running successfully since 2015. The graduates of this course are from the countries such as Singapore, Malaysia, China, Spain, England, Belgium, Australia, New Zealand, Philippines, and Germany. His graduates are able to draw with the consistent profits from trading. One graduate who is also a CMC client has managed to make 144% ROI — a whopping $98,000 to $240,000 from April to July 2018.

He is also invited regularly on CMC events, Trade Fairs, SG FX Group meet ups, TRT Roundtable Seminar Talks, and SG Trader Club for regular market updates. He is well known for his down to earth approach of “Before and After” trade call with pictures of the charts sharing it on Facebook and Forex Factory pages. He made the Sonic R Trading System to be freely available, while he can keep all to himself because he believes that Sharing is Caring.

His trading style is akin to swing trading and he is a firm believer of risk management. It will eliminate risk on the positions as quickly as possible while letting the trades to maximise the profit by letting the trades run.

It also emphasises on positions building and add positions to the market once the intended trend is established to maximise the return.

Kyaw’s on-the-dot accuracy and trading philosophy has inspired many traders, and he is now the Top 20 contributors in the TradingView website.

JAMES

James is the Co-Founder and the Trainer of the famed Sonic R Mastery Course. Along with Kyaw, they have mentored over 600 students internationally along with after training program to support the members with full house attendance.

He has trained in Mudley Training Institute, a well-known and established financial trading company in Thailand to sharpen his skills and to learn how big funds manage their portfolios with minimal risk and optimise the performance for stability.

His preferred trading style is swing trading and believe in riding the first sign of reversal using pure technical chart with unique methods of identifying turning zones. He only takes trades that provides a minimum of 1:1 risk to reward and has achieve multiple 1:10 risk to reward trades by having the patience to allow his trade to run to its full potential.

Hear more from them this coming July as they join the Investagrams Traders’ Summit Singapore! Stay tuned!


Categories
Latest Posts

Investagrams Featured Trader of the Week: Magnum

Congratulations to our Featured Trader of the Week Magnum who was able to spot $ABA (AbaCore Capital Holdings, Inc.) a few days before it broke out from its 6-month high! Magnum noted that the momentum for the stock is still definitely towards the upside, while also highlighting the support levels, resistance levels, and an area where you can set your stops. Also, Magnum pointed out that if $ABA can break .83, which it did, the stock could possibly go for .89. Not only did it reach .89, it closed the week as high as 1.05 which made it as one of the top gainers last Friday, June 28!

Here’s his $ABA analysis: https://www.investagrams.com/Post/Magnum/719686

On Technicals

If you take a look at $ABA on the daily chart, you’ll notice that there were only two optimal entries given. You could have bought at .70 when the stock broke the neckline of its double bottom pattern, or when it broke its 6-month high at .90 levels. More likely than not, there were many traders who missed out on this due to the volatility along with having a difficulty in spotting good low risk entries.

Whenever that’s the case, you can look at intraday timeframe to see if there are possible entry points you can’t see on a daily timeframe. Looking at $ABA’s 30-minute chart, you’ll notice that it went up in a staircase fashion. The stock simply consolidated or formed what’s commonly known as a Darvas Box every time it broke out from a previous one. Also, every time $ABA broke out from its consolidation it was always accompanied with above average volume which makes the breakout more likely to continue rather than go back inside the box.

What’s Next for $ABA?

Is $ABA’s move over? We can’t tell for sure. After checking the InvestaJockey, many have been posting about how JP Morgan has been continuously accumulating shares of this stocks, so there may still be a bigger move that will unfold. See InvestaJockey results as of Friday, June 28:

Ideally, $ABA should create a high tight flag while retesting the one-peso levels, similar to what $GSMI has been doing. Unless it does this, $ABA may just overshoot immediately to 1.20 and possible even 1.40. If this happens, the stock would be too extended already and not advisable for entry.

Kudos again to Magnum who was able to spot $ABA a few days before it made a 6-month high breakout. As a token of our appreciation for being a notable trader for this week, you’ll receive FREE access to one-month InvestaJournal! Congrats also to everyone who was able to latch on to this market leader!

To learn more about InvestaJournal, please visit this link: www.investagrams.com/investaprime


Categories
Featured News & Features

Robin Ho: 2008 Market Crash Legend

Today, only a few have lived to tell the tale of how they survived the 2008 stock market crash. Even fewer are recognized as legends who got richer because of the crash. For those who barely know or remember what happened, here are the record breaking market disasters: Globally, the MSCI World Index dropped by 6%, the biggest drop since its establishment back in 1970. In the US, the Dow Jones Average dropped by 7%, the largest single day drop back then. For London, the FTSE 100 index dropped by 15%. Worse still, Brazil halted trading when their index dropped 10%. Gold jumped up to $900 an ounce (inversely correlated with USD) while, oil prices dropped to $95 a barrel. Clearly, the world of financial markets was in turmoil.

We spoke with Gary Smith, an equity investor from the United States, to share his experience during the 2008 stock market crash. “All hell broke loose!” was the first thing he said after we asked about what it was like being an investor during these times. “There was blood on the street (everyone was suffering a loss), everyone didn’t know what was happening.” Gary is in part a long term investor, as well as an active swing trader. “All of my long term bets during the time like General Motors, General Electric, IBM, and the like went down the drain so fast. To give you an example, I had IBM shares at $35 that I’ve been holding since 2005. GE crashed by around -80% during that time, I was lucky enough to get out at $24 only suffering a -30% loss.”

We asked Gary about his experience on swing trading during this period, he said “My man, these were crazy times. Almost everything you touched went down. People keep saying that this was the best time to buy more stocks as they were getting cheap, but that’s all hindsight. At the glare of the moment, it looked like the Dow was in a hole. I tried to trade through it, but I kept on getting stopped out. It was probably best to stay in cash during this period.”

Our last question for Johnny was, “What advice can you give to traders who have never experienced a global financial crisis?” Johnny answered, “Learn the ability to sit out during tough times and stay in cash. You may miss a couple of bargains, but you’ll also avoid getting wiped out entirely. This doesn’t mean that there aren’t any opportunities to make money in market declines. You can either short the index and individual stocks, or try to find bargains in the market. However, the ability to stay in cash is completely underrated.”

It is without doubt that the 2008 stock market crash was one of the most gruesome events a trader can experience. Any regular trader would be happy just to survive the crash. However, within the gardens of Singapore, lies a legend. A trader who not just made profits catching the bottom of the crash, but grew his portfolio 20 times its initial size. In the span of 15 months time, Robin Ho grew his $100 thousand to a massive $2 million during a period countless of traders around the world lost fortunes.

Yes, knowing when to stay in cash plays a huge role in staying alive in this game. Avoiding the markets when the rewards does not look favorable, as opposed to the risk, even plays a bigger role in winning this game. But the most important part of this game, is knowing when to jump back in. After all, the ultimate goal of any trader is to profit in the markets. Catching bottoms is one of the most challenging things you will do. It requires a confluence of multiple strategies to pull off really well, and the psychological burden to pull the trigger (or enter back) is even greater. But catching market bottoms can also be the most rewarding, if not life-changing, investments you can ever take. Your investment should grow exponentially as you ride through and maximize the entire trend. There are no clear shortcuts to financial freedom, but clearly there are ways to fast track it. And when that opportunity arises, it is up to us to make the move.

As the US and China trade wars continues, we cannot really predict what will happen next. More importantly, we do not know when another global crisis can break loose. However, when the time comes, what’s most vital is we know how to react. Which is why this July 27, 2019, at the Joyden Hall, we have asked a legend, Robin Ho, to share to you proven key strategies on how you can not only survive, but WIN in a global crisis.


Categories
Featured How to & Advice

Base Counting: Identify the Lifespan of Today’s Leading Stocks

One of the key lessons that Mark Minervini teaches in his book “Trade Like a Stock Market Wizard” is the concept of counting bases. Minervini only buys stocks that are in what he calls a Stage 2 or Uptrend, or the advancing stage. This is where stocks create explosive moves that can help a trader create the most amount of money or possible gain in the shortest amount of time.

Within a Stage 2 Uptrend, assuming the stock doesn’t get extended too early, are bases. Minervini states that the best time to get into a stock that’s in a Stage 2 Uptrend is during the 1st or 2nd base. At this point the stock isn’t on the public’s radar yet. Once a stock makes a third base that’s when it’s obvious to the general public that the stock is trending strongly, but an entry at this level is still acceptable. If a stock reaches a 4th or higher base, it’s prone to deep pullbacks and it not advisable for entry.
Learning the concept of counting bases will allow you to time your entries during the 1st or 2nd base. Also, knowing when a stock is at a 4th or higher base can be a signal that it’s time to sell into strength.

Base counting is somewhat subjective, so there’s no perfect way of doing it – as always, practice to get better and challenge yourself to learn more.

Here are a few examples:


BUT TAKE NOTE!

Just because a stock has reached a 5th base doesn’t mean a stock can’t make even more bases. The importance of base counting is not selling on a 4th or 5th base, rather, it’s just like an “FYI” for you to know where the stock is in its 2nd Stage Uptrend. Stocks that have made a 4th or 5th base can be prone to deep pullbacks and knowing this is very significant to your selling.

Also, when a stock is in a late stage base (4 and above) it can go through what is called a climax run-up or climax top. This is when a stock just goes crazy euphoric and the prices spikes up maybe 10, 20, or 30% in one day! This is a golden opportunity to sell into strength.

By knowing that a stock is in a late stage base, especially if you’re in a tail end of a bull market, can allow you to sell half of your position into strength if ever the stock breaks out, them simply trail the remaining half using MA20 or MA50.

It’s important to have a plan to selling either into strength or into weakness (using a trail stop) Here’s the thing however, if you sell into strength you’ll usually sell too early, and if you sell into weakness you’ll usually sell too late. Well, that normal. You’ll never be able to pick the tops and bottoms on a consistent basis; the goal is to sell at a price higher than the price you made your purchase.

Few more samples below:

FINAL THOUGHTS

Always remember, counting bases is not used as a selling technique; it’s a way to identify where a stock is within it’s longer term Stage 2 Uptrend. If a stock is in an early stage base (1-2) it’s the best opportunity to purchase the stock while it’s still not on the public’s radar. If a stock reaches base 4 and above is not an outright signal to liquidate your position, it’s a signal that you should be more cautious with your position and always be ready to sell either into strength or weakness.

Categories
Featured News & Features

Bitcoin Reached $13,000: Are We Now On A Crypto Bull Run?

With the recent happenings in the crypto world, many institutional investors and traders are eyeing bitcoin and other cryptocurrencies and with the anticipation of of bitcoin price reaching its eye-watering 19,000 levels, one thing definitely comes to a trader’s mind before he hits the buy button: are we really on a crypto bull run?

OUR VIEW ON BITCOIN ($BTCUSD)

Bitcoin’s (BTC) price rose to fresh $13,358.68 as of June 26 trying to surpass the highest level since January 2018 and now currently trading on a pullback at 12,200+ to 12,300+ levels.

Congrats to those who bought and accumulated early, but now we believe we need to be more careful.

We’re in a critical resistance point at 12,000 to 12800 and from here on we prefer to trim and lighten up at this point.

WHY? Here’s our take.

The biggest crypto has awaken on the back of Facebook entering the cryptocurrency space through LIBRA and with the recent happenings on the cryptocurrency world, many traders and analysts also believed that the LIBRA announcement has a big role to play in this market. The crypto community also took the news to Twitter and celebrated the bitcoin when it crossed 10,000 levels through #Bitcoinisback hashtag and became the number one hashtag on Twitter world last week.

However, we believe that we should think about the bigger implications of LIBRA in the crypto space.

Libra is potentially a MASS adoption cryptocurrency. Even if only half or 20% of FB users utilize it, it will likely be the most used crypto for a lot of transactions in the WORLD.

This goes against the basic use case of Bitcoin. While Bitcoin is the god father of the innovation/concept behind cryptos, we think that more and more big companies (Facebook and Telegram has already led the way) in the future will launch truly scalable and efficiently usable cryptocurrencies in the future.

And as more reliable cryptocurrencies emerge in the future, the use case for bitcoin in terms of regular transactions diminishes.

What does this mean on a trader’s perspective? Our view is that we shouldn’t get too hyped up with the recent rally. Take into perspective that people are getting that slight boost of euphoria from Facebook’s Libra announcement.

Take note that we’re in a critical resistance point at 12,000 to 12,800 and from here on we prefer to trim and lighten up on Bitcoin as we move forward. A breakdown below 11,000 can trigger a bigger dip, that’s where we re-assess and see potential pick up points once the hype has cooled down.

As always, apply your own strategies and risk management protocols. We are just sharing our personal view on this matter!

Learn more about trading from some of the most notable traders and fund managers in the world in Investagrams Traders’ Summit Singapore this July 27, 2019: www.investagrams.com/traderssummitsg

#BTCUSD #Bitcoin #Cryptocurrency #InvestaGlobal

Categories
Featured News & Features

Investagrams Featured Trader of the Week: K E R L O

Congratulations to K E R L O, also known as @carlosamonte, for spotting $CHP (Cemex Holdings Philippines, Inc.) 17 days before it even formed its Inverse Head and Shoulders bullish reversal pattern! He notes that there could be two possible ways to enter the stock: either at the 0.5 or 0.168 Fibonacci levels for aggressive traders, or at the breakout of the neckline at 2.80 for those who want to wait for confirmation.

Initial Spot:

A few days after:

Here’s what happened a few days after Carlo posted his initial view on $CHP. He noted that if you weren’t able to catch the dip towards support levels, it’s okay since that would’ve been a very risky and aggressive buy. Carlo reiterates that the next optimal entry is the breakout from the Inverse H&S pattern at 2.80 area. He also gives everyone a very important reminder, if you planned to purchase $CHP when it broke out, then you should also practice proper risk management and place your stop below the breakout level. Lastly, he says that possible take profit areas would be 3-3.20, then possibly 3.40-3.60 levels.

On Technicals:

Currently, $CHP has already broken out of its Inverse H&S pattern on above average volume. Taking a look at a longer-term view, we can see that the volume activity since the end of 2018 is MASSIVE compared to the months prior, indicating that a reversal, or at least a counter trend rally, may be brewing. Take note, $CHP is still in a long-term downtrend. There’s still a ton of overhead supply since there are still trades holding on to losing positions which may act as a resistance as prices continue to climb higher. So, unless there’s a significant catalyst that indicates a reversal, a swing towards 3.50-3.60 levels may already be a good area to trim majority of your position.

Kudos again to Carlo for spotting the $CHP more than two weeks before the Inverse Head and Shoulders pattern was completed. Your FREE one-month InvestaJournal will be accessible to your account soon! Let’s all keep an eye on this stock this coming trading week to see if it can potentially break the 3 pesos resistance.

Congrats also to everyone who was able to ride his analysis – you possibly gained around 25% coming from its bottom at 2.32 and last Friday’s close at 2.92 or it’s breakout!


Subscribe to our Newsletter

Join our mailing list for investing tips and stock market advice
to help you reach your first million.

You have Successfully Subscribed!