Categories
Latest Posts

Backtesting the MACD

MACD can help gauge whether a stock is overbought or oversold.  Traders are alerted to the directional move’s strength and warning of a potential price reversal.

But what is a MACD? How should it be used? When is it best utilized? Let’s find out!

WHAT IS THE MACD

The moving average convergence divergence (also known as the MACD) is one of traders’ most often used indicators. It is simply a trend-following indicator that displays the connection between two moving averages.

Traders use MACD to detect changes in the direction or strength of a stock’s price trend. At first look, MACD may appear sophisticated since it is based on supplementary statistical ideas such as the exponential moving average (EMA). But fundamentally, MACD helps traders detect when the recent momentum in a stock’s price may signal a change in its underlying trend. 

This can help traders decide when to enter, add to, or exit a position.

COMPONENTS OF MACD

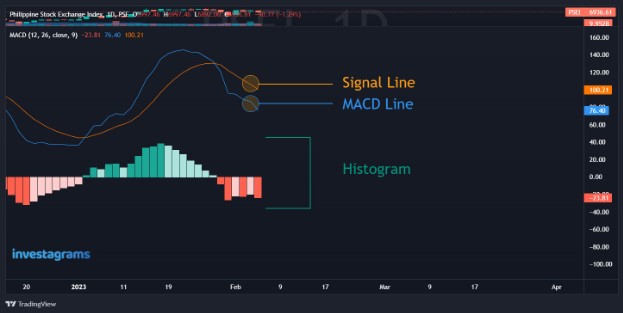
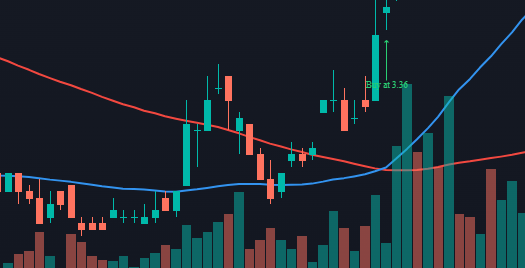
A MACD chart is made up of three components: the MACD line, a signal line, and a histogram, all of which are shown on a horizontal axis known as the baseline. The indicator is typically shown right below the price chart of the stocks. This allows price movements to be compared to changes in the MACD chart.

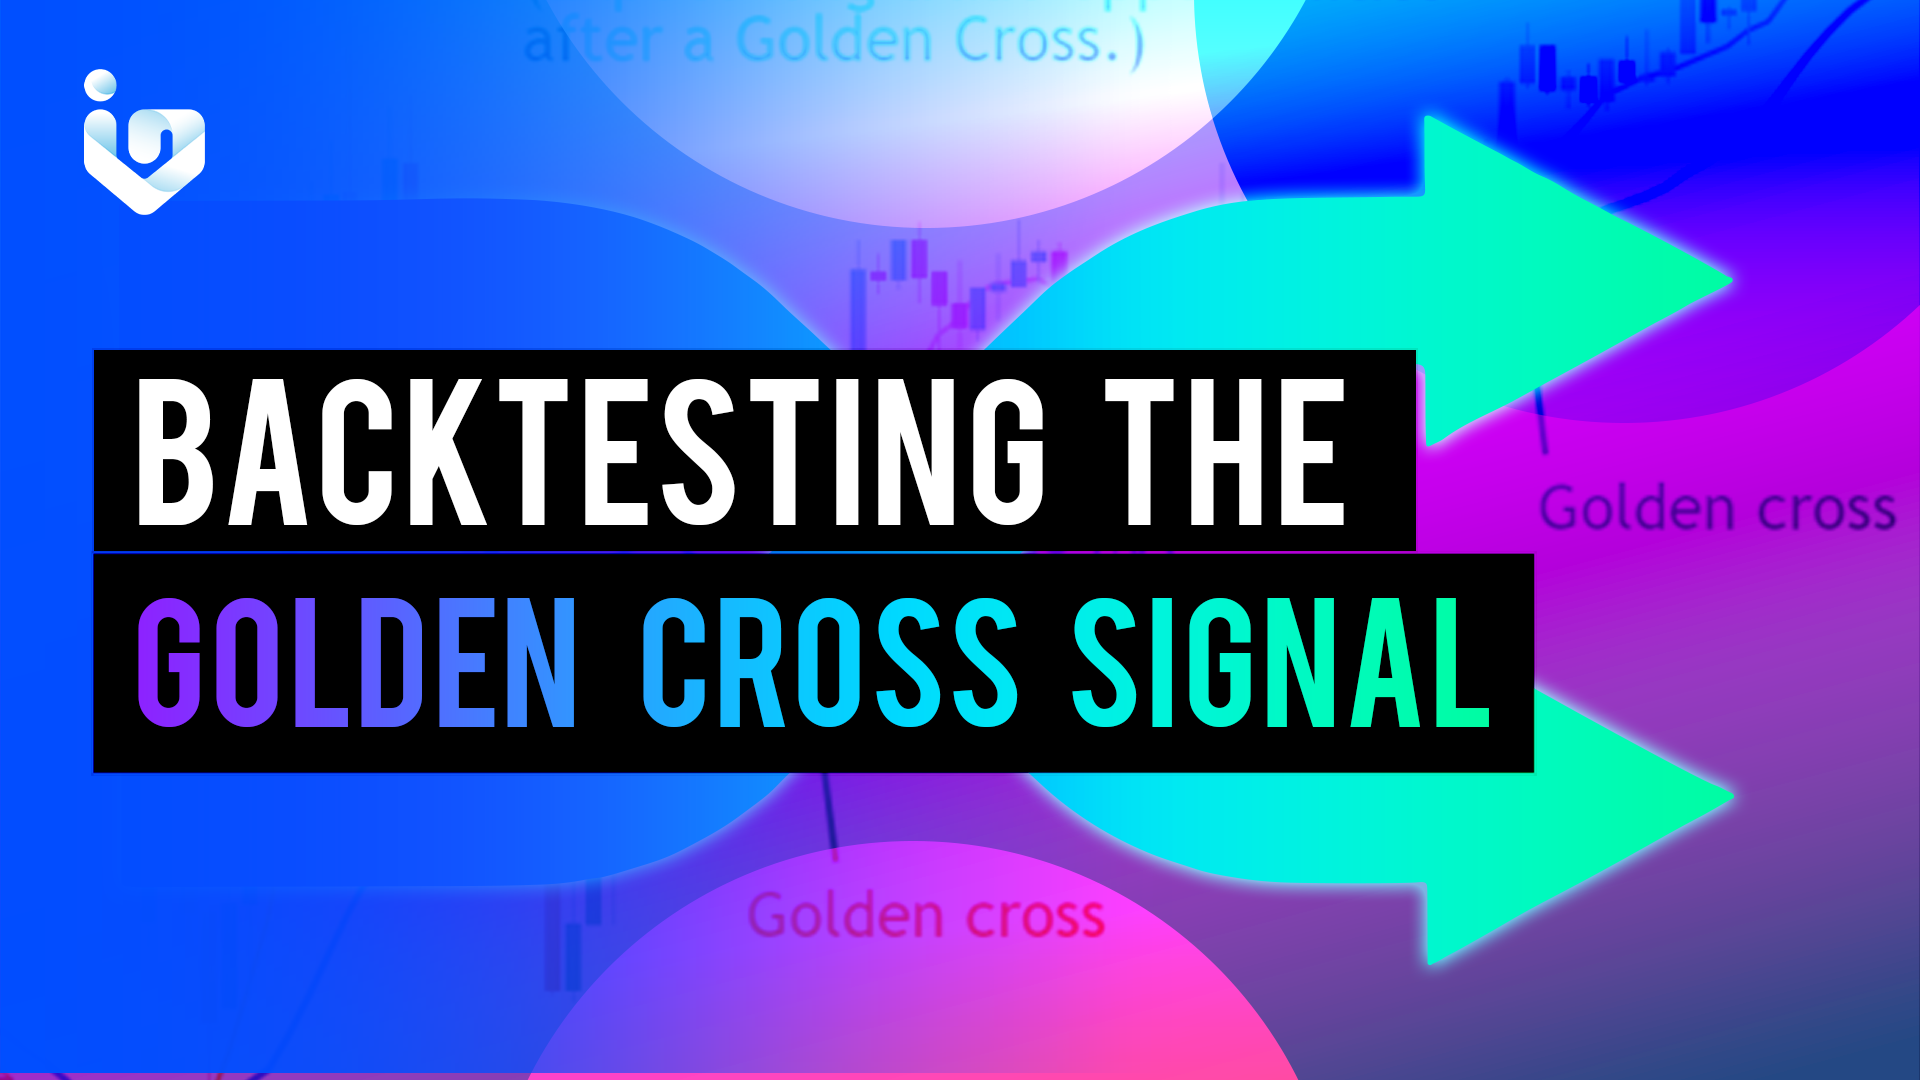
MACD BACKTEST APPROACH

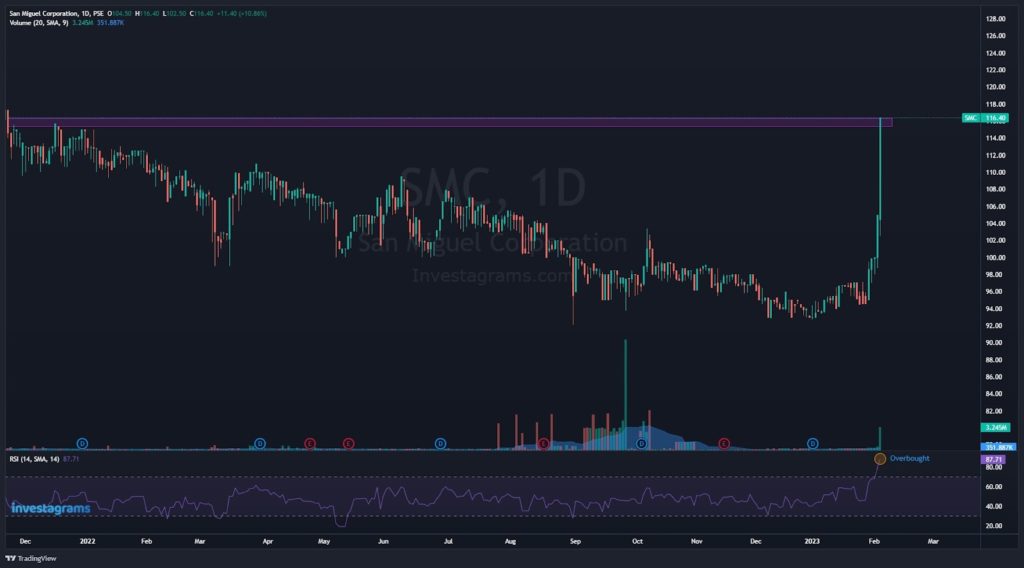
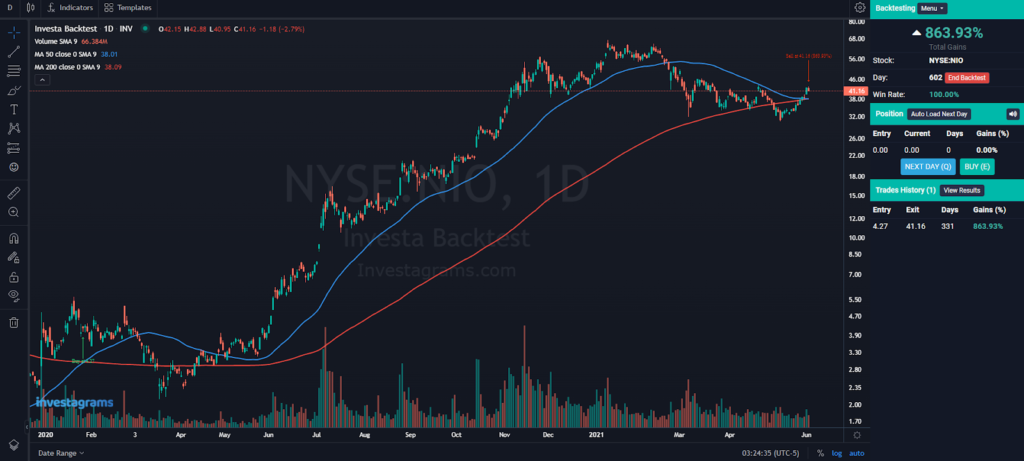
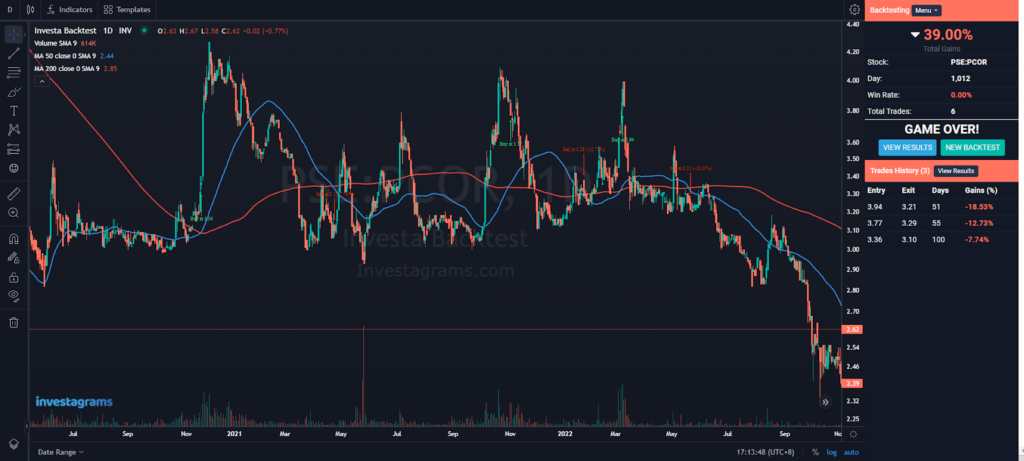
For this backtest, the indicators we used are the EMA 100 and the default MACD. The EMA 100 is used in order to assess the trend of the market. The stocks covered were U.S. and PH stocks. Random liquid stocks were chosen, with historical data starting from January 1, 2020. 

The trades’ framework will be as follows:

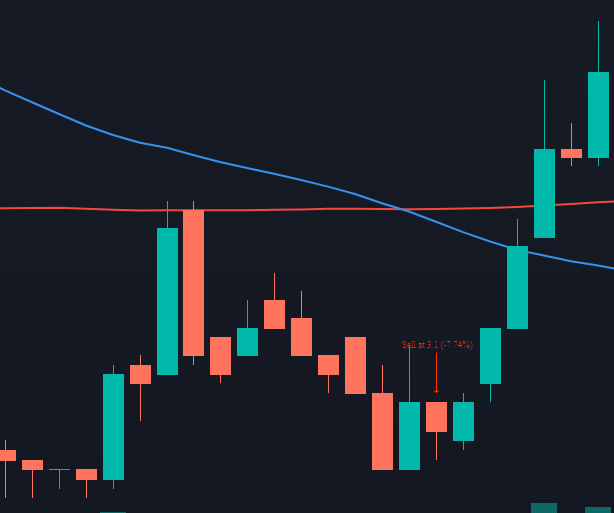
  • Long positions are entered once the MACD line crosses over the Signal line.
  • Positions are then sold once a decrease in momentum is signaled by the MACD line crossing under the Signal line. Positions are also sold if there is a big change in market sentiment; hence, we must cut losses to prevent further deficits. 

RESULTS USING THE MACD STRATEGY

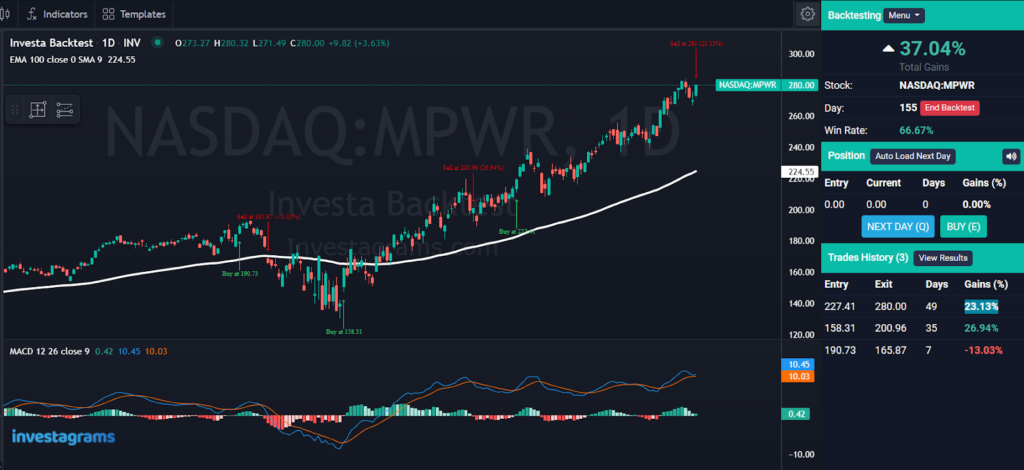
The strategy had a hit rate of 54% and an edge ratio of 1.80 over about 100 trades. It is important to take into account that trends play a substantial role in determining the success of each trade. That is why we also took into account if prices were above the EMA 100, which serves as an additional indicator to determine if the MACD signals were only portraying false positives. The majority of the significant gains were positions executed in above the EMA 100. 

INSIGHTS

Here are some key insights that can be taken from the test done:

  1. The trend is your best friend.

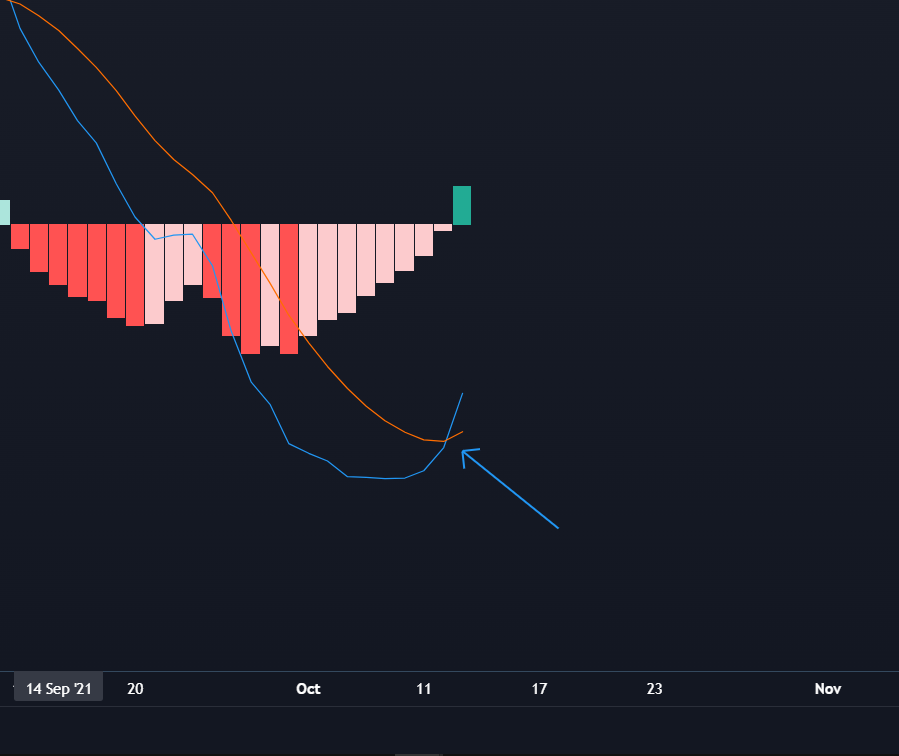
False positive divergences frequently occur when an asset’s price goes sideways in a consolidation. Being able to determine where the stock’s trend is going would be essential in verifying the signals given by the MACD. Buy signals that are against the trend are most often retracements which leads to the risk of buying even if there is a chance that the price would continue to go lower.

  1. False moves are common, so it is better to confirm first 

It is advisable to wait three or four days after a signal line crossing to ensure that it is not a fake move.

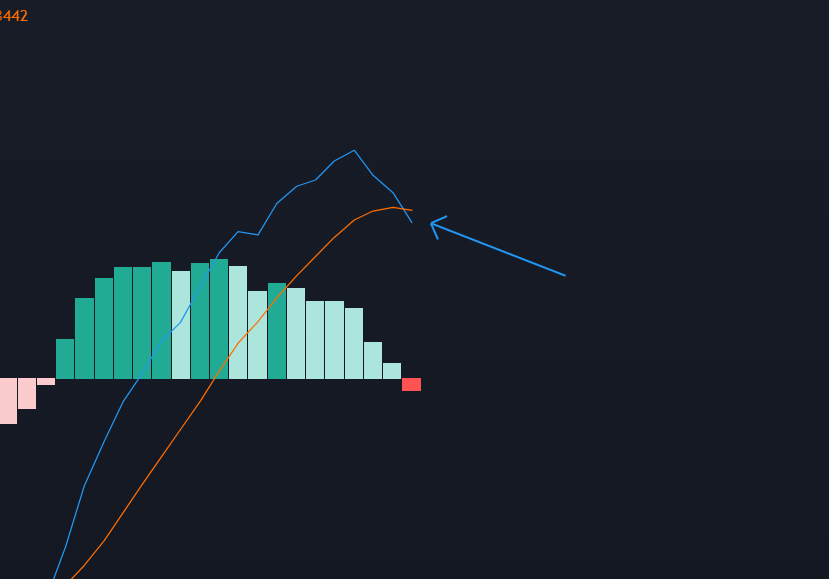
  1. Be sensitive to the momentum

Even in the absence of a clear reversal, a slowing in price momentum (sideways movement or stagnant trending movement) will lead MACD to pull away from its prior extremes and gravitate toward the zero lines. This could be used to warn traders of the shift in momentum and allows traders to reassess their positions according to their risk levels. 

LAST THOUGHTS

The MACD technical indicator is best used to identify changes in momentum and trend direction. This means that it is most efficient in spotting trend strength, assessing its momentum, and identifying changes in its trend.

This indicator should not be utilized in isolation but rather in combination with other technical and fundamental analysis techniques. Trading against the trend would give a lot of false signals, this is why excellent risk management must be observed when doing so. 


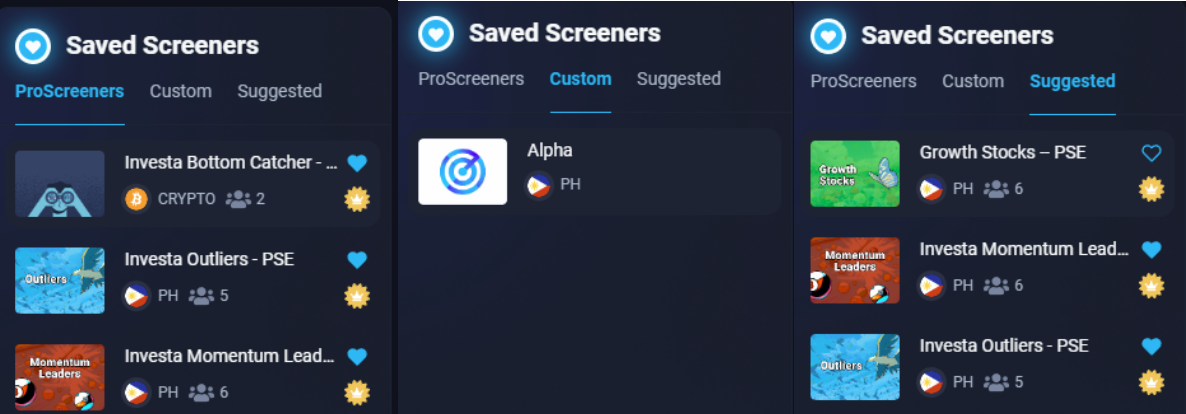
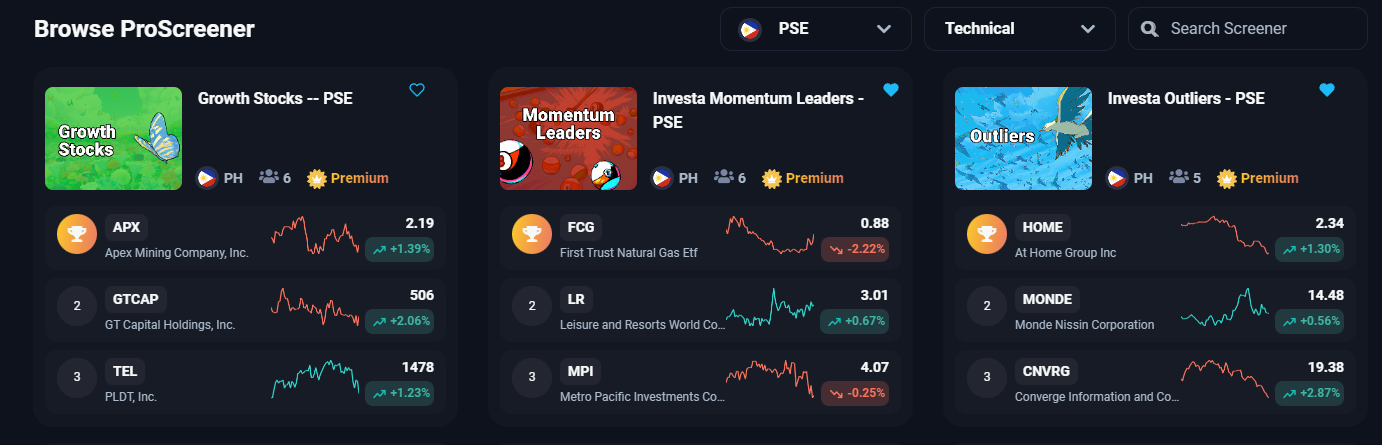
Got no time analyzing hundreds of stocks or cryptocurrencies in chart one at a time? We’ll make it easier for you with ProScreener!

Access your FREE 14-Day Free Trial today.

Categories
Latest Posts

Find the Best Opportunities in Seconds

The ProScreener was one of the original features we launched years ago. The goal we had was to cut the screen time of traders. With the ProScreener, traders can automatically filter the markets for assets that fit their trading systems. No matter if you focus on momentum trades or buying the dip, the ProScreener will help you find the best trades in seconds.

With the new iteration of the ProScreener, we decided to put more focus on making quality-of-life upgrades. We made it so that you save a lot more screen time – time that you can spend with your loved ones or with your hobbies.

Here’s a look at the new scenes you’ll experience with the recent update.

PROSCREENER HOMEPAGE

  • Easily load screener results straight from the homepage – no more need to load a new page!
  • Access different saved screeners and suggestions through a quick toggle on the sidebar

BUILT-IN SCREENERS

Our built-in screeners have been revised and revamped to better cater to your trading needs

Screeners that previously only covered 1 market have been replicated to cover the other markets as well

Here’s a full list of the screeners that we offer:

PREMIUM SCREENERS

  • Growth Stocks
  • Investa Bottom Catcher
  • Investa Dip Catcher
  • Investa Momentum Leaders
  • Investa Outliers
  • Investa Short-Term Pullbacks
  • Investa Short-Term Trend Follower
  • Investa Shorting Candidates

FREE SCREENERS

  • Positive YTD Performance – PSE
  • Positive YTD Performance – PSE
  • Undervalued Stocks – PSE
  • Uptrending Financial Stocks – PSE
  • Uptrending Holding Stocks – PSE
  • Uptrending Industrial Stocks – PSE
  • Uptrending Mining and Oil Stocks – PSE
  • Uptrending Property Stocks – PSE
  • Uptrending SME Stocks – PSE
  • Uptrending Services Stocks – PSE
  • Uptrending Cryptocurrencies

INVESTAWATCHER INTEGRATION

Add your picks straight to the InvestaWatcher

CUSTOM SCREENERS

Curating your own screeners is now easier with the new UX updates. Saving a newly created screener will make it accessible on the homepage. You can also easily access previously created screeners if you want to further tweak your parameters

TO WRAP UP

Hopefully, you’ll find the updates impactful to your everyday trading routines! As always, feel free to let us know your thoughts on how we can improve our services.

We’ve been creating a lot of updates and improvements to the platform recently. However, we’re not done yet. Our team is still dedicated to creating a positive impact for traders and investors alike. Stay tuned!

Categories
Latest Posts

Featured Trader of the Week: @myholdings

@myholdings takes the spot for this week’s featured trader! A member since 2021, our featured trader is currently seen actively navigating the markets and saw a potential breakout on $SMC wherein support and resistance (or S/R) were used to see a falling wedge pattern. Further confirmation of the downward price momentum slowing can be seen through the Relative Strength Index (or RSI) as well. 

With $SMC having multiple signs of a bullish direction, the stock had a successful breakout and has seen an increase of about 23% in the past week.


Let’s take a look at how @myholdings used this reversal pattern to his advantage.

@myholdings used S/R to detect $SMC’s falling wedge pattern. Its potential breakout can also be backed by the relatively low RSI. The post also indicates other helpful details such as added fundamental and technical analysis, which provides great help and additional insights. At the time of @myholdings’ post, $SMC is priced at the 94.60 level and was trying to break through the local resistance at the 97 level. With its current successful breakout, $SMC is now trading at around the 116 level and has seen an increase of about 23%. 

TECHNICALS OF THE TRADE


A falling wedge is a form of reversal pattern that happens when a stock’s price action continues lower, with the trend lines converging as the price approaches the bottom. This confluence of trend lines is interpreted as a bullish indicator, indicating that the stock is expected to reverse direction and move upwards. The falling wedge is a bullish pattern because it indicates that the downward momentum is decreasing and a possible upswing is brewing.

As we can see, patterns in stock trading are essential in technical analysis because they may assist traders and investors in identifying trends and making educated trading decisions. Traders can make accurate forecasts about future price changes by spotting patterns in prior price movements and planning their transactions appropriately. 

@myholdings paired this with a low RSI reading which suggests that the $SMC has been oversold and that the downward price momentum may be slowing. Traders and investors may interpret this as a potential buying opportunity and consider entering into a long position.

FUNDAMENTALS OF THE TRADE

The most recent post of San Miguel Brewery Inc. (SMB), the flagship beer business of San Miguel Corporation, indicated a 15 percent growth in net income to P16.2 billion from the P14.1 billion earned. SMB reported strong domestic results, with further relaxation of restrictions beginning at the end of March 2022, paving the way for the re-opening of on-premise outlets.

This was aided by efficient volume-generating initiatives and marketing campaigns implemented by its many brands across traditional and modern trade channels. As a result, overall domestic sales in 2022 reached P88.4 billion, up 19 percent from 2021.

SMB’s overseas businesses also continued to operate well, with greater volumes in the first nine months.

This was attributed to consistent volume gains in its Thailand, Indonesia, and Export operations, despite pandemic restrictions in the Hong Kong, South China, and Vietnam markets.

WHAT SHOULD BE MY NEXT MOVE

At the time of writing, $SMC is currently bumping on a resistance level around the 116 levels. Since the RSI is indicating overbought signals, a potential pullback may happen. It’s crucial to remember that pullbacks can lead to greater declines, so it is advised to utilize proper risk management techniques, such as setting stop-loss orders, to prevent possible losses.

Once again, KUDOS to @myholdings for being this week’s featured trader! Enjoy your 14-day InvestaPrime Access and continue to be an inspiration to the trading community.


Find your next big trade using INVESTAPRIME’S LEADERSHIP RANKING

No more need to spend countless hours scanning through multiple markets to find the strongest stocks or tokens. You can now easily find the outliers in the PSE, Crypto, Forex, Commodities and US markets. Get full real-time access by subscribing to InvestaPrime.

Categories
Latest Posts

Proof of Reserves: Trust by Means of Transparency

The rising popularity of the term “Proof of Reserves” can be attributed to the recent crash of FTX. This was due to the leverage and solvency concerns involving FTX-affiliated trading firm Alameda Research. 

Multiple experts say that it would have prevented the crash. This is because FTX would then be warier in how they utilize their assets. Customers would also then have the ability to withdraw gradually depending on how they are comfortable with FTX’s insolvency.

But what is Proof of Reserves? How critical would they be in today’s age of digital finances? How would it benefit me as a trader/investor? Let’s find out!

What is Proof of Reserves?

Proof of Reserves indicates an institution’s capability to always honor withdrawals from its platform. Cryptocurrency exchanges use this to establish that they have sufficient assets. This is used to cover the quantities of each coin guaranteed to its consumers. The investor community uses it as a method of ensuring that a trading platform has 1:1 backing across all digital assets. It serves as a tracker that audits active cryptocurrency exchanges for transparency on liquidity at a given moment.

Why is it important to know the status of an institution’s assets and its capability to honor withdrawals?

Because in doing so, confidence and transparency between the exchange and its users are fostered. Trust is critical in institutions/exchanges because it can help to build confidence in the markets and the financial system as a whole. This would lead to an increase in investments and economic growth. The consequences of distrust were the major catalyst in the fall of FTX. Lack of trust resulted in mass withdrawals. This was further even emphasized as CEO Bankman-Fried admitted that the company didn’t have sufficient assets in reserve to meet customer demand. 

How Proof of Reserves build user’s trust

Proof of Reserves allows exchanges and other various other financial products that are inside and outside the blockchain industry to prove solvency on a real-time basis. The users of the exchanges may then use the Proof of Reserves as an instrument to gauge how solvent institutions can be. Furthermore, evidence of reserves can aid in preventing fraud and other financial crimes. This is because it makes it difficult for organizations to misrepresent their financial position. Proof of Reserves builds users’ trust by allowing users to validate an exchange’s capability to serve them and how well and legit the exchange is utilizing their assets. 

Concerns revolving around Proof of Reserves

Indeed, Proof of Reserves is a step in the right direction. However, it may also provide customers with a false feeling of security. Concerns about it include the risk of data tampering, a lack of transparency, and the exchange retaining fractional reserves. Furthermore, there is a chance that the exchange will be hacked or go bankrupt, causing users to lose their funds. With this in mind, we must still always be vigilant in the exchanges we interact and invest with. Nevertheless, Proof of Reserves is certainly a factor that we need to consider in managing the risks of investing in a crypto exchange. 

How to track an exchange’s Proof of Reserve

Verifying Proof of Reserve can easily be done on CoinMarketCap. Exchanges that have made their reserve status public will feature a section under “Financial reserves,” which will offer a detailed analysis of their reserves if they are publicly available.

In summary, Proof of reserves is important to verify that a company has enough assets to satisfy its financial obligations. This is especially important in the context of cryptocurrency exchanges, where any form of transparency can assist in ensuring consumers that the exchange has enough cryptocurrency on hand to honor withdrawal requests. In addition, users may lose faith in the exchange and be less inclined to utilize its services if there is no verification of reserves, which might harm the exchange’s business. 

Proof of Reserves: Trust by means of Transparency – Proof of Reserves is a legitimate way of validating an institution’s capabilities. 


Find your next big trade using INVESTAPRIME’S LEADERSHIP RANKING

No more need to spend countless hours scanning through multiple markets to find the strongest stocks or tokens. You can now easily find the outliers in the PSE, Crypto, Forex, Commodities and US markets. Get full real-time access by subscribing to InvestaPrime.

Categories
Latest Posts

Featured Trader of the Week: @gandydancer

@gandydancer takes the spotlight for this week’s featured trader! 

As Lance Armstrong said, “knowledge is power, community is strength, and positive attitude is everything.” With his entertaining charts, insightful shared posts, and consistency in uplifting the community’s well-being, @gandydancer has proven himself to be a community member that fosters positivity, talent, and an overall sense of harmony within the Investa trading community. 

Truly deserving of this week’s feature! Let’s take a deeper look at @gandydancer as a member of the community.

COMMUNITY CHART ARTIST

@gandydancer is known for his “Chartoons” series, wherein he posts his rendition of charts with creative artistical twists to keep his followers engaged and entertained regardless of the state of the market. Doodling in charts may not be uncommon in the trading community, but @gandydancer’s consistent posts would keep you entertained with drawings ranging from fun doodles to mind-blowing illustrations that integrate the charts. Joining the community on early March 2020, his consistent postings and generally positive outlook earned him steadily increasing followers in the Investagrams social space. 

BEYOND THE ART

Besides his art posts, he is also seen to be sharing investing knowledge that is a great help to his fellow members of the community. It also encourages and fosters a culture of growth where people are encouraged to ask questions and learn from the input of their fellow members. 

He can also be seen commenting on posts, helping fellow community members, and even sharing posts that harbor knowledge and harmony in the community. 

He also makes sure to keep the community updated by constantly sharing relevant news that helps inform and educate people and the general public about current events and topics. Indeed, it is crucial to stay up to date on current events because it can help make educated decisions and take action on topics that matter to them. By doing so, he sparks insightful conversations that help attain multiple perspectives of other traders. This ensures that decisions that materialize from these conversations are more likely to be well-informed and practical.

OTHER CONTENT FROM @gandydancer

@gandydancer ups the ante on entertaining the community by establishing a new series of posts that revolve around comedic news and memes for the Filipino investing community. He can also be seen sharing inspirational quotes and experiences that promote not only a positive mindset but also makes sure to motivate the Investa trading community. 

In the end, what makes @gandydancer deserving of being our featured trader for this week are his entertaining content which makes sure to be relevant and bring people together, his way of fostering a culture of growth by always sharing learning experiences and knowledge, and his overall dedication in bringing value to the community by always making sure to help those who want to grow further, inspire fellow traders to strive for their goals, and delight the community with his entertaining posts and drawings. 

Once again, KUDOS to @gandydancer for being this week’s featured trader! Enjoy your 14-day InvestaPrime Access and continue to be an inspiration to the trading community.


Test the viability of your trading ideas and strategies through historical data to generate results and analyze risk with InvestaBacktest.

Manually practice, master, and backtest your strategy in the local and global markets.

Categories
Latest Posts

Backtesting the Golden Cross Signal

The golden cross is a widely known technical analysis pattern. It’s usually used as a signal that bulls are now in control of the long-term trend. The pattern is formed when the 50-day moving average crosses above the 200-day moving average. As the short-term average rises above the long-term average, the signal signifies that demand has come back into the market. 

Some use this pattern as a buy signal. Others use it as a confirmation of their overall market bias. This begs the question, how well does the golden cross signal?

WHY IS BACKTESTING IMPORTANT?

Traders often backtest their strategies to evaluate the performance of the signals used. By simulating the strategy on historical data, you can get an idea of how the strategy would have performed. You’ll also find insights into the strategy’s weaknesses as well as its strengths.

Keep in mind that for backtests to provide insightful results, they should be run through different market conditions and should have a substantial amount of trades. It should also be noted that backtests are not indicative of future results. Market dynamics are always changing, which is why there are too many factors to consider to run a perfect backtest, even with the help of automation. 

Nonetheless, backtests will still be able to provide insights to help guide your system in the right direction.

GOLDEN CROSS BACKTEST APPROACH

For this backtest, we covered the U.S. and PH stock markets. We chose various liquid stocks at random, with historical data starting from December 1, 2018.

The parameters for each trade are as follows:

  • Buy: At the close when the MA50 crosses above the MA200
  • Sell: At the close when the MA50 crosses below the MA200

For simplicity’s sake, we only recorded the edge and hit ratio.

RESULTS USING THE GOLDEN CROSS SIGNAL

Across roughly 40 trades, the signal achieved a hit rate of 47.22% and an edge ratio of 11.23. It was noticeable that a big factor in the unrealistic performance of the backtest came from just 3 trades. These three came from $TSLA, $AAPL, and $NIO

When taken out, however, the backtest would’ve still achieved a hit rate of 38.89% and an edge ratio of 3.78 – still very solid numbers. 

Another finding was that most losses didn’t stem from bear markets and downtrends. The signal usually lost money when stocks were in a sideways trend. 

INSIGHTS

Here are some key insights that can be taken from the test done:

  1. Holding on to strong market leaders can produce astounding results

Most of the best trades in the test conducted came from holding on to leaders in the strongest sectors. These trades usually lasted more than a year.

  1. A sideways market does more damage compared to a market that trends in whichever direction

Across the different trades conducted, it was noticeable that losses appeared more often in a sideways trend. 

  1. Stock selection is a very important aspect of trading

Being able to distinguish which stocks and sectors are set up for the most success can have a profound impact on a trading system’s performance. While the U.S. stock market as a whole was strong during the testing period, trades in key sectors produced results that greatly outperformed those in other sectors. 

LAST THOUGHTS

While the backtest produced stellar results, remember that there are still a lot of factors to take into account. There are still questions to be answered. How should the stock selection criteria be built? Given the volatility to be expected, what should be the ideal position sizing strategy to use? Is it alright for me to have long holding periods?

Forward testing or actual trading performance usually has worse results compared to backtests due to a wide variety of factorsEvenen the backtest conducted leaves a lot to be desired in terms of the number of trades tested and the stock selection criteria used. Certain tweaks could make it more realistic and could provide more insights. 

Stay tuned as we’ll aim to provide more valuable content moving forward.


Test the viability of your trading ideas and strategies through historical data to generate results and analyze risk with InvestaBacktest.

Manually practice, master, and backtest your strategy in the local and global markets.

Categories
Latest Posts

Featured Trader of the Week: @shadowshammgod

Phantom, a.k.a @shadowshammgod, takes the spotlight for this week’s featured trader as he shared his chart for a potential breakout of $PSE:BALAI using simple support and resistances paired with the 50 EMA.

Simplicity is a key principle in trading with technical analysis. Technical analysis aims to identify trends and patterns in financial markets, but this can be a complex task given the vast amount of data available. By keeping his analysis simple,  @shadowshammgod was able to see the overall picture and spot a potential breakout that could hit and retest the higher resistance of $PSE:BALAI in a one-day timeframe. 

Let’s take a look at how @shadowshammgod uses this to his advantage.

@shadowshammgod used S/R (or support and resistance) to spot $PSE:BALAI about to break out and flip its previous resistance at the 0.6000 level. Still using S/R, he identified the next resistance at the 0.7000 level, where the momentum of the breakout could die down. $PSE:BALAI broke out the same day and four days later went on to hit the 0.70 resistance and peak at 0.71, resulting in an increase of around 16%. 

TECHNICALS OF THE TRADE

After its downtrend since August of last year, $PSE:BALAI has been ranging sideways over the following months after. Since November of last year, the 0.6100 level has served as a strong resistance, denying breakouts over four times until finally being flipped this past January 10, 2023. 

Alongside the use of proper S/R, @shadowshammgod also utilized the 50-day EMA, which is significant because it may be used to identify major levels of support and resistance, as well as to show the current trend’s direction. With no additional indicators required, he was able to execute and profit from the trade.

FUNDAMENTALS OF THE TRADE

In order to reach its goal of 130 stores by the end of 2023, Balai Ni Fruitas Inc., the company that owns the Balai Pandesal brand, announced its plan to start an aggressive expansion strategy.

The business intends to extend this to 200 locations by the end of 2026, according to Calvin Chua, director, and financial adviser at Fruitas Holdings Inc., the company’s publicly traded parent company.

The ongoing store network expansion of the Balai Pandesal brand has contributed to the significant increase in its revenues; As of October 2022, BALAI currently has 91 active stores nationwide, of which 43 stores are Balai Pandesal, 39 are Buko Ni Fruitas stores, and 9 are Fruitas House of Desserts stores.

WHAT SHOULD BE MY NEXT MOVE

Since the $PSE:BALAI is still currently ranging and is now hovering around the 0.6000 level again, it’s advisable to wait and see if the level would successfully flip and serve as the new support or if it would continue to decline. If it does continue to decline, the previous breakout would only be a false breakout and would mean that there was a lack of buying or selling momentum or there has been a sudden change in market sentiment.

Once again, KUDOS to @shadowshammgod for being this week’s featured trader! Enjoy your 14-day InvestaPrime Access and continue to be an inspiration to the trading community.


Subscribe to our Newsletter

Join our mailing list for investing tips and stock market advice
to help you reach your first million.

You have Successfully Subscribed!