This week’s featured trader is @chunzlhaivestor, who captured the spotlight by employing various indicators to analyze the trend of $URC and predict its price rise.
Using multiple indicators while trading is critical, as no single indicator can offer a complete picture of the market. Each indicator has its own set of strengths and limitations, and by combining them, traders may gain a more thorough perspective of the market and make more educated trading decisions.
Let’s take a look at what indicators he used and how he effectively used them.
ANALYSIS FROM @CHUNZLHAIVESTOR

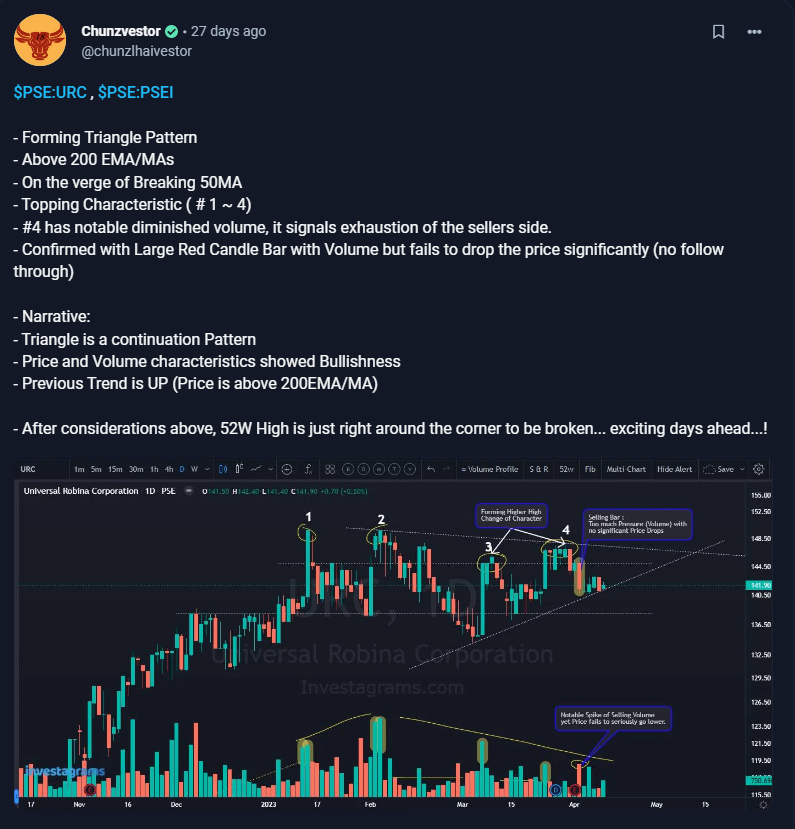
As stated in @chunzlhaivestor’s post, he first noticed that $URC forms a triangle pattern. The triangle pattern is generally considered a continuation pattern, meaning that it often appears in the middle of an existing trend and can signal that the trend will likely continue in the same direction after the breakout occurs. This is also stated by @chunzlhaivestor in his narrative. However, it is essential to note that it can also be a reversal pattern if the breakout occurs in the opposite direction of the previous trend.
Fortunately, @chunzlhaivestor also used other indicators in confluence with each other to solidify his sentiments on $URC. He then focused on the 200 and 50 moving averages, respectively. Both moving averages show signs of bullish movement for the stock. Lastly, his last indicator was volume, which showed exhaustion on the seller’s side, as stated in his post.
At the time of his post, $URC was trading at around 141.90. The stock would then accumulate in price and eventually peak 24 days later at the 156.50 level for an increase of about 10%
TECHNICALS OF THE TRADE
The three leading indicators that @chunzlhaivestor utilized in navigating $URC were chart patterns, moving averages, and volume.
A triangle pattern in stocks is a technical chart pattern formed when a stock’s price movements are bounded by two converging trend lines, creating a triangle shape. This pattern occurs when the highs and lows of the stock’s price become narrower over time and converge toward a single point. The triangle pattern can be either a symmetrical triangle, ascending triangle, or descending triangle, depending on the shape of the trend lines. In his trade, the chart of $URC shows a symmetrical triangle. A symmetrical triangle occurs when the two trend lines converge at equal angles, indicating a period of consolidation before a potential breakout in either direction.
He then used 200 and 50 moving averages. He stated in his post that $URC was above the 200 moving average. If a stock trades above its 200-day moving average, it is generally considered an uptrend and can be seen as a bullish signal. The 200-day moving average is a widely used technical indicator that represents the average price of a stock over the past 200 trading days, or roughly one year of trading.
He also mentioned that the 50-day moving average was on the verge of breaking. The 50-day moving average is a widely used technical indicator that represents the average price of a stock over the past 50 trading days, or roughly 2.5 months of trading. If a stock is on the verge of breaking its 50-day moving average, it may signal that it is experiencing a change in trend or momentum. When a stock trades above its 50-day moving average, it indicates it is in an uptrend and may continue to rise shortly.
Lastly, he utilized volume to determine the exhaustion of the seller’s side due to the notable diminishing volume. Also highlighted in his chart is how the price could have gone higher despite the notable spike in selling volume.
FUNDAMENTALS OF THE TRADE
Universal Robina Corp. (URC), a food and beverage company led by Gokongwei, reported that its profit remained unchanged at P3.6 billion during the first quarter of 2023, despite sustained gains in revenue as a result of solid demand.
According to a statement by URC President Irwin Lee, the company is pleased to have continued its strong performance into the first quarter of 2023, despite inflationary pressures on consumer demand and ongoing input cost volatility. URC, part of the Gokongwei family’s JG Summit Holdings conglomerate, reported an 11% increase in sales from January to March 2023, amounting to nearly P40 billion, with all businesses contributing to the strong growth. Additionally, the company’s operating income grew by 15% to P4.7 billion during the same period.
URC stated that its margins had expanded compared to last year and last quarter, benefiting from the full-year impact of pricing moves made in 2022 and optimization initiatives to manage operating expenses. During the quarter, URC’s domestic and international branded consumer foods group (excluding packaging) generated P26.9 billion in sales. Philippine branded food revenues increased 6% to P18.1 billion, with March sales reaching an all-time high. International branded food sales also rose 13% to P8.9 billion, with strong double-digit growth rates in Vietnam, Malaysia, and Myanmar.
Furthermore, agroindustrial and commodities sales reached P12.4 billion, up 20% due to increased sugar and renewables sales. The unit also benefited from higher selling prices and strong feed sales. URC’s President Irwin Lee expressed confidence in the company’s momentum, stating, “We believe that with the strength of our brands and continuous improvements in our operations, we will be able to sustain this momentum.”
WHAT SHOULD BE YOUR NEXT MOVE

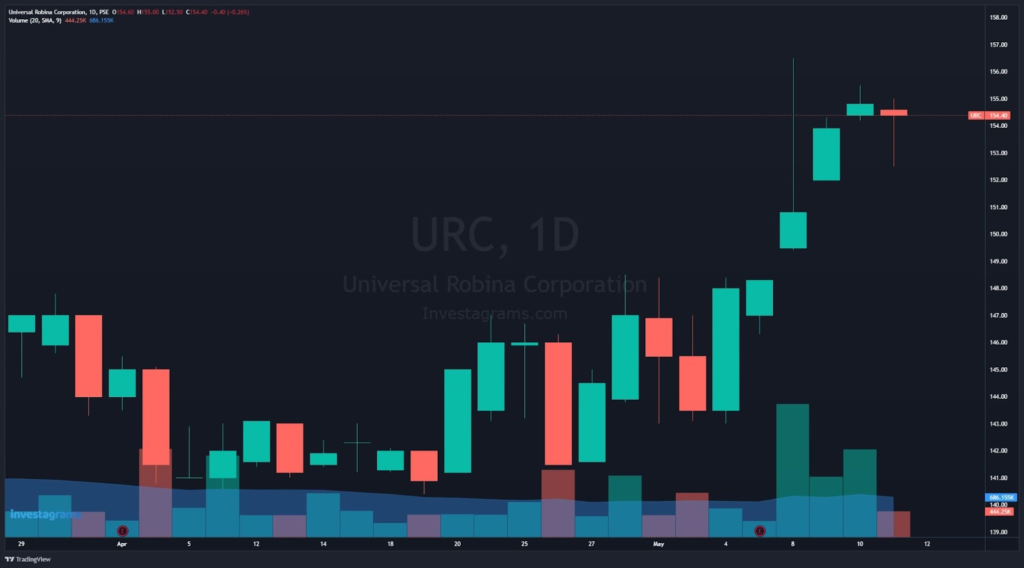
At the time of writing, $URC is currently trading at the 154.40 level. It is currently ranging within these levels as it recently surged in price. When a stock ranges, it moves within a specific price range with no clear trend. This can occur after a price surge or during a consolidation period. In this situation, it is essential to analyze the stock’s chart and look for critical support and resistance levels within the range. Determining if the range would act as news support or a new local resistance is crucial. If the stock is holding a solid support level within the range, it may be an excellent opportunity to consider buying it as it may be poised to move higher. On the other hand, if the stock is repeatedly facing resistance at a certain level, it may be an excellent opportunity to sell or consider shorting the stock as it may be poised to move lower.
Once again, KUDOS to @chunzlhaivestor for being this week’s featured trader! Enjoy your 14-day InvestaPrime Access, and continue to be an inspiration to the trading community.
Easily track your PSE and Crypto portfolio on Investagrams for FREE!
Try it today: https://invs.st/PortfolioDaily