Like many others, high school was a time when I spent a lot of hours playing video games with friends. In true Filipino fashion, DotA was always our video game of choice. We’d spend countless hours trying to grind our way through the ranks.
Then, college came and it was time to think about the future. For me, that was when I started trading stocks. For a good 3 years, I gave up my hobbies and got addicted to the market. While I was lucky to be in a bull market during the start, the bear market quickly humbled me. After putting in a lot of effort, I still couldn’t find out why I wasn’t improving.
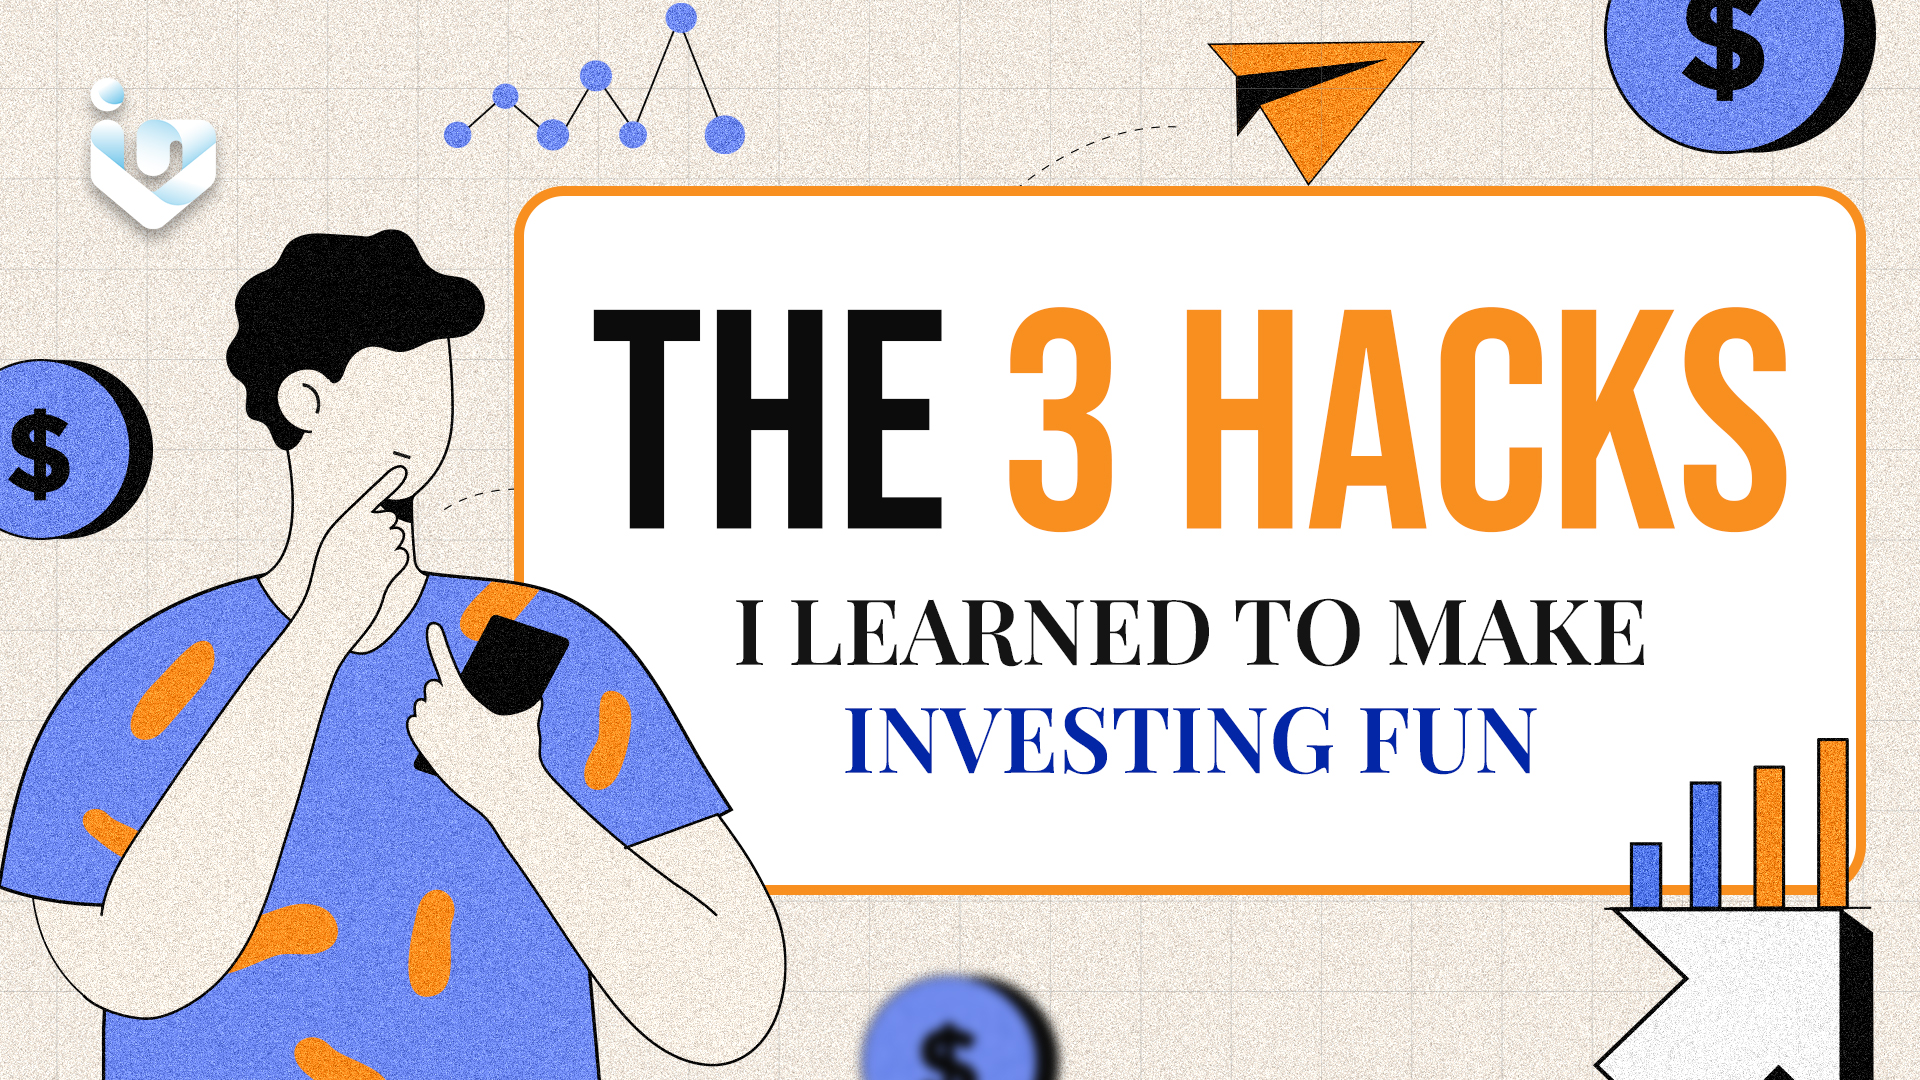
Summer came, it was still a bear market and I had no classes to attend. So, I decided to play DotA again. That’s when I realized there are a lot of similarities between trading and a video game. After a while, I realized I was learning valuable lessons that I can translate to trading.
Here are some of the biggest takeaways I got.
Focus on the things you can control
“The more time you spend complaining about what you deserve, the less time you have to focus on what you can create.”
James Clear
In the chaos of random matchmaking, everyone complains about something. Yet, only a few focus on what they have control over. DotA is a video game where you play in teams of 5, making it easy to put the blame on someone else. But, the matter of fact is higher ranked players often win games by mainly focusing on what they can do to win.
Likewise, you won’t always be in a favorable position when trading the markets. A lot of people complain about not having accurate insider information. Some blame the people behind pump and dumps. Others think that the top traders have the “holy grail” of trading, which is why they can’t seem to profit from the market. The truth is, the market is an even playing field. Everyone is subject to the same black swans and market crashes. The difference lies in how strongly you hold yourself accountable for your performance.
Figure out the things you can control and find a way to use them to your advantage.
Pick your spots

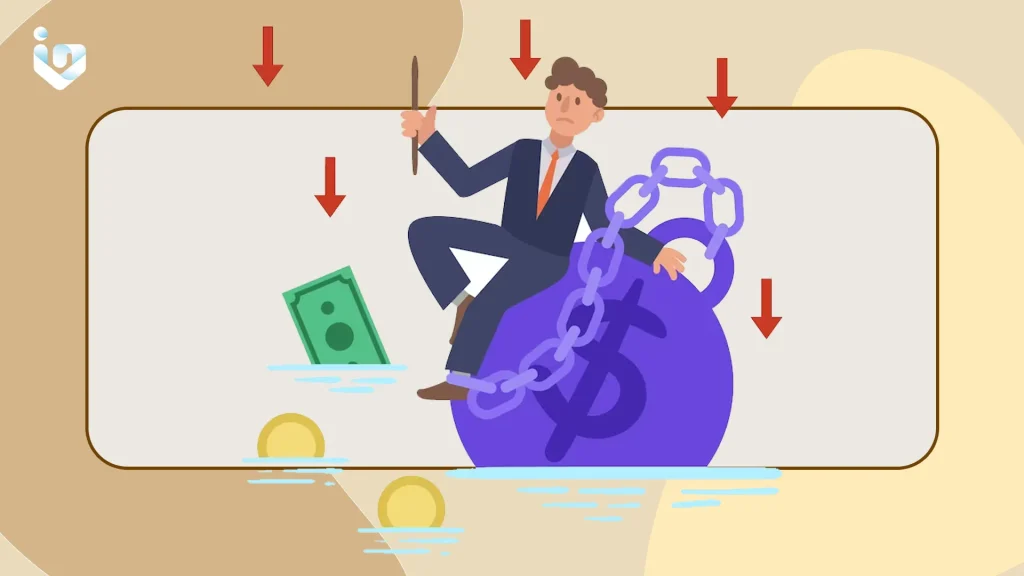
Early on, I had the problem of having a very low win rate. I’d try to make trades with a 3, 4, or even a 5 risk-to-reward ratio. But, I wasn’t converting on a substantial portion of those trades. I read in books and articles that traders often did have win rates below 50%, so I thought this was just a losing streak on my end – until the string of losses eventually ate up a big portion of my portfolio.
As I tried playing DotA again, I realized that risk-to-reward ratios are also present in the video game. While some plays are risky, winning on those bets could easily turn the tide. The key was picking your spots. Trying to balance out the chances of winning an engagement with the risk-to-reward of the idea became a skill I learned to help me improve. Unsurprisingly, I figured that the concept can be applied to trading as well.
Is the market bullish or bearish? Does the stock have any bulging red flags? Are there other factors I need to consider? Trying to stack the probabilities in my favor has been a big help in winning more trades and capitalizing on solid risk-to-reward opportunities.
Stay up to date with the latest changes

Unlike other video games, DotA constantly gets updated. Even the most minor of changes can often dictate big changes to the most effective tactic available (meta). It alters what decisions become suboptimal and which ones become the best course of action. Failing to stay in the know often leads to worse performance.
Likewise, being unaware of changes in the market can have an impact on how you trade. Changes in the Fed’s stance, the USDPHP’s trend, and what industries are currently the strongest are all important factors you need to stay updated on. Else, you might be caught off guard when trends change or be unprepared once big opportunities come.
There will always be losses – focus on the bigger picture
As in any endeavor, losses will always occur no matter how good you get. While they may be hard to accept, losing is a natural part of the learning process. Especially in trading, losses can help set you up to be better. Make mistakes, learn how others handle the same situations, and apply your solutions.
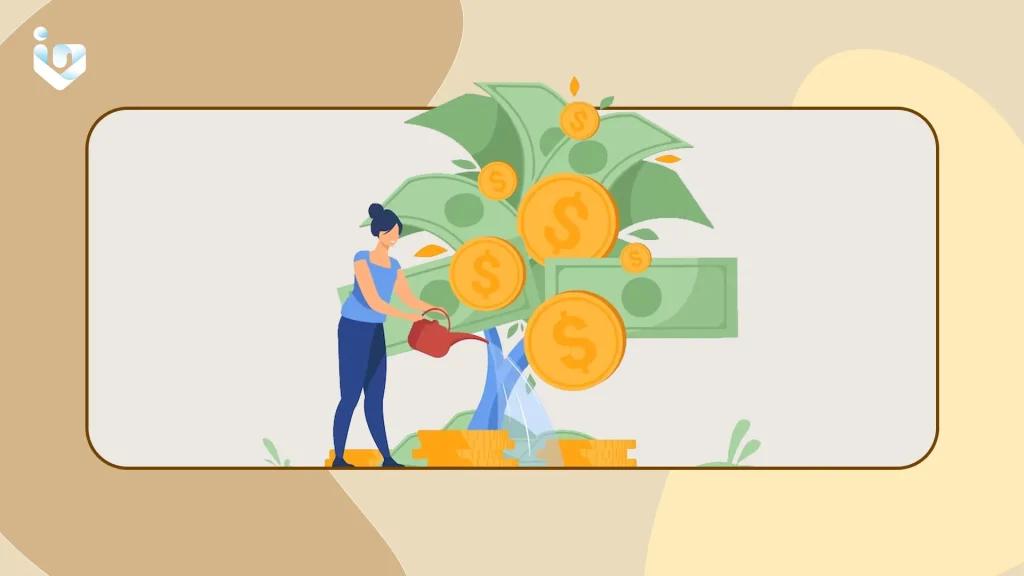
Just remember to keep track of your progress, and keep in mind that you’re in this for the long run.