Want to bag the Next Gen Money? Fret not as the Investa Summit 2021 will launch this September 28, 2021 to show you the new earning opportunities and help you maximize your profits in Stock Market, Cryptocurrency, NFTs, and Global Markets! We have invited top experts in the finance industry to give you valuable insights and tactics to help you achieve financial freedom.
Now in its 5th year, Investa Summit has gathered esteemed speakers both locally and globally who have truly mastered the craft. We will be giving you the chance to learn straight from:
Javi Medina, Managing Director of Buhawi Investment Management;
Edmund Lee, President and CEO of Caylum Trading Institute;
Julian Tarrobago, Chief Investment Officer of Unionbank;
George Asibal, the founder and CEO of Zeefreaks tribe;
Jonathan Lou Reyes, a decade trader in the forex market from XM;
Lawrence Lee, President and CEO of CTS Global;
Michael Enriquez, President and Chief Investments Officer of Sun Life;
Matt Cabangon, the President of AAA Equities;
Marvin Fausto, President and CIO of COL Investment Management;
Luis Buenaventura II, CEO of BloomX and a renowned author;
Jem Francisco, a mentor of more than 3000 students in CI Program;
Marso, a successful full-time NFT Artist;
Aaron Ramos of MagnusTV, an NFT game enthusiast; and
Christian Silverio, Investa’s very own Resident Trader
We are also honored to have in our ALL-STAR speaker roster these notable international traders & finance figures:
Tom Basso, Market Wizard, the former CEO of the Trendstat Capital Management, Inc.;
Michael Covel, the author behind the international bestseller book titled TurtleTrader;
George Tkaczuk, US investing champion of 2020;
Mark Ritchie II, featured in the notable Momentum Masters book;
Matt Caruso, Behaviour finance expert and top 4 in US Investing Championship;
Louise Bedford also known as the ‘Candlestick Queen’ of Australia; and
Colin Goltra, the director of Binance in Southeast Asia.
“We’ve always wanted to educate fellow Filipinos in a holistic manner and this year, we are progressing towards a unique learning experience for everyone,” Joanne Marquez, one of the project heads for this event, said.
According to Marquez, this event is going to be an exciting Summit for all traders/investors out there because this will bring together a rare mix of speakers who are market wizards, professional and institutional traders in their field, and those who have actually changed their lives through trading the stock market (local and globally), Cryptos, NFTs and a lot more – a rare opportunity that can take your skills to a higher level.
Investa Summit 2021 is organized by Investa, founded by three Filipino millennials namely JC Bisnar, CEO; and Airwyn Tin, CTO in 2015. Investa is the leading social-financial platform and mobile app in the Philippines that provides virtual stock market trading, analytical tools, market education, and a social network to empower traders and investors of all levels. The dream is to increase the investing population of the Philippines to 10 Million Filipinos — and Investa Summit 2021 is just one step towards that.
This event is truly beyond stock market trading as it will help you step foot in the various global and new markets and teach you how to maximize potential profits from it. The basic ticket can be purchased for as low as P1,999.
We hope to see everyone learn and level up from this exciting event!
Trading the financial markets is an endeavor that can bring you one step closer to prosperity. If you want to know yourself better, then you should try trading. How is that the case you ask? It is because the act of trading itself exposes the trader to an environment where adverse psychological circumstances exist.
A seasoned trader may seem lax in terms of his emotions, for professional trading requires the right state of mind to produce consistent results. Also, trading teaches us valuable life skills such as practicing patience and caution that ultimately enables us to accept the fact that outside the realm of the financial markets, anything can happen. A trader understands that this business is a long-term process before achieving financial freedom.
Participating in various financial markets also teaches the individual the essence of time. Professional trading also requires hard work from the individual. It is often mistaken that traders only work during market hours; however, the said market participant also bears the responsibility of journaling, screening, and assessing their trade prospects during cold state hours. In a nutshell, traders are adept at managing their time wisely.
Despite that trading is an endeavor that involves 80% psychology and 20% methodology, it is still ideal to adhere to be a student of the markets. Continuous learning is imperative in order to succeed in this game. Being exposed to the uncertainty involved in the markets, the trader then puts a conscious effort to learn new things every day.
The trader also values being responsible for each of their actions towards their trading account. Given that it is solely the trader who executes the orders. Therefore, he is accountable for his performance as a market participant.
Lastly, this does not occur to everyone, but a trader that is exposed in the markets may develop their love for the country. In a sense that this individual realizes that his duty is to help people in the form of teaching what they know to the public.
In the US Stock Market, traders and investors all over the world are always looking forward to the earnings season. It is an important period for traders and investors since publicly listed companies release their earnings report. It is announced quarterly.
The Earnings Season typically commences in January, April, July, and October. Although keep in mind that not all companies release their earnings at those dates, there are instances that some firms release between those dates since it ultimately depends on the given company’s quarter ends.
This period is crucial for a market participant as these earnings could either result in a gap up or gap down in price, depending on the quality of the report. It’s no stranger for traders and investors in the US Stock Market to experience these wild swings during the earnings season.
According to Mark Minervini, one of the best traders in the world, the best way to approach the earnings season, assuming that you own shares of a stock before its earnings release, is to simply sell all of your position if you do not have a profit cushion in the first place. If you have at least a 15-30% profit cushion, then you may opt to hold into earnings.
If for instance, you bought a stock at the long side, then you sold it before earnings, then the next day it gapped up, just move on and assess whether an opportunity represents itself. You can always buyback a stock whenever possible. You do not want any surprises. It is truly difficult to anticipate it, given the fact that a gap up or gap down could happen.
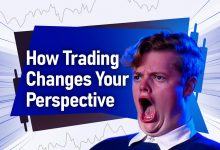
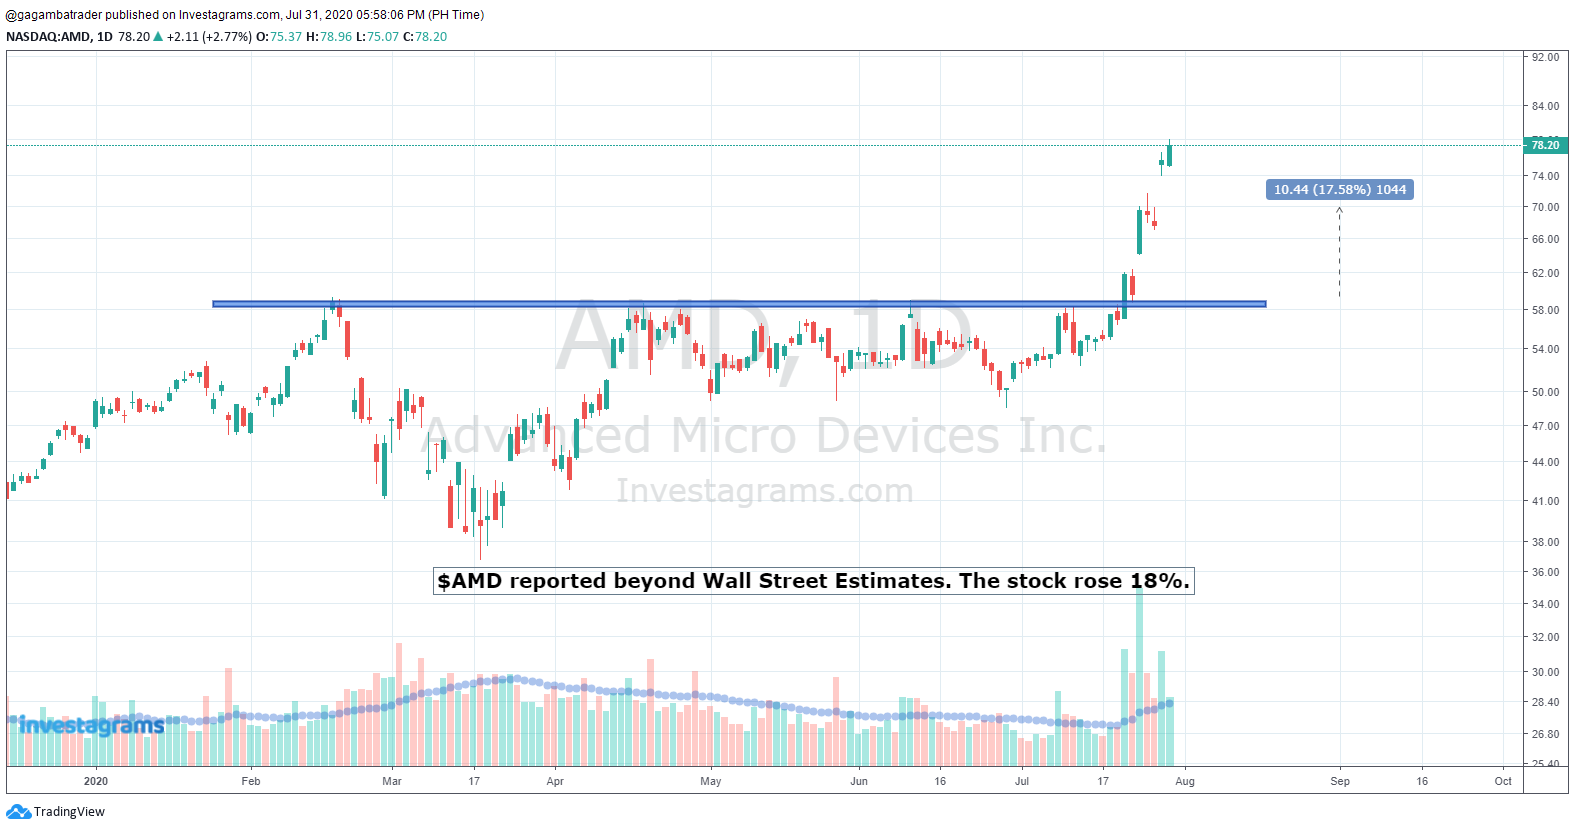
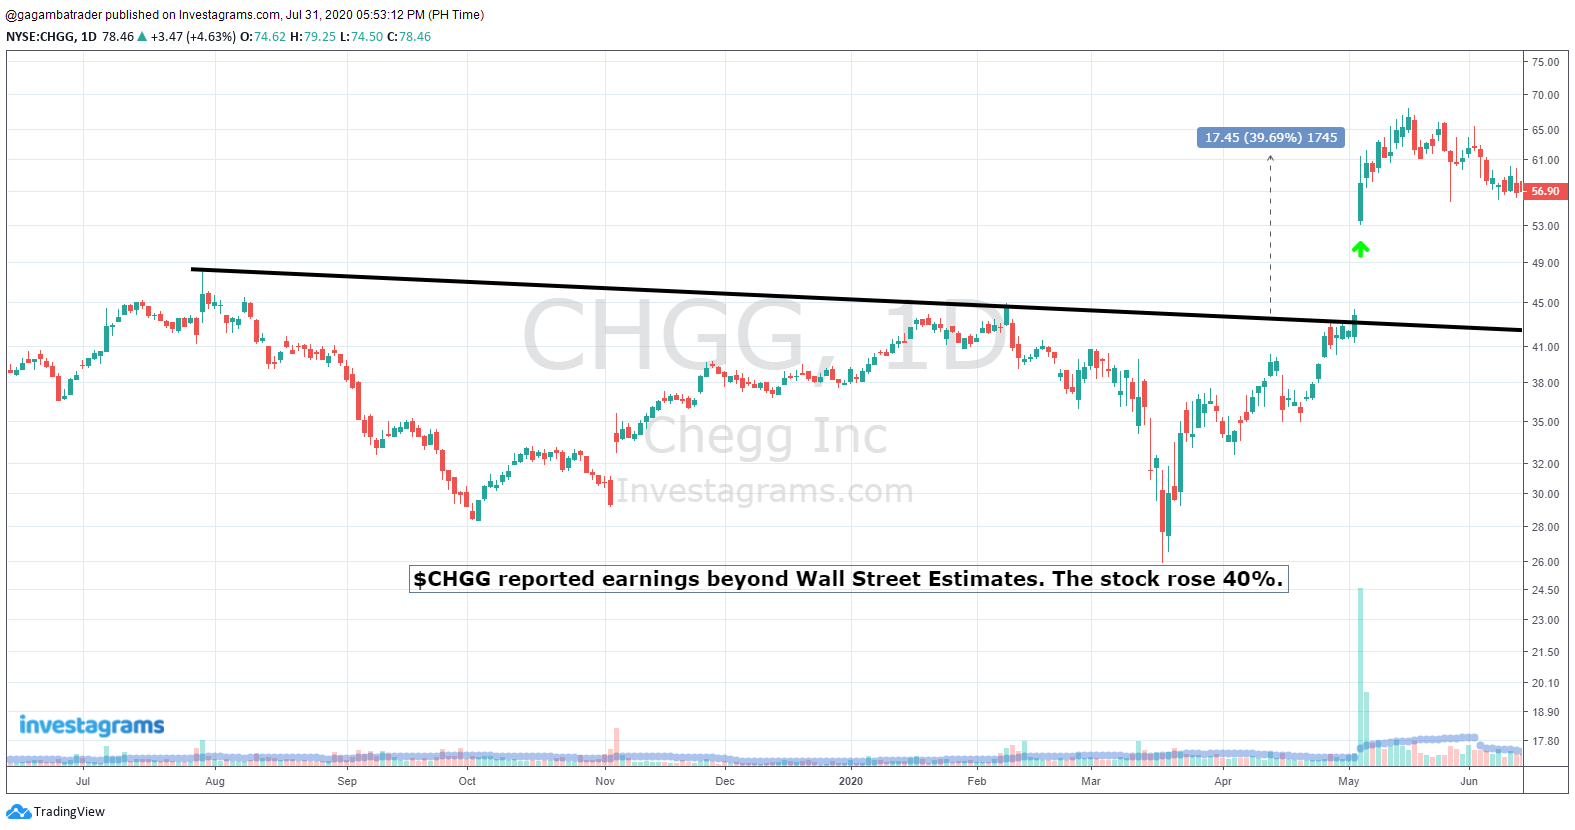
Here are some examples of stocks after earnings season:
Figure 1. $AMD Chart
Figure 2. $CHGG Chart
Figure 3. $TWLO Chart
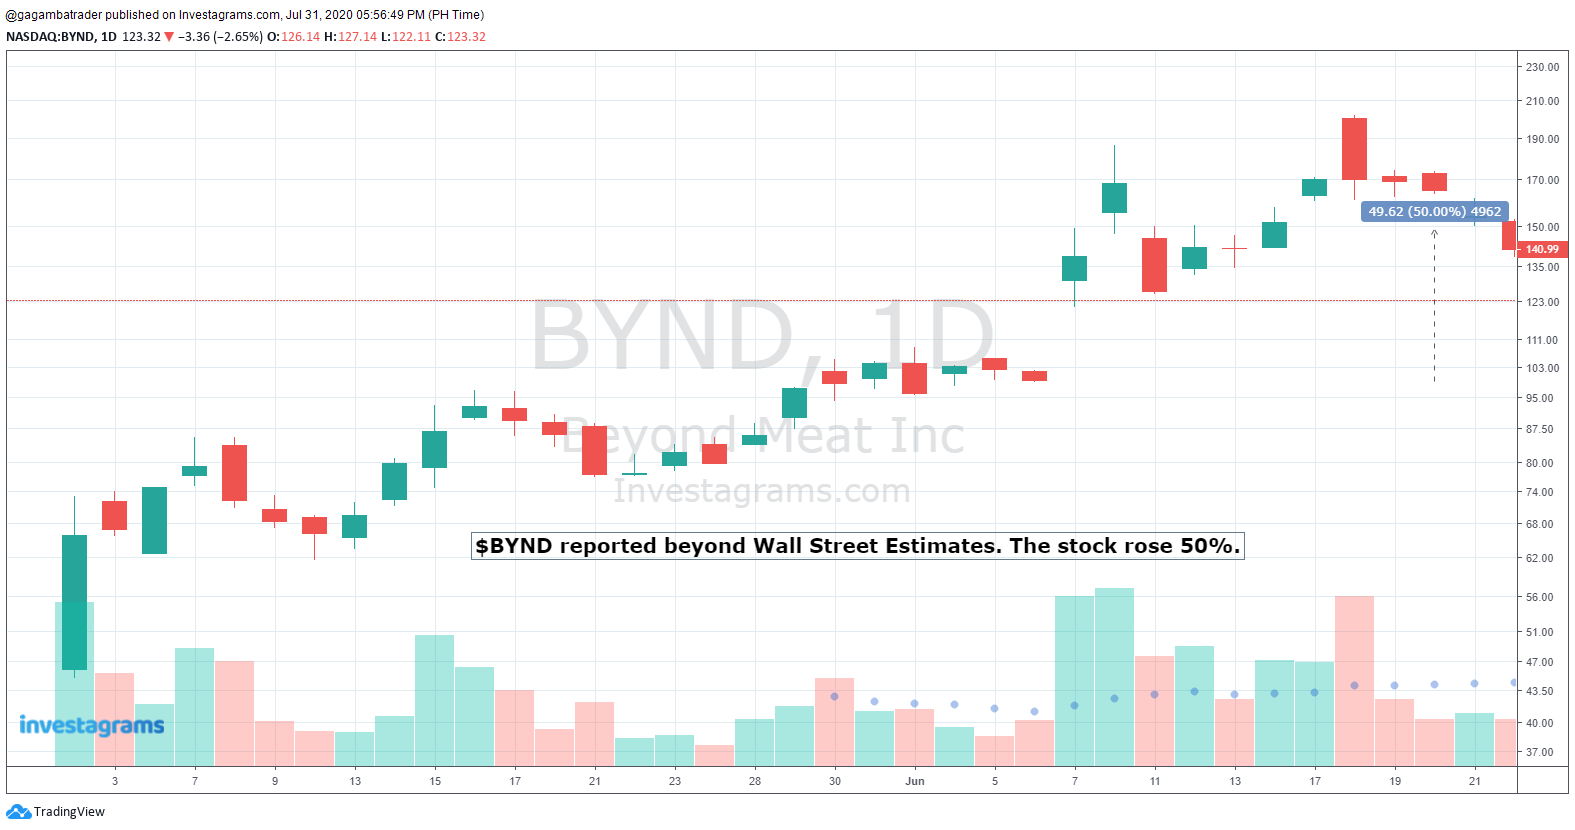
Figure 4. $BYND Chart
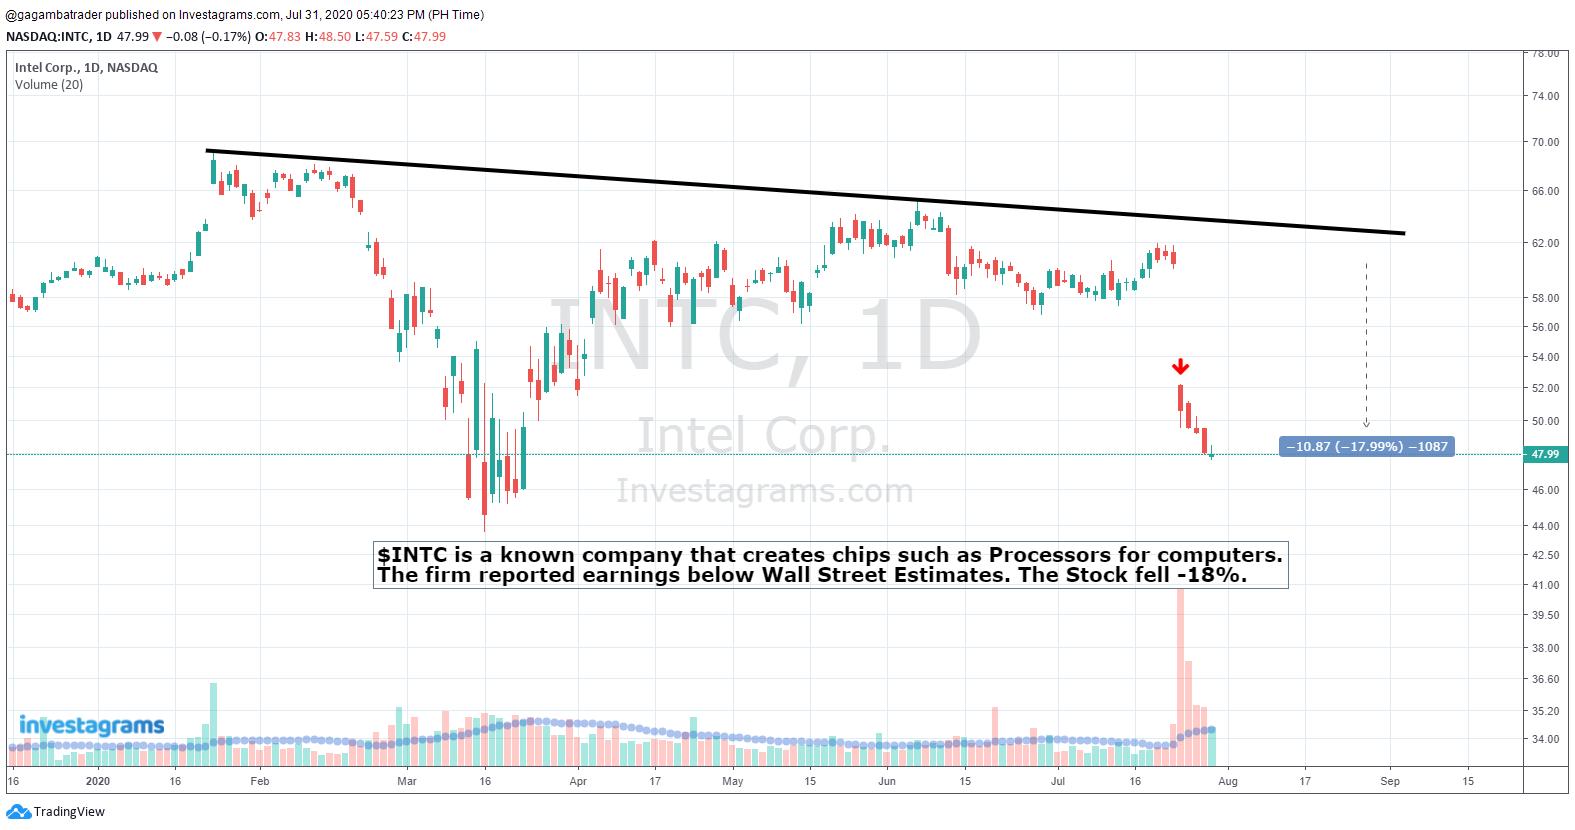
Figure 5. $INTC Chart
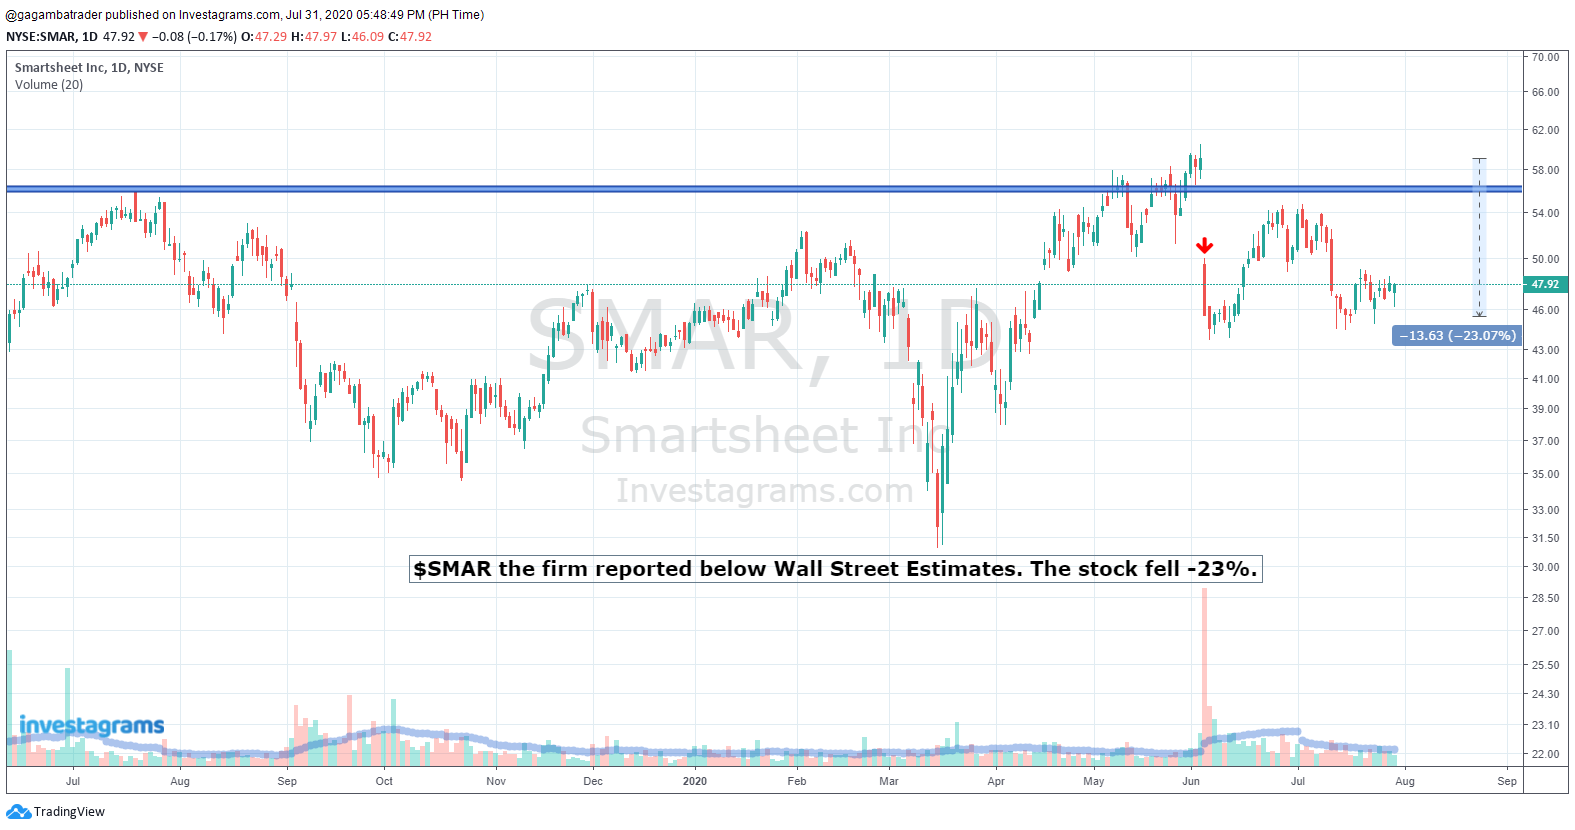
Figure 6. $SMAR Chart
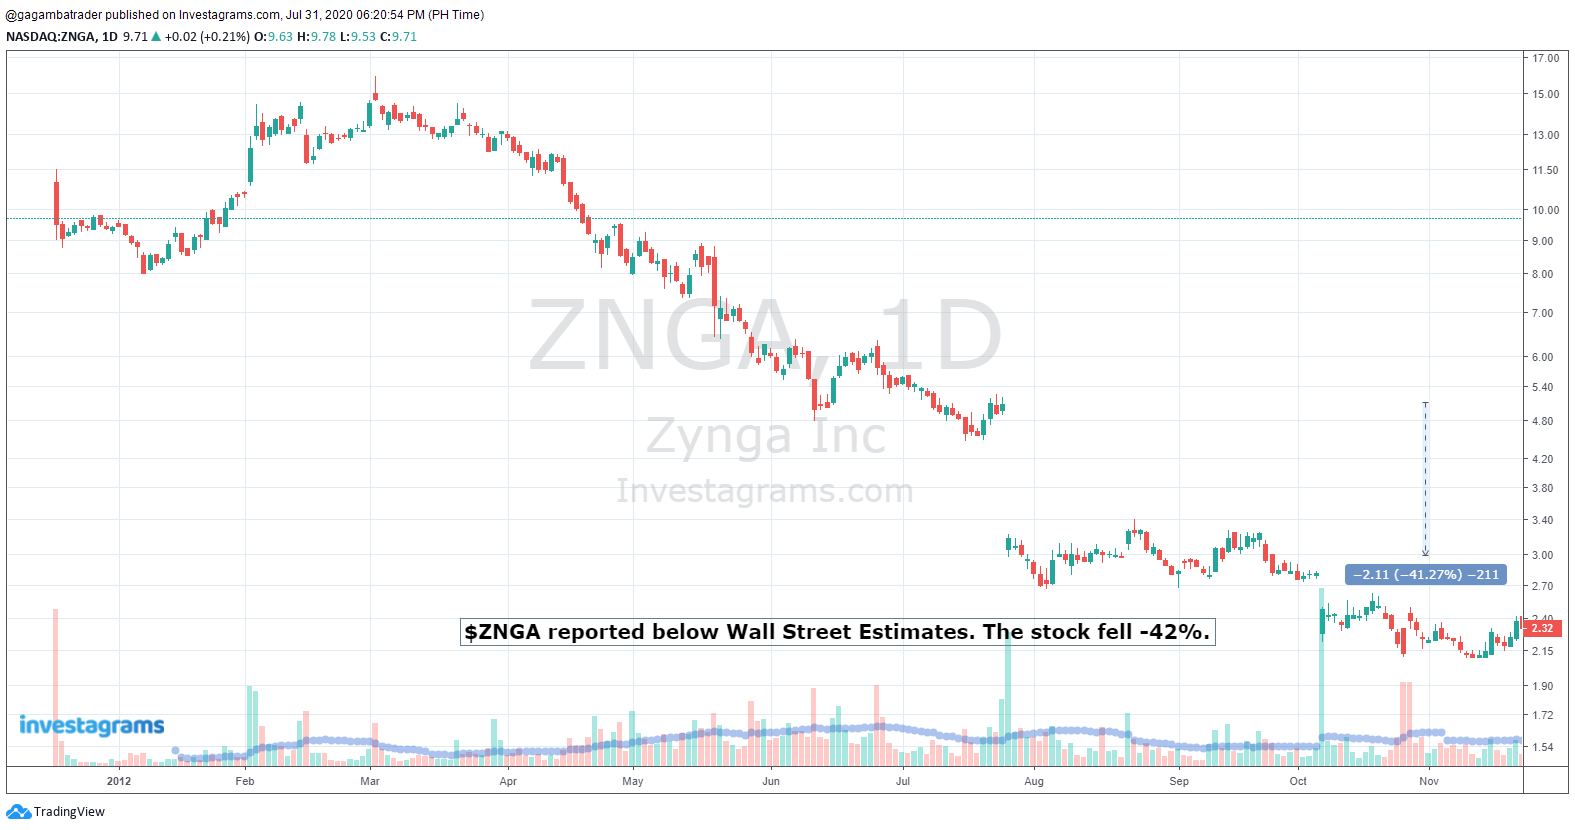
Figure 7. $ZNGA Chart
As you can see, this does not happen in our local market. It is critical for a trader or investor who participates in the US Stock Market to be keen with the earnings season. It is a must to be prepared for occurrences like this. Per Mark Douglas, anything can happen, and we cannot influence what the stock price will do next.
If you are working full time, becoming a trader is quite a challenge.
Do you consistently fail to sell at your set stop-loss because you were doing something outside the market? Have you missed on your reversal and bounce plays many times already? Are you always not able to catch up with the latest news and disclosures?
Most part-time stock traders in the country don’t have the luxury to monitor their positions while they are working on their day jobs. On the other hand, students who also trade stocks need most of their attention directed at their subjects and professors while the market is open. People on vacation also share the same difficulty as they can’t have their eyes glued on their phones or monitors during market hours. Because of these reasons, we might miss out rapid changes that take place during the opening hours of the market.
Every second counts for us traders and having an alert system for stocks will help us save time and money as this will allow us to respond to any price movements as they happen real-time. Given that almost all stockbrokers in the country do not feature stop-loss orders, this would be a godsend to those traders who are dealing with cutting prices or stop-losses. We need not to stare at the glaring screens of our electronic gadgets every minute just to be able to catch up with price movements.
Since 2016, the InvestaWatcher has helped countless of local retail traders with their trading executions. No longer is it an excuse to miss out on a breakout play that could’ve netted you 10% plus gains in one day because you were too busy with something.
Here are the advantages of having InvestaWatcher as part of your trading journey:
Pick 30 stocks to add to your watchlist
Set up your entry, target, and cut loss prices
Add short notes to remind you of your trading decisions
Remain updated with the important news of your stock picks such as corporate news, announcements (for example – mergers and acquisition, buyback, etc.), quarter and annual results
Choose how you want to get your alerts — via Investa Platform, FB Messenger, SMS, or Email
Get price and news alerts in real-time
Steps to add a stock to the InvestaWatcher
Option 1. If you’re using the InvestaChart and you want to add the current stock that you’re looking at:
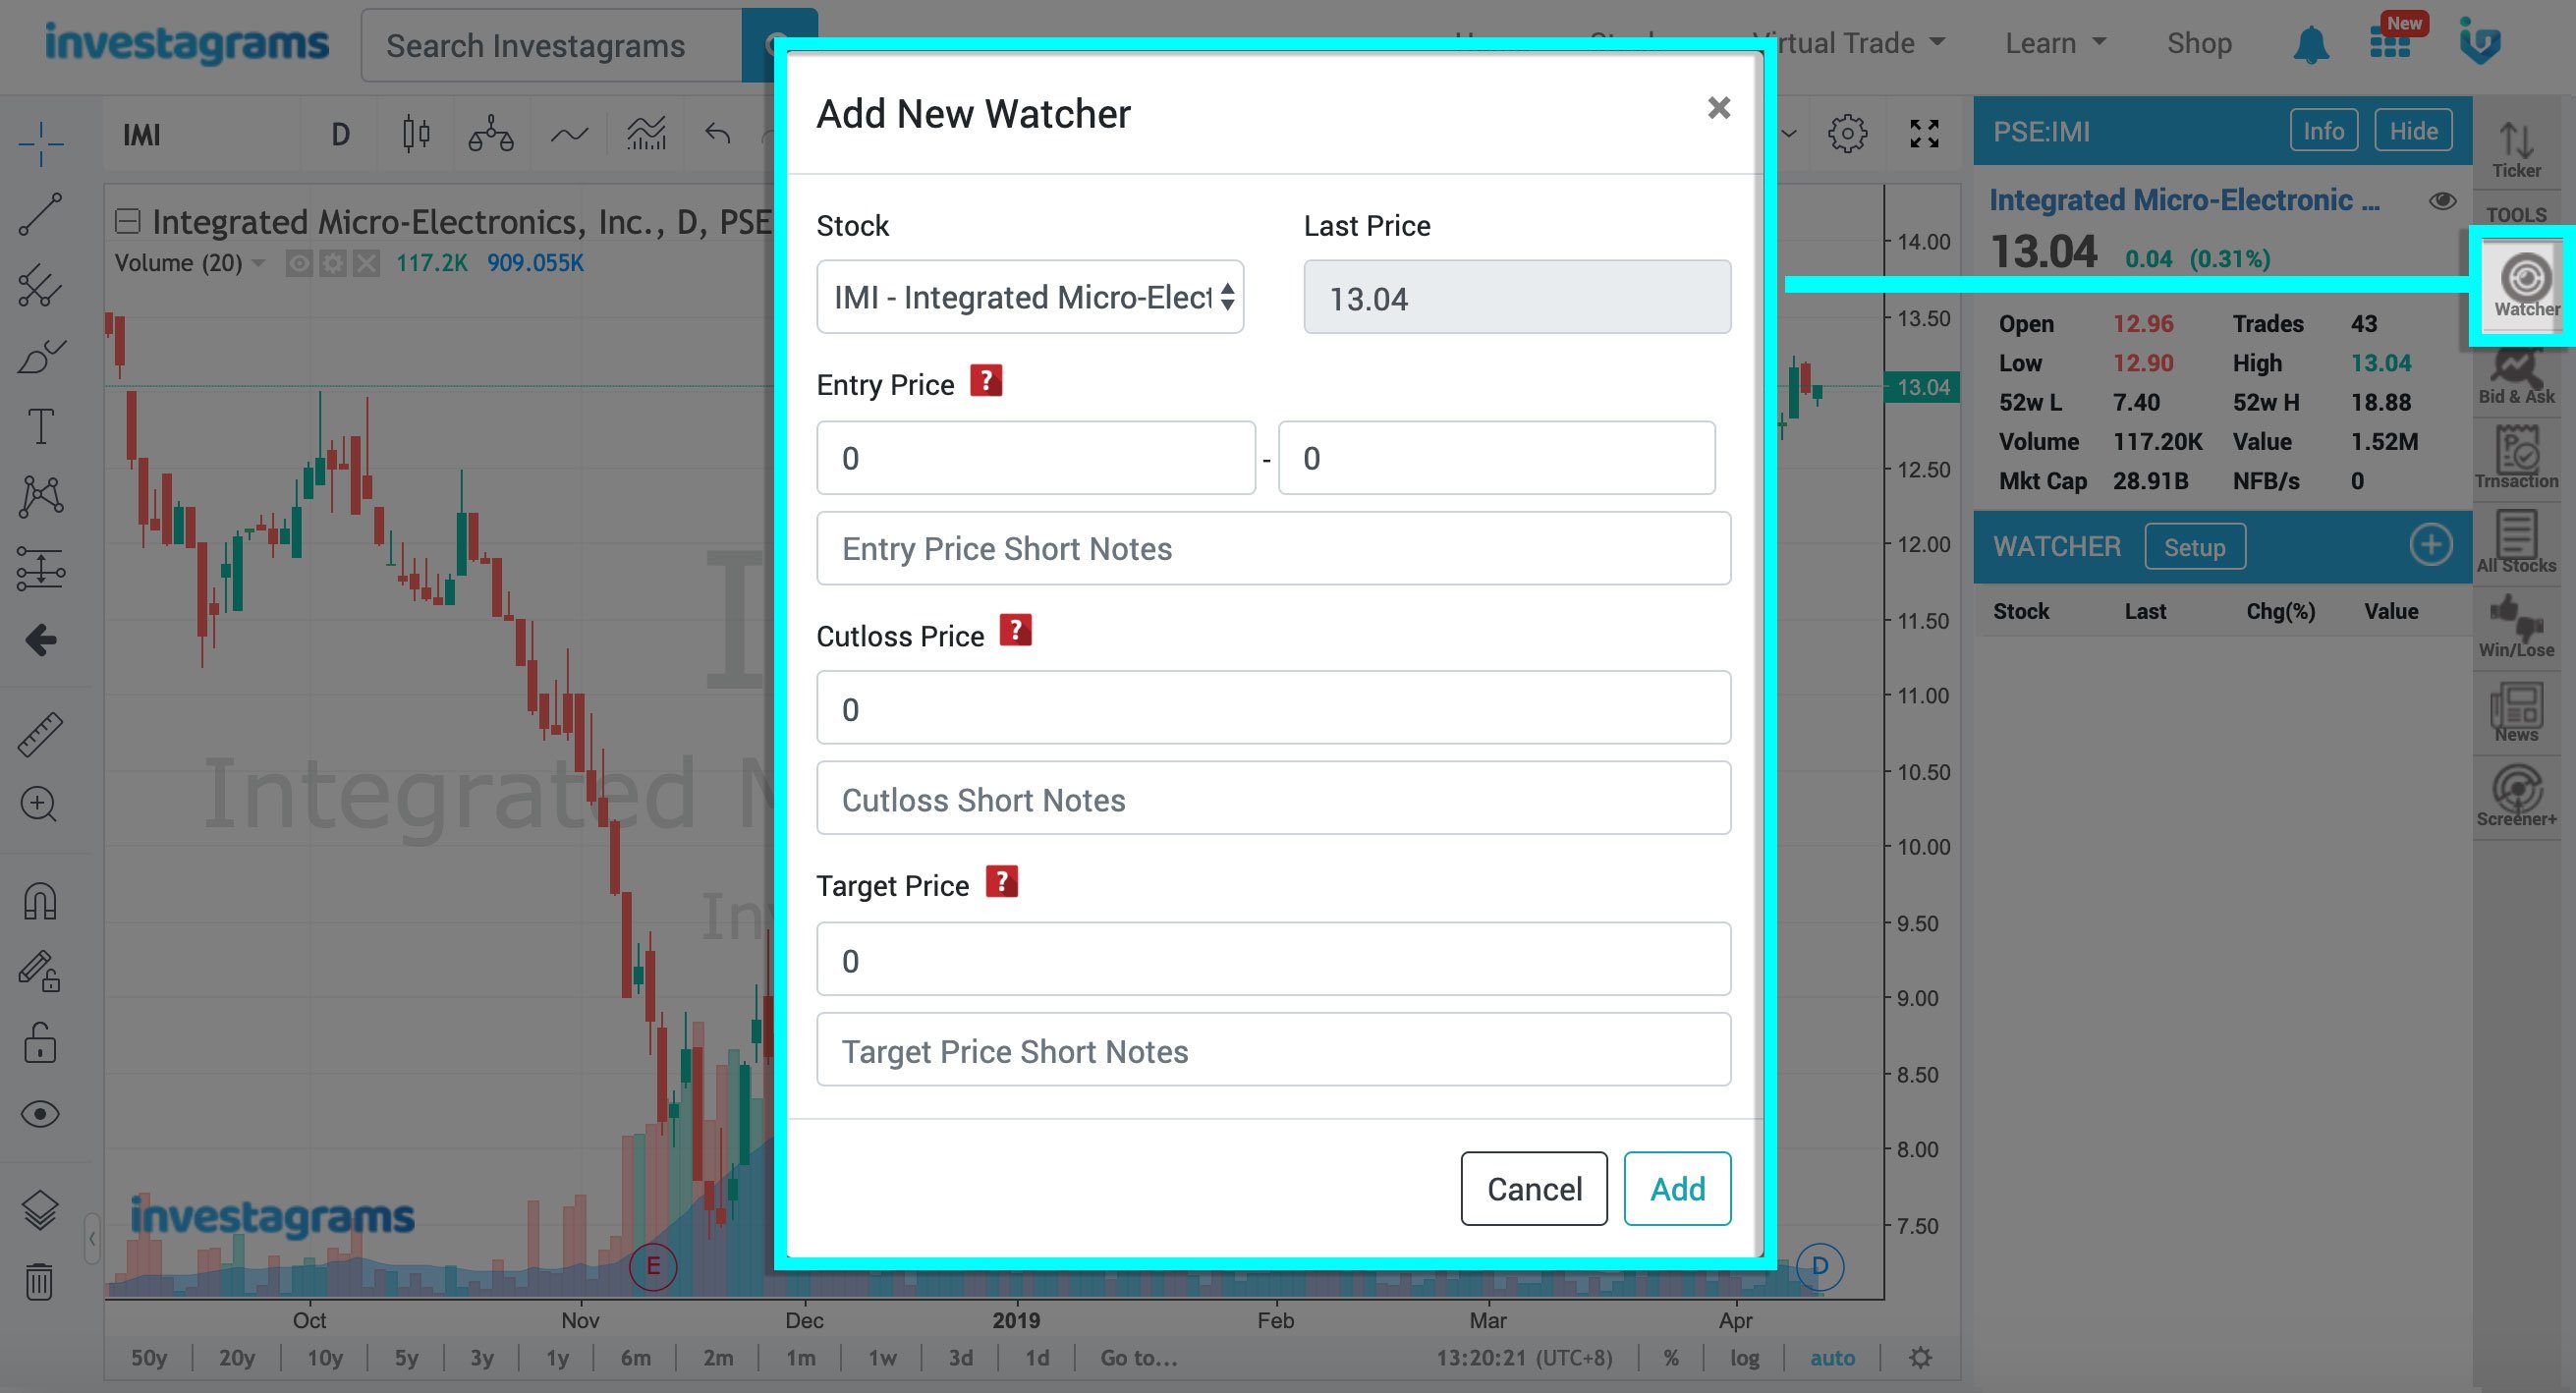
1. Click the “Watcher” tab on the right-hand side of the chart under “Tools”.
2. Select the “eye-like” button or the “plus sign” beside the “Watcher Setup”.
3. A small tab like the one below will show up where you’ll input necessary data.
4. An alert will be sent to you as it hits your set prices (Target and Cut Loss) or when it releases a news/disclosure.
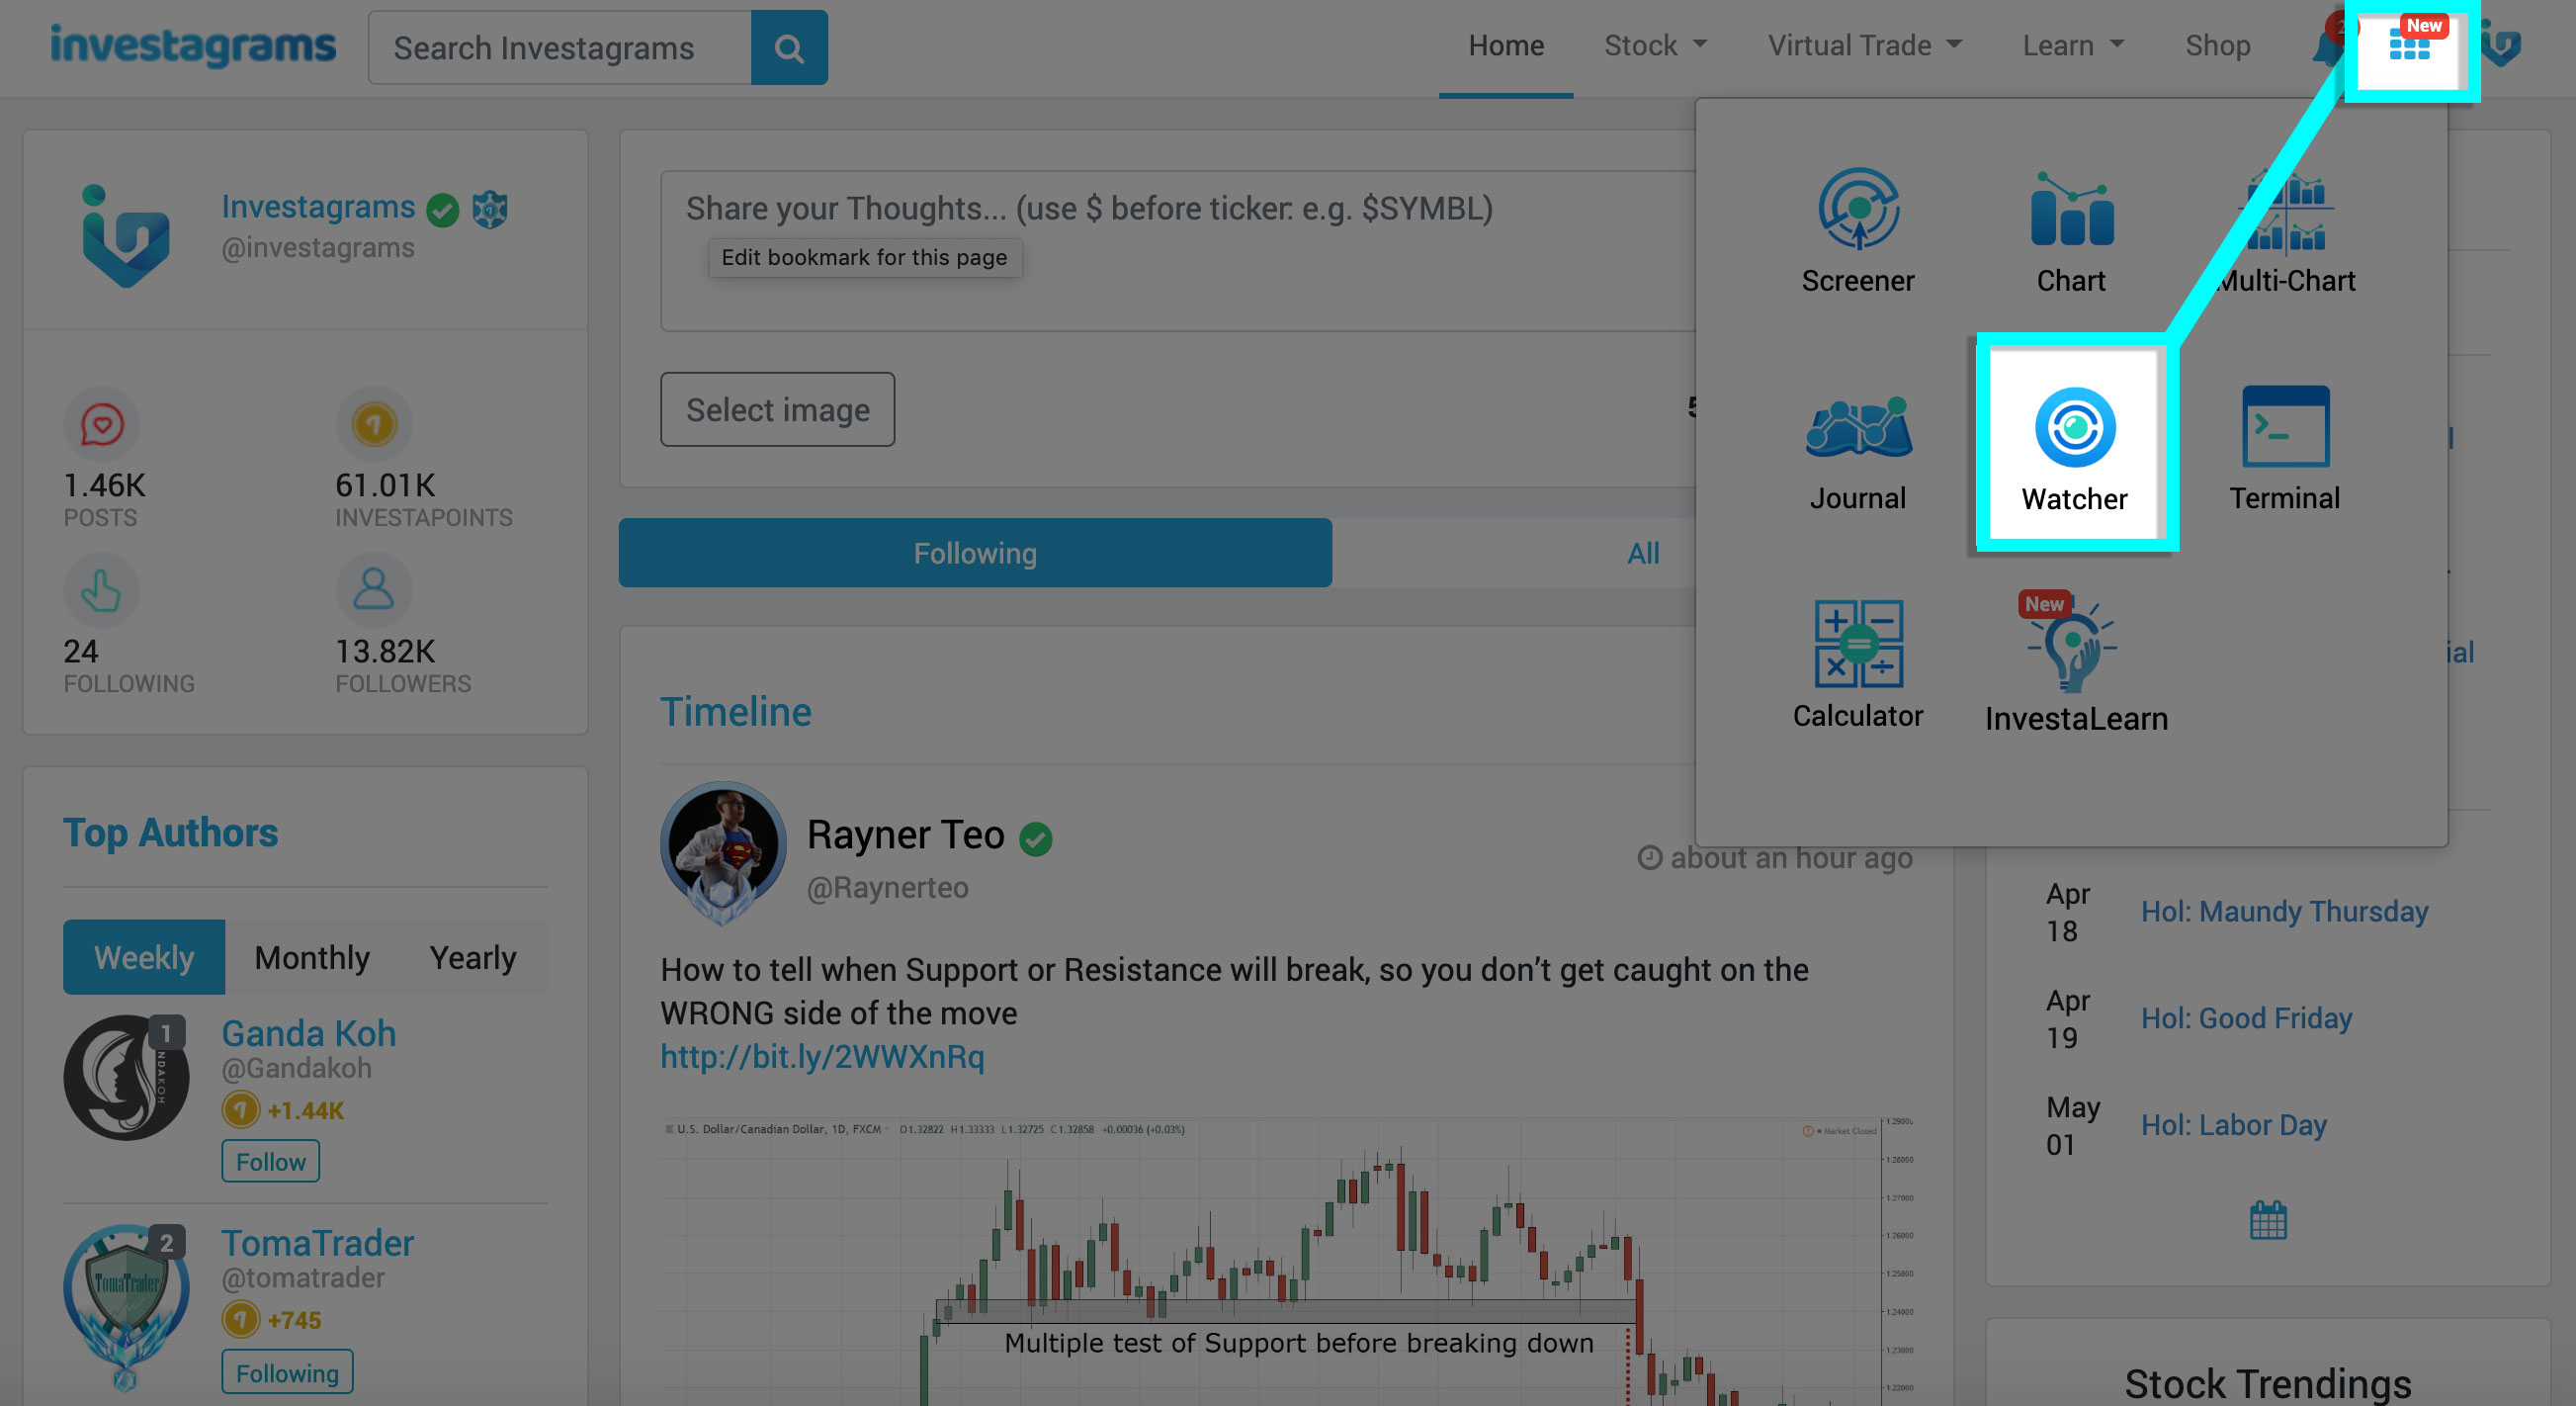
Option 2. If you’re anywhere in the Investagrams’ homepage:
1. Select the blue navigator below beside your account’s default picture then choose “Watcher”.
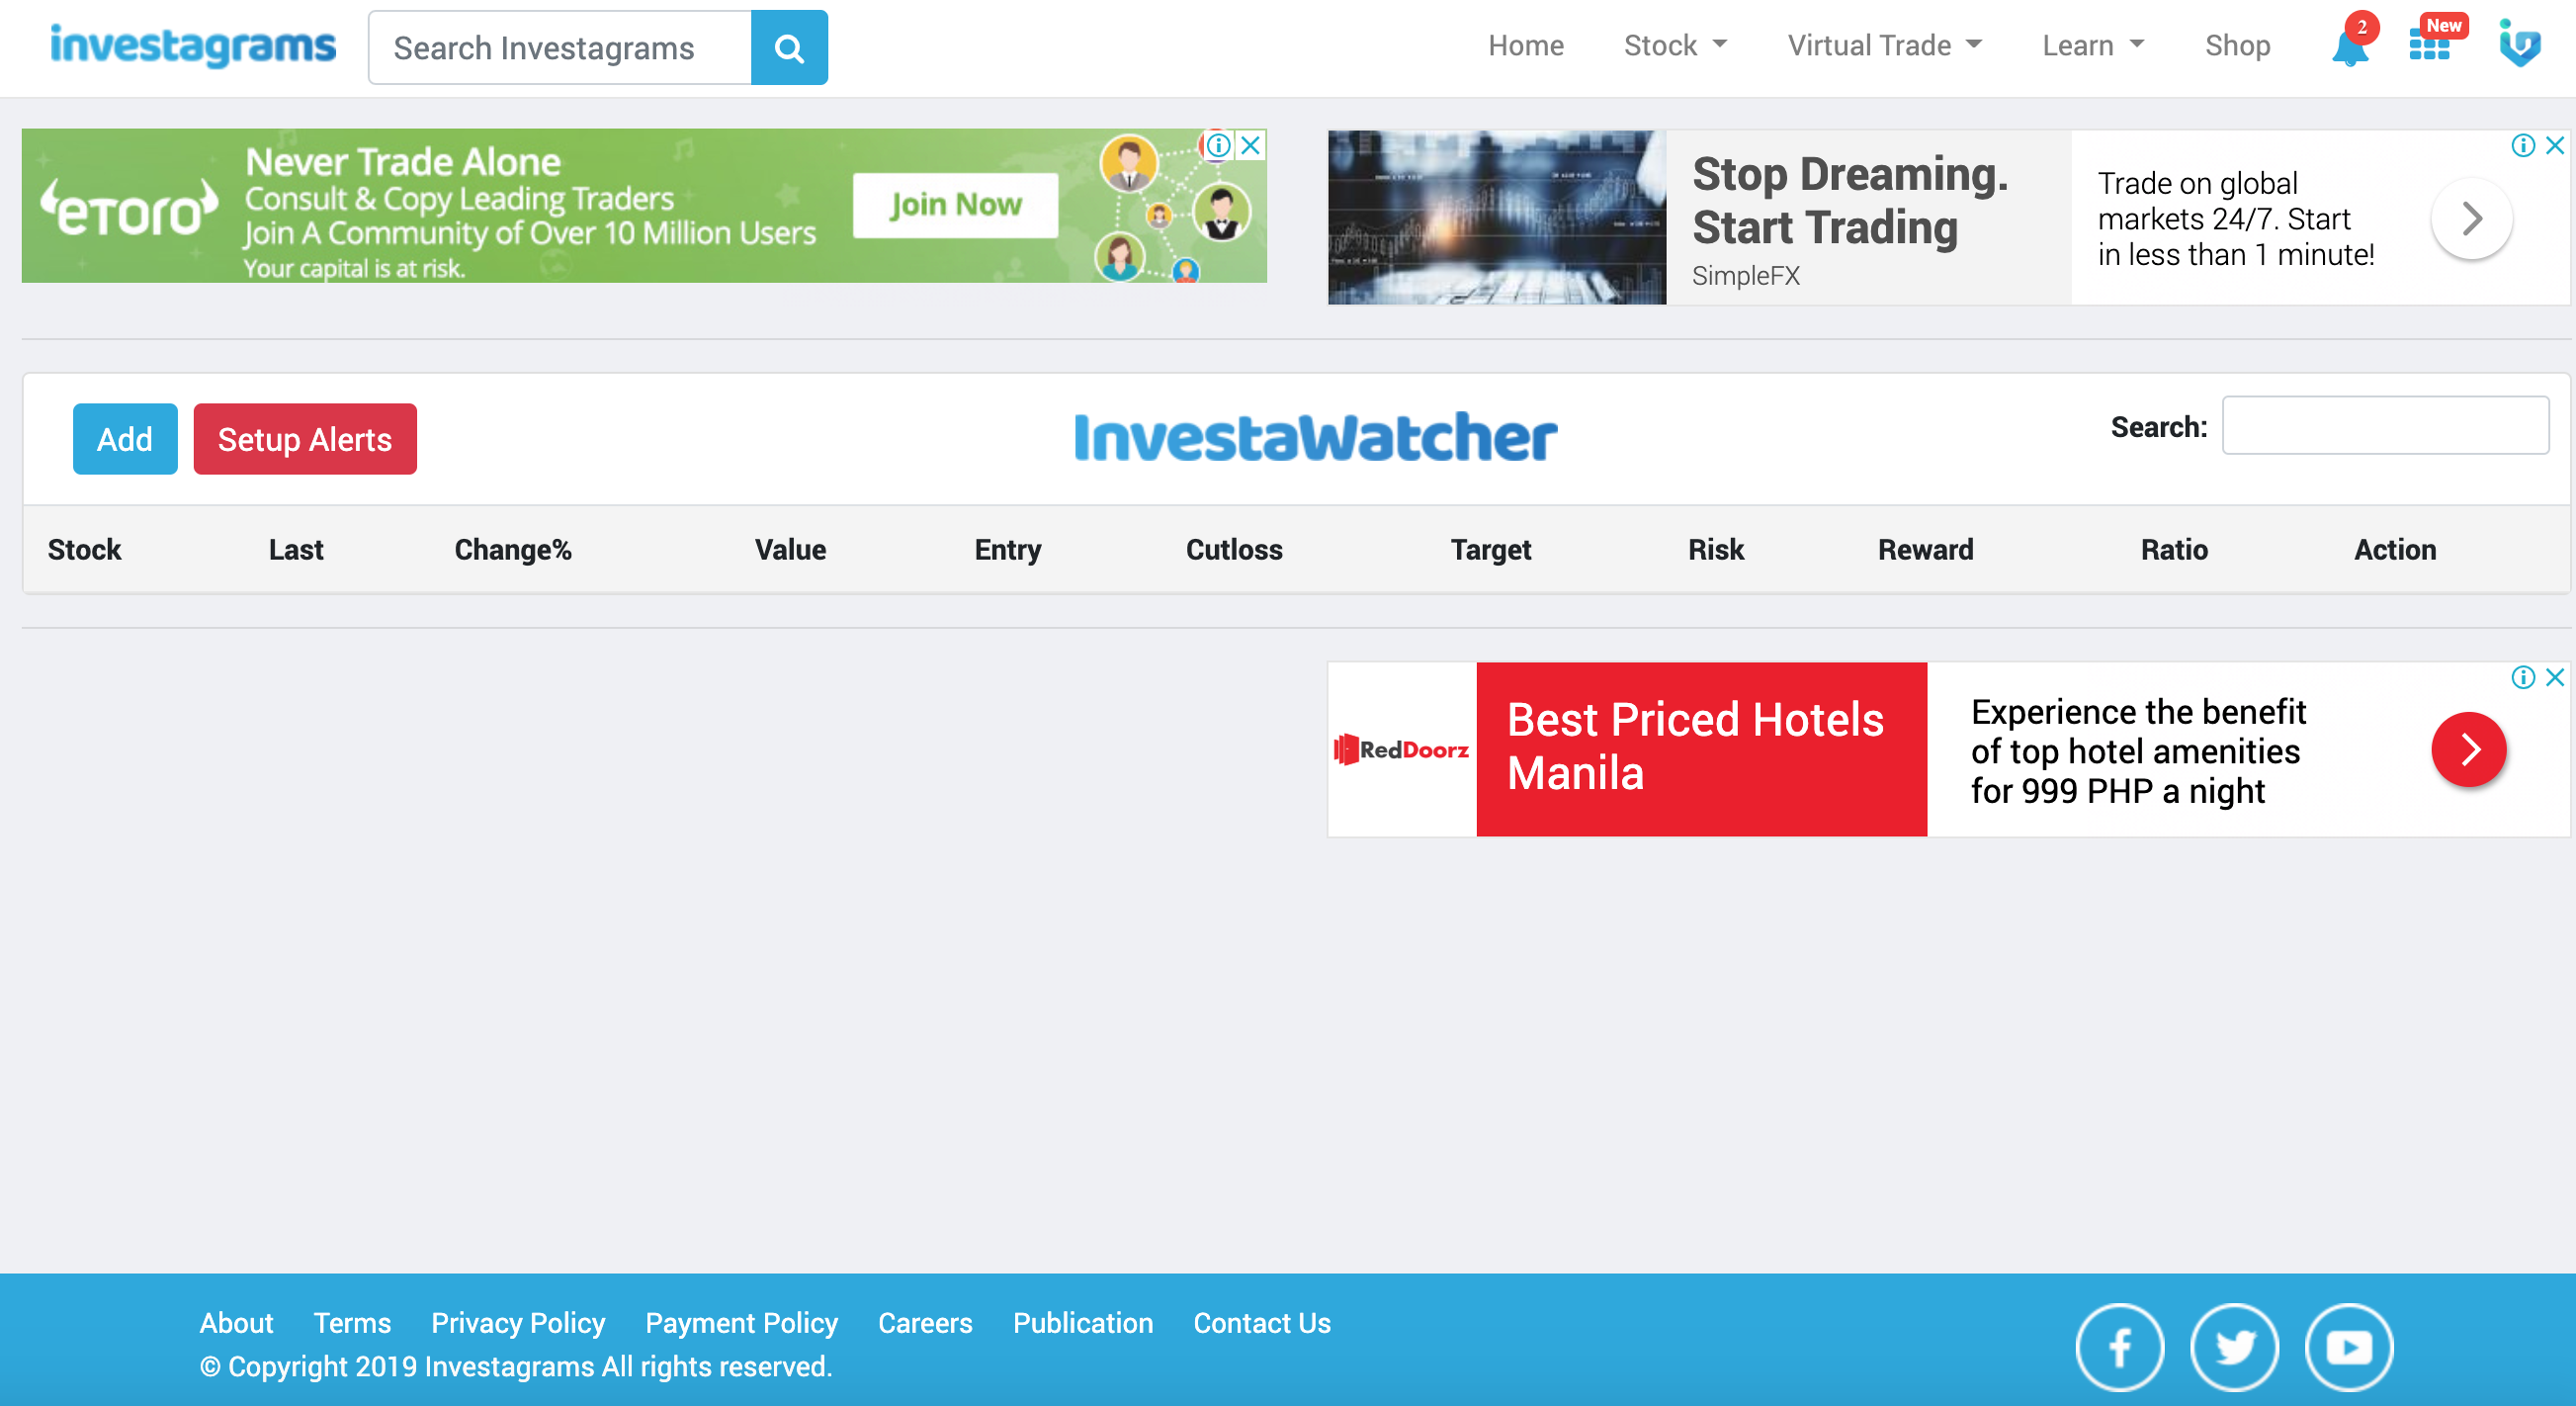
2. You’ll be taken to the InvestaWatcher’s main tab where you can add stocks and setup alerts.
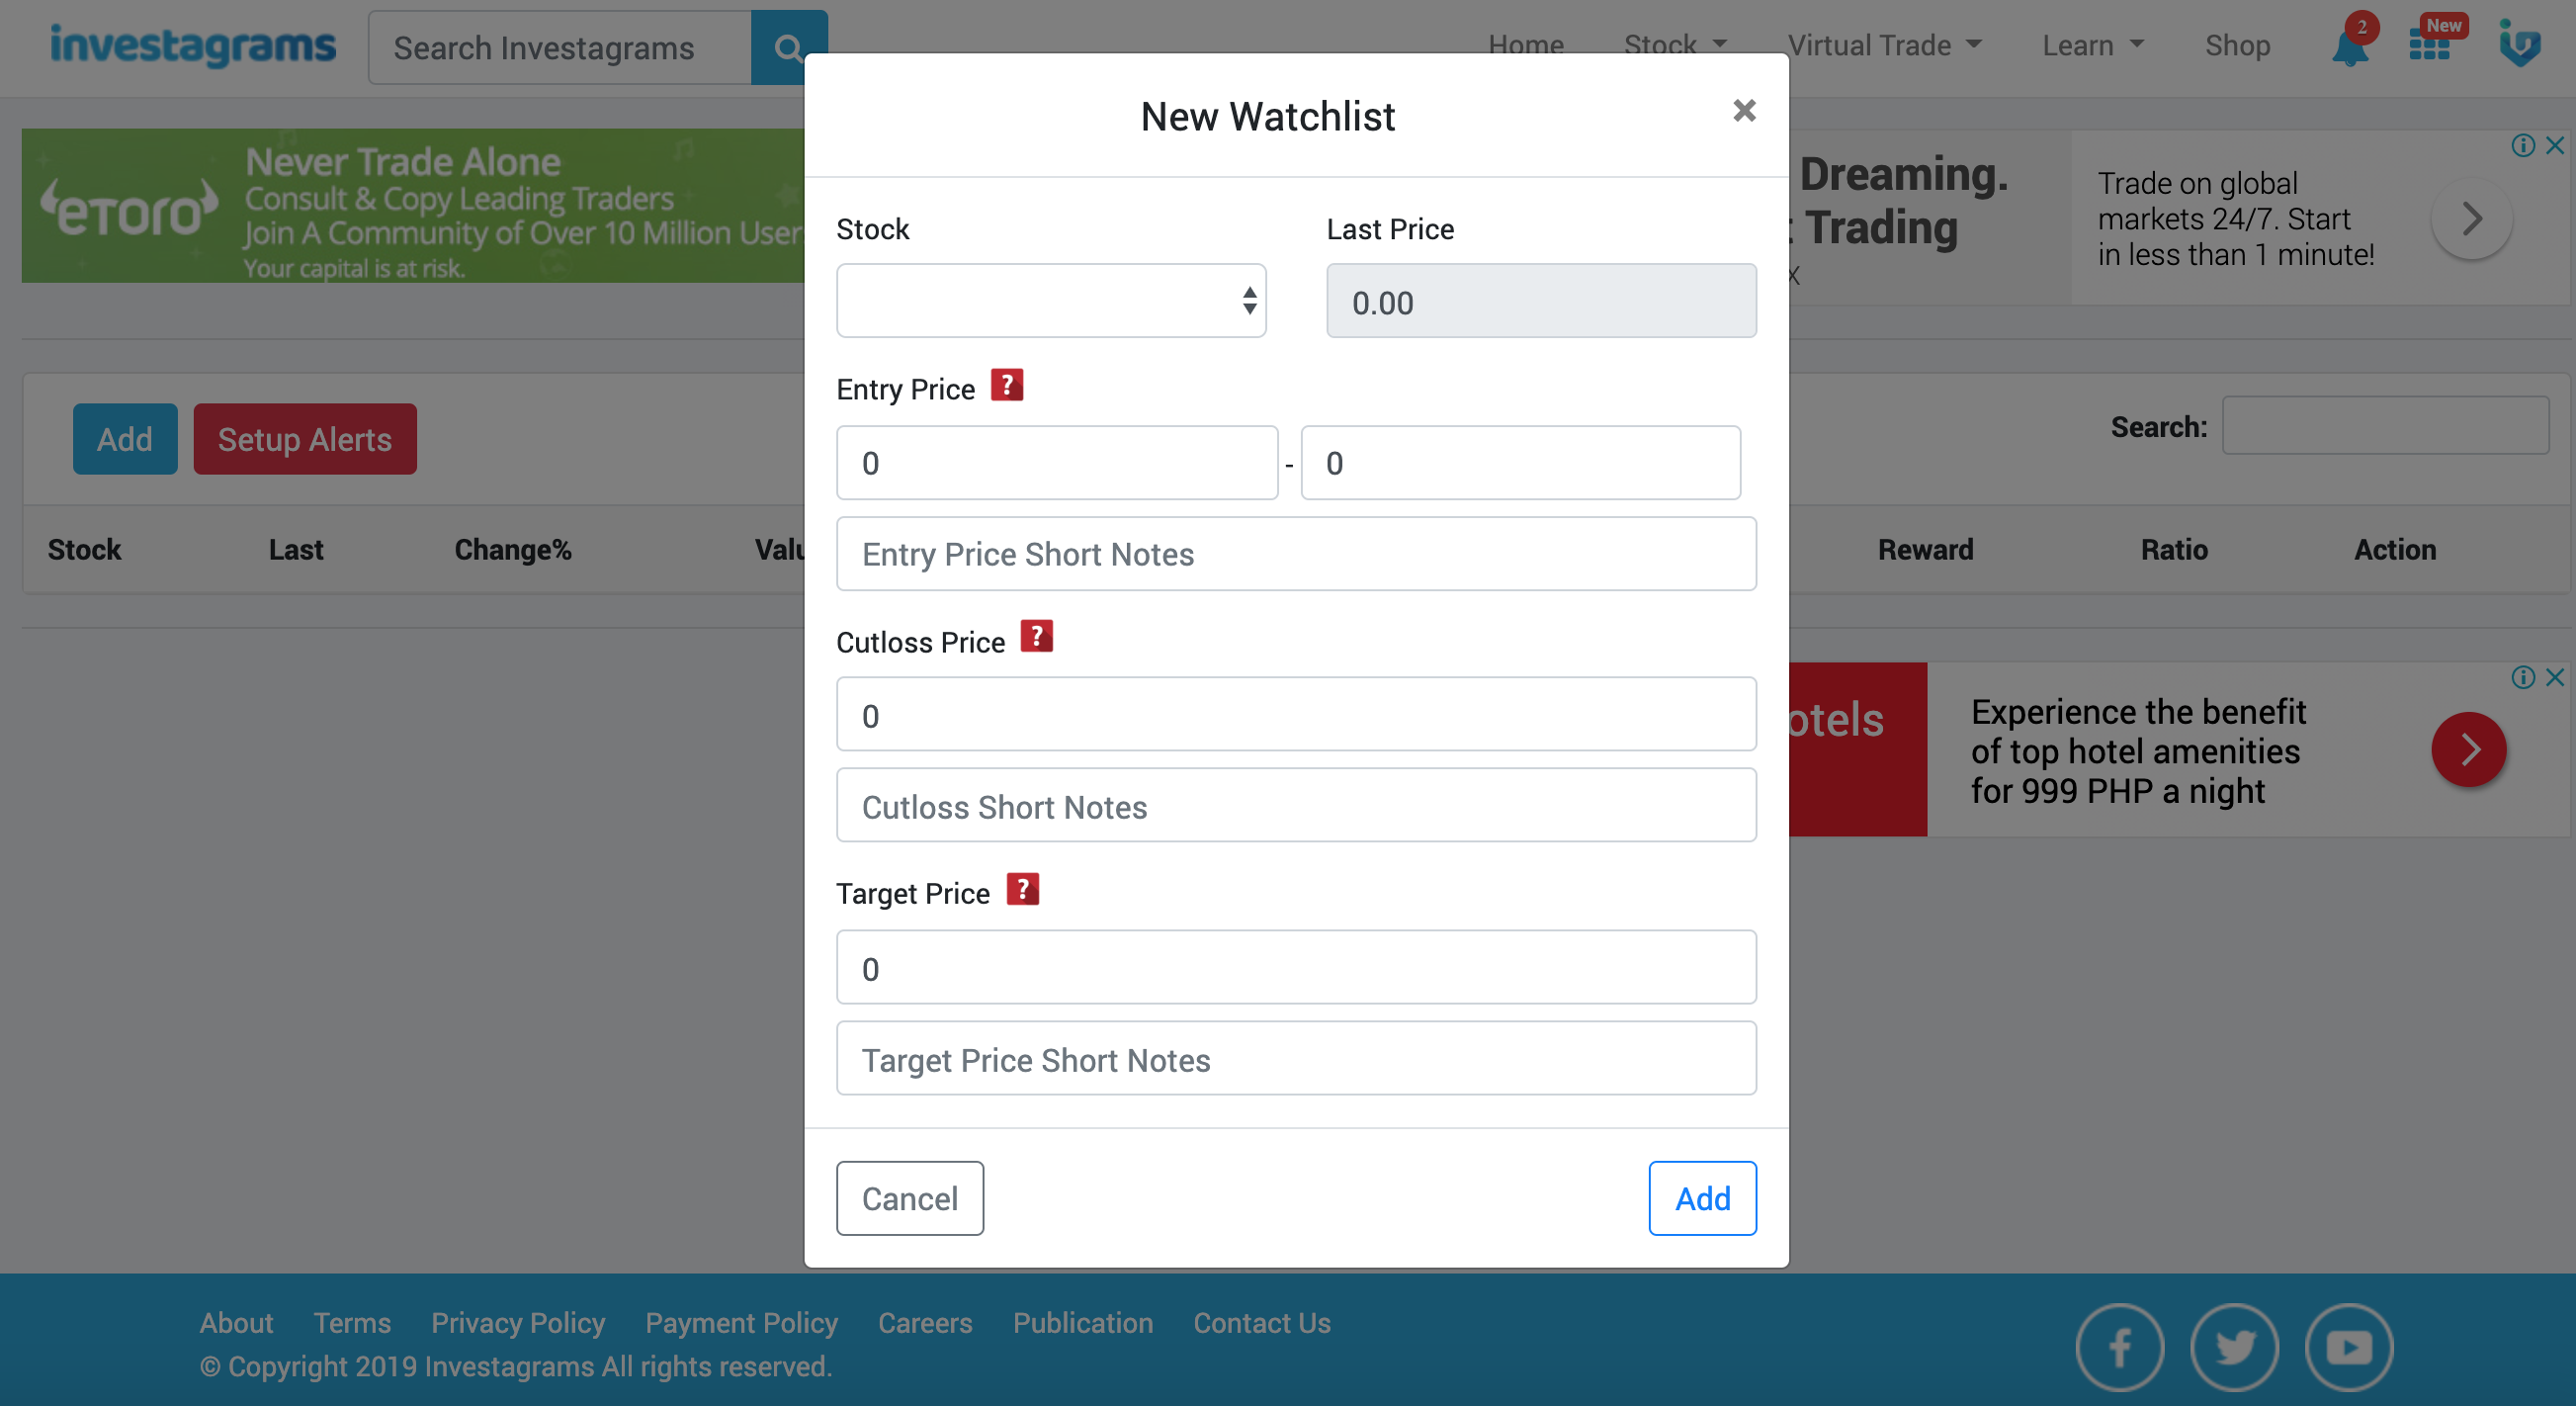
3. A small tab will pop-up like the one below.
4. An alert will be sent to you as it hits your set prices or when it releases a disclosure.
The InvestaWatcher will alert us through email, sms, or even in our Facebook Messenger accounts. So, it basically covers all the channels needed to alert you.
As a trader, we know the amount of effort we put in our trading plans. But a well-baked trading plan won’t necessarily grant us the reward we’re looking for, execution serves as a bridge between our trading plan and the market. Actually getting in the swing and the huge moves of the stock we want to trade in the most precise way is tougher than creating a trade plan, given outside variables that might affect the way we execute our trades.
We might be patting ourselves in the back when the stock we made a trading plan for actually went upwards. But our goal in the market is to make money consistently. With the InvestaWatcher, our executions will be better, more efficient, and precise.
For more information about the InvestaWatcher, click here.
One of the most commonly used technical indicators across all markets is the Relative Strength Index or RSI. Developed by an American technical analyst named J. Welles Wilder, the RSI is a momentum oscillator (whereby oscillators are the most common type of a technical indicator) used primarily by traders to identify the speed and change of price action. The standard setting for the RSI is the 14-period average that oscillates between 70 (cross above is the overbought region) and 30 (cross below is the oversold region). RSI can be used in any timeframe relative to your trading objective.
For those who are puzzled as to what the RSI is, a simple analogy for it is a car’s speedometer. Say you’re driving down South Luzon Expressway (SLEX), the minimum and maximum speed for a car is 60kph and 100kph, respectively. Let’s consider the minimum and maximum speed limit as oversold and overbought. When you go over the speed limit of SLEX, say you’re going 160kph, you’d still be able to go from point a to point b, but the risk of getting apprehended or a vehicular accident is now doubled, if not tripled. Same goes on with RSI, when you entered/bought stock in the overbought region, say in the 90 levels of the RSI, the odds of the stock pulling back is high (meaning it will depreciate in price value due to profit-taking overwhelming buying). So, it’s more likely that you’ll end up in a loss rather than a gain.
The RSI is often used for the following reasons:
• To identify overbought and oversold conditions
• To spot classic and hidden divergences (bullish and bearish)
• To serve as a leading indicator to generate buy and sell signals
Overbought/Oversold Conditions
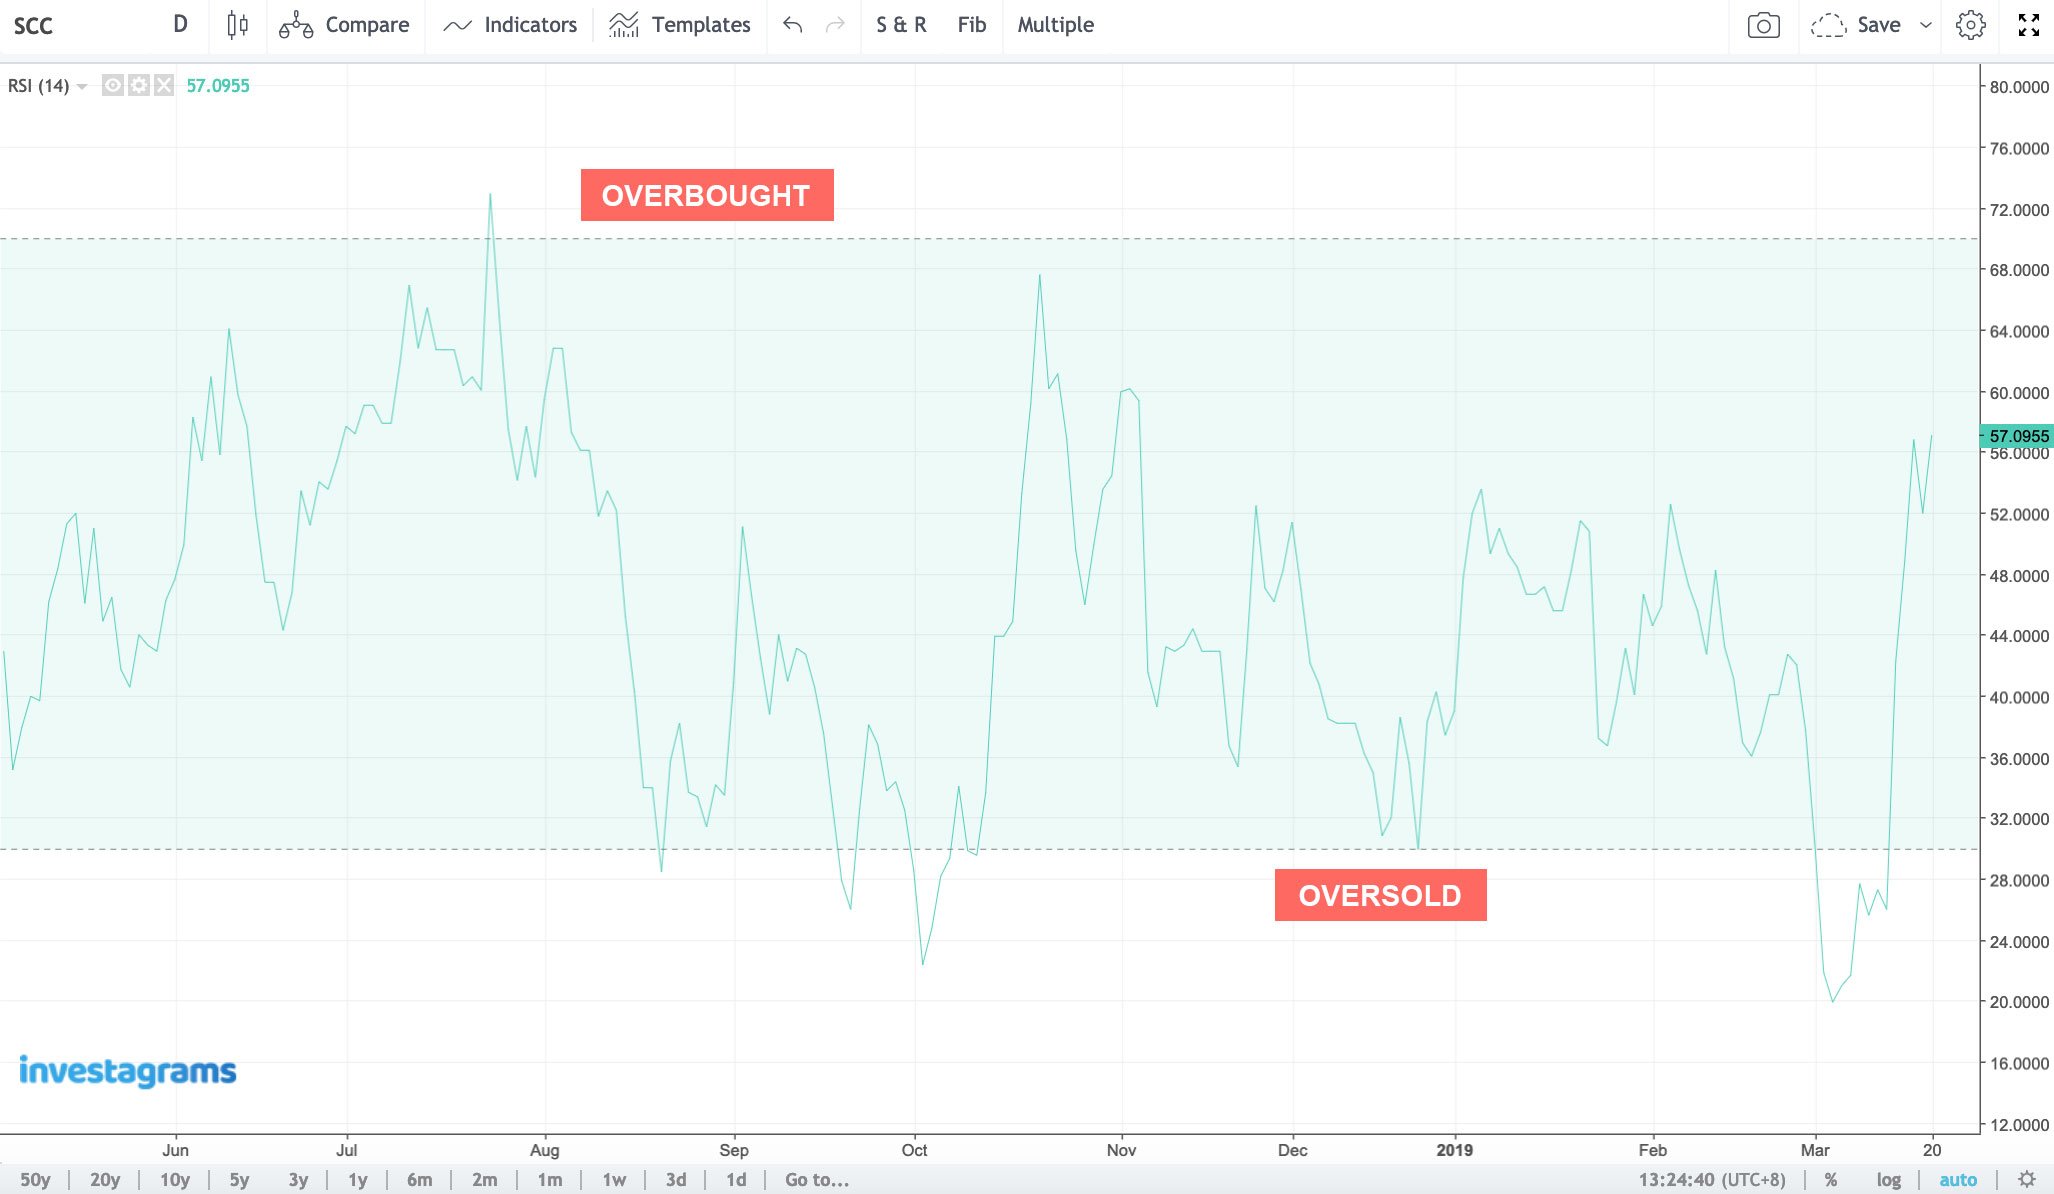
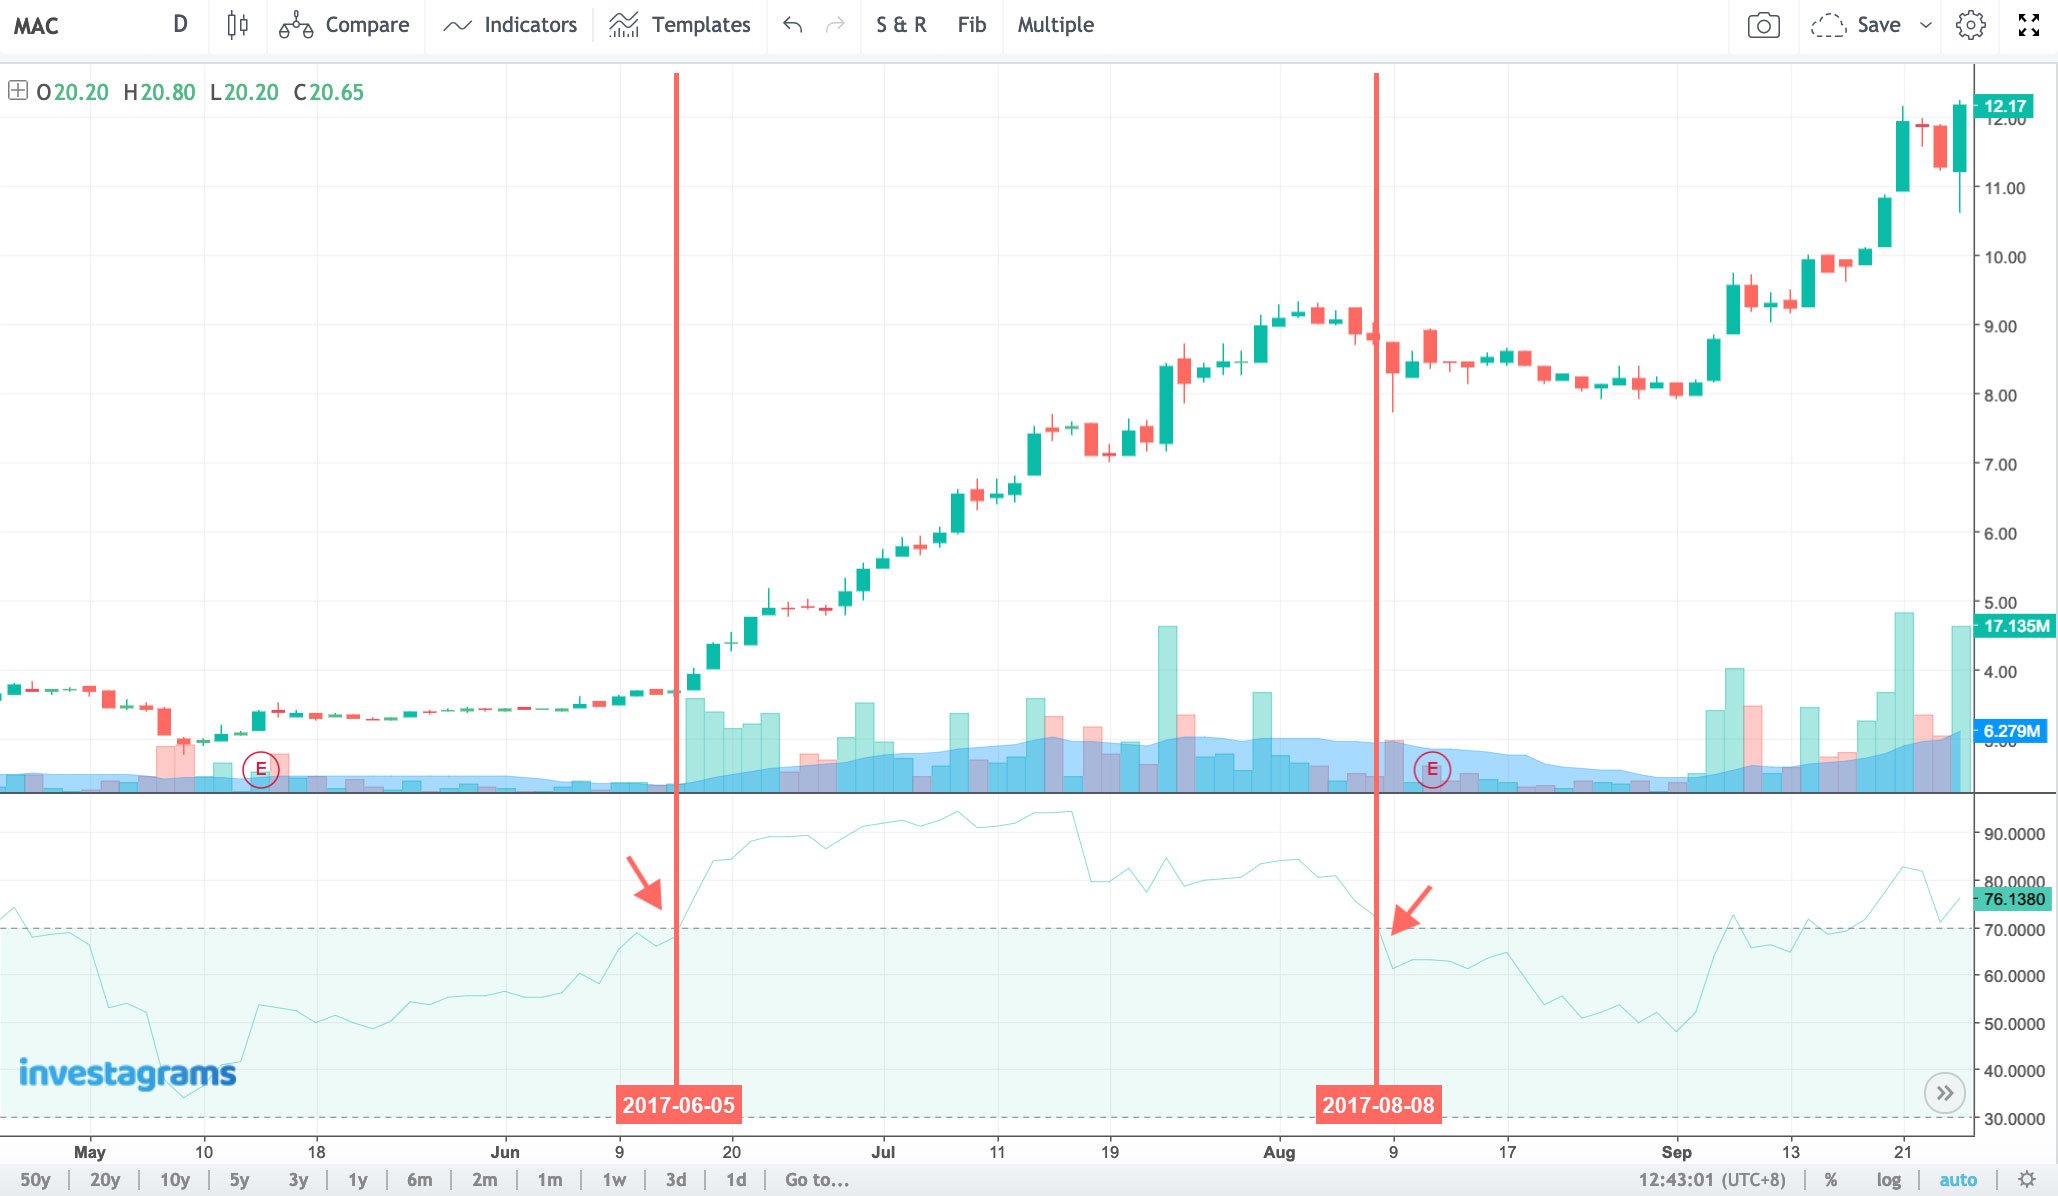
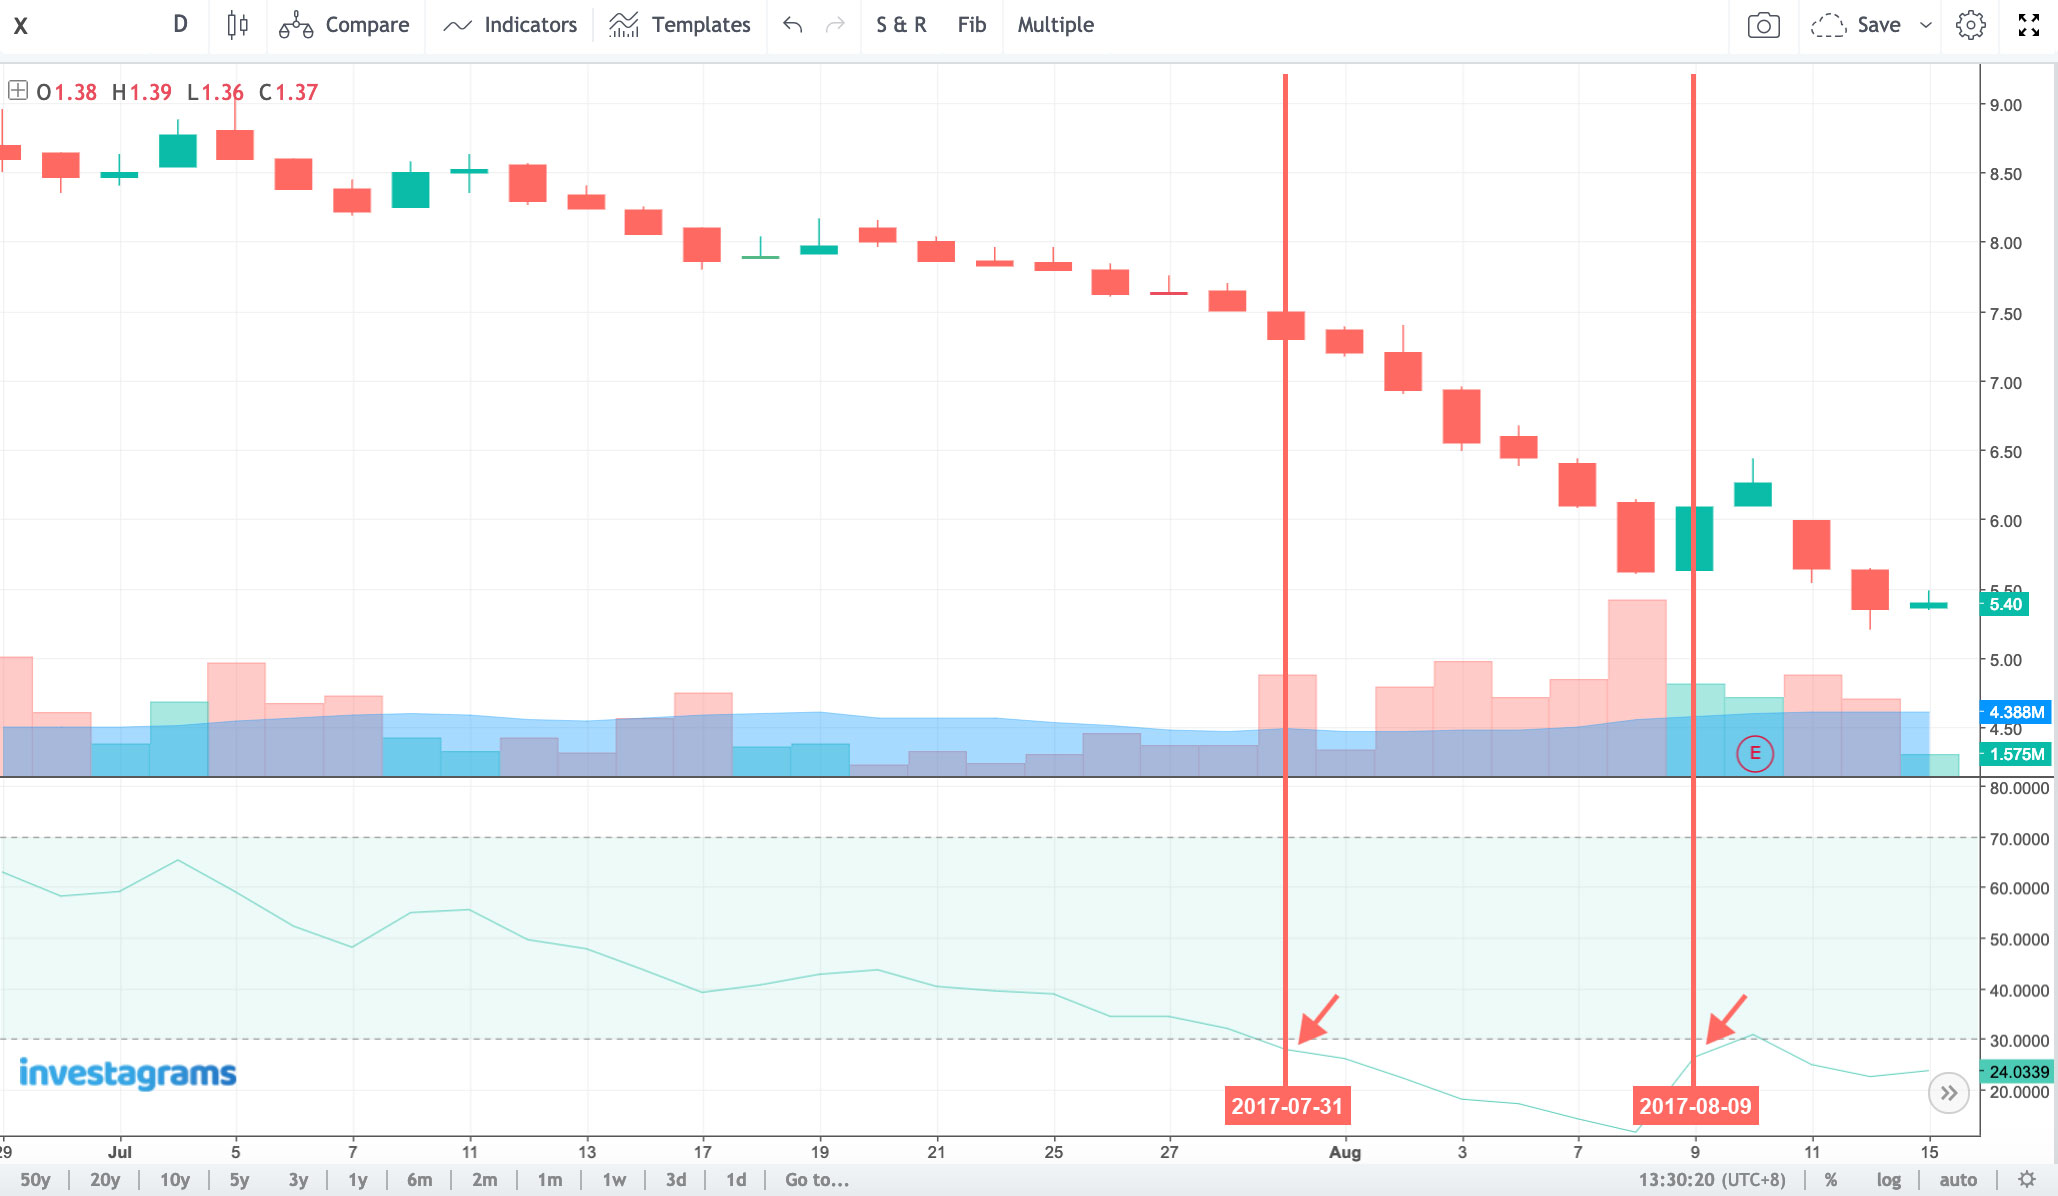
The chart below shows you the overbought and oversold levels of the RSI (14-period). A stock can proceed to go lower than the oversold line (30) or higher than the overbought line (70) depending on the speed of the movement of price.
The RSI readings below show that a stock can proceed to go over or under overbought and oversold regions and still go into the same direction.
Overbought conditions can be used as a signal to trim down your shares when you are in gain to cash-in some of your profits. It can also be used as a possible signal that a pullback is about to impend. So if you’re the type of trader who’s good at pullback setups, then this may be of use to you.
Oversold conditions, meanwhile, can indicate a possible exhaustion in selling. This is where traders who trade bounce plays sometimes look at when they identify their trading setups.
Note that it would be unwise to passively buy stocks just because they’re oversold or to automatically sell all your position when it’s overbought. Always be systematic when buying or selling so that you won’t let greed, fear, or hope, take over your trading.
Divergences
A divergence indicates a possible change or reversal in the underlying trend. It happens when price is not “in-sync” with momentum. Divergence is not limited only to the RSI as this could also be seen in other indicators such as Moving Average Convergence/Divergence (MACD) and the Commodity Channel Index (CCI), to name a few. When divergence is found in a higher timeframe (like weekly, monthly), it’ll give a much stronger signal.
There are two types of divergences: the bullish and the bearish. When looking for the latter, search for lows. For the former, look at the highs.
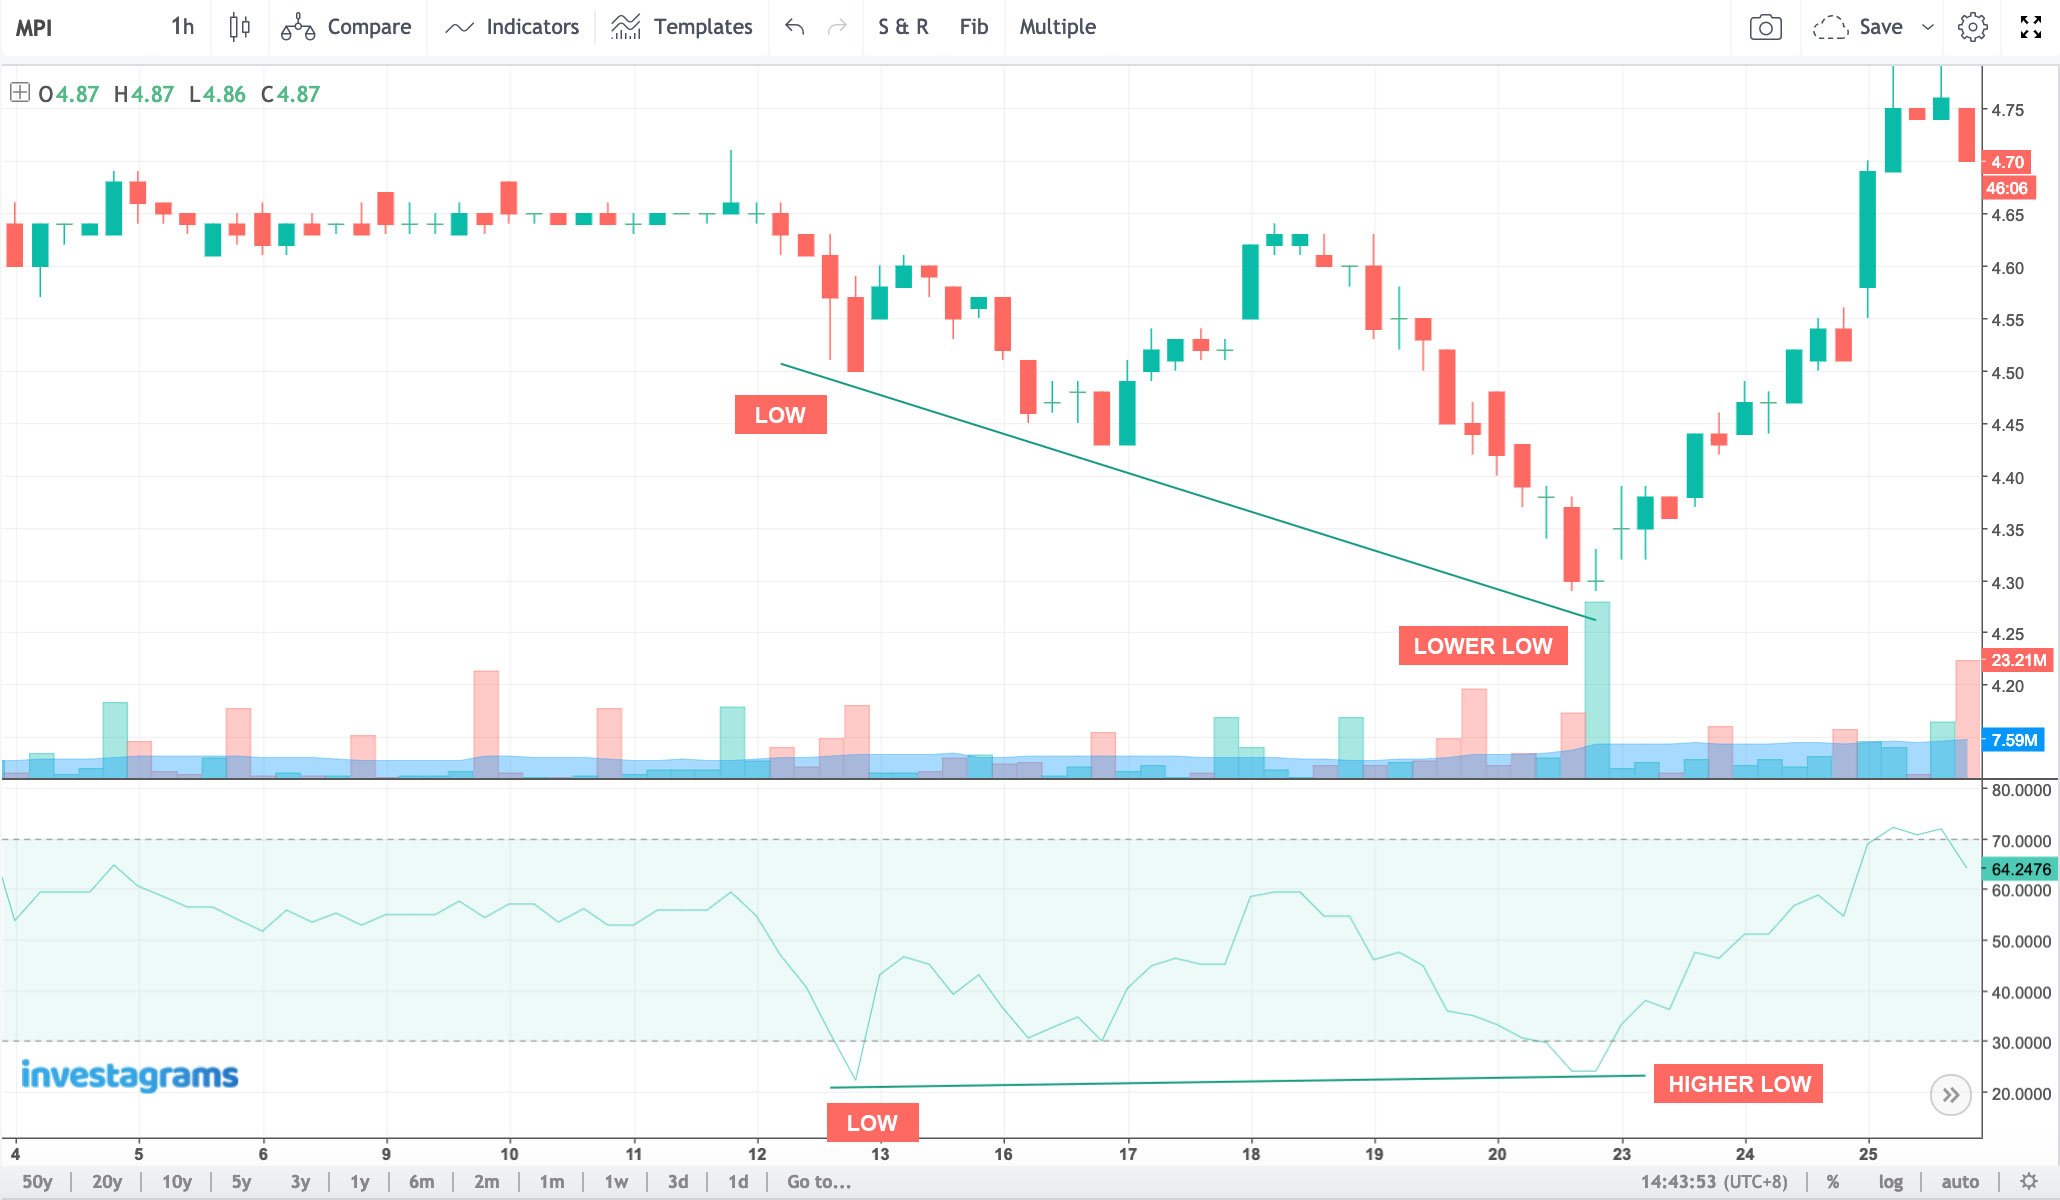
Bullish Divergence
A bullish divergence (positive divergence) happens when price makes a lower low whereas the momentum indicator makes a higher low. This means that there is a high probability that selling-pressure is weakening and buying (demand) could soon take over.
After Metro Pacific Investments Corporation (MPI) generated a bullish divergence using the RSI (14) in the 1-hour timeframe, it went on to break the previous high around 4.65/sh and then created a higher high around 4.75/sh. It also created a higher low in the few candlesticks. The bullish divergence signified the change in trend, from a downtrend to an uptrend, for MPI.
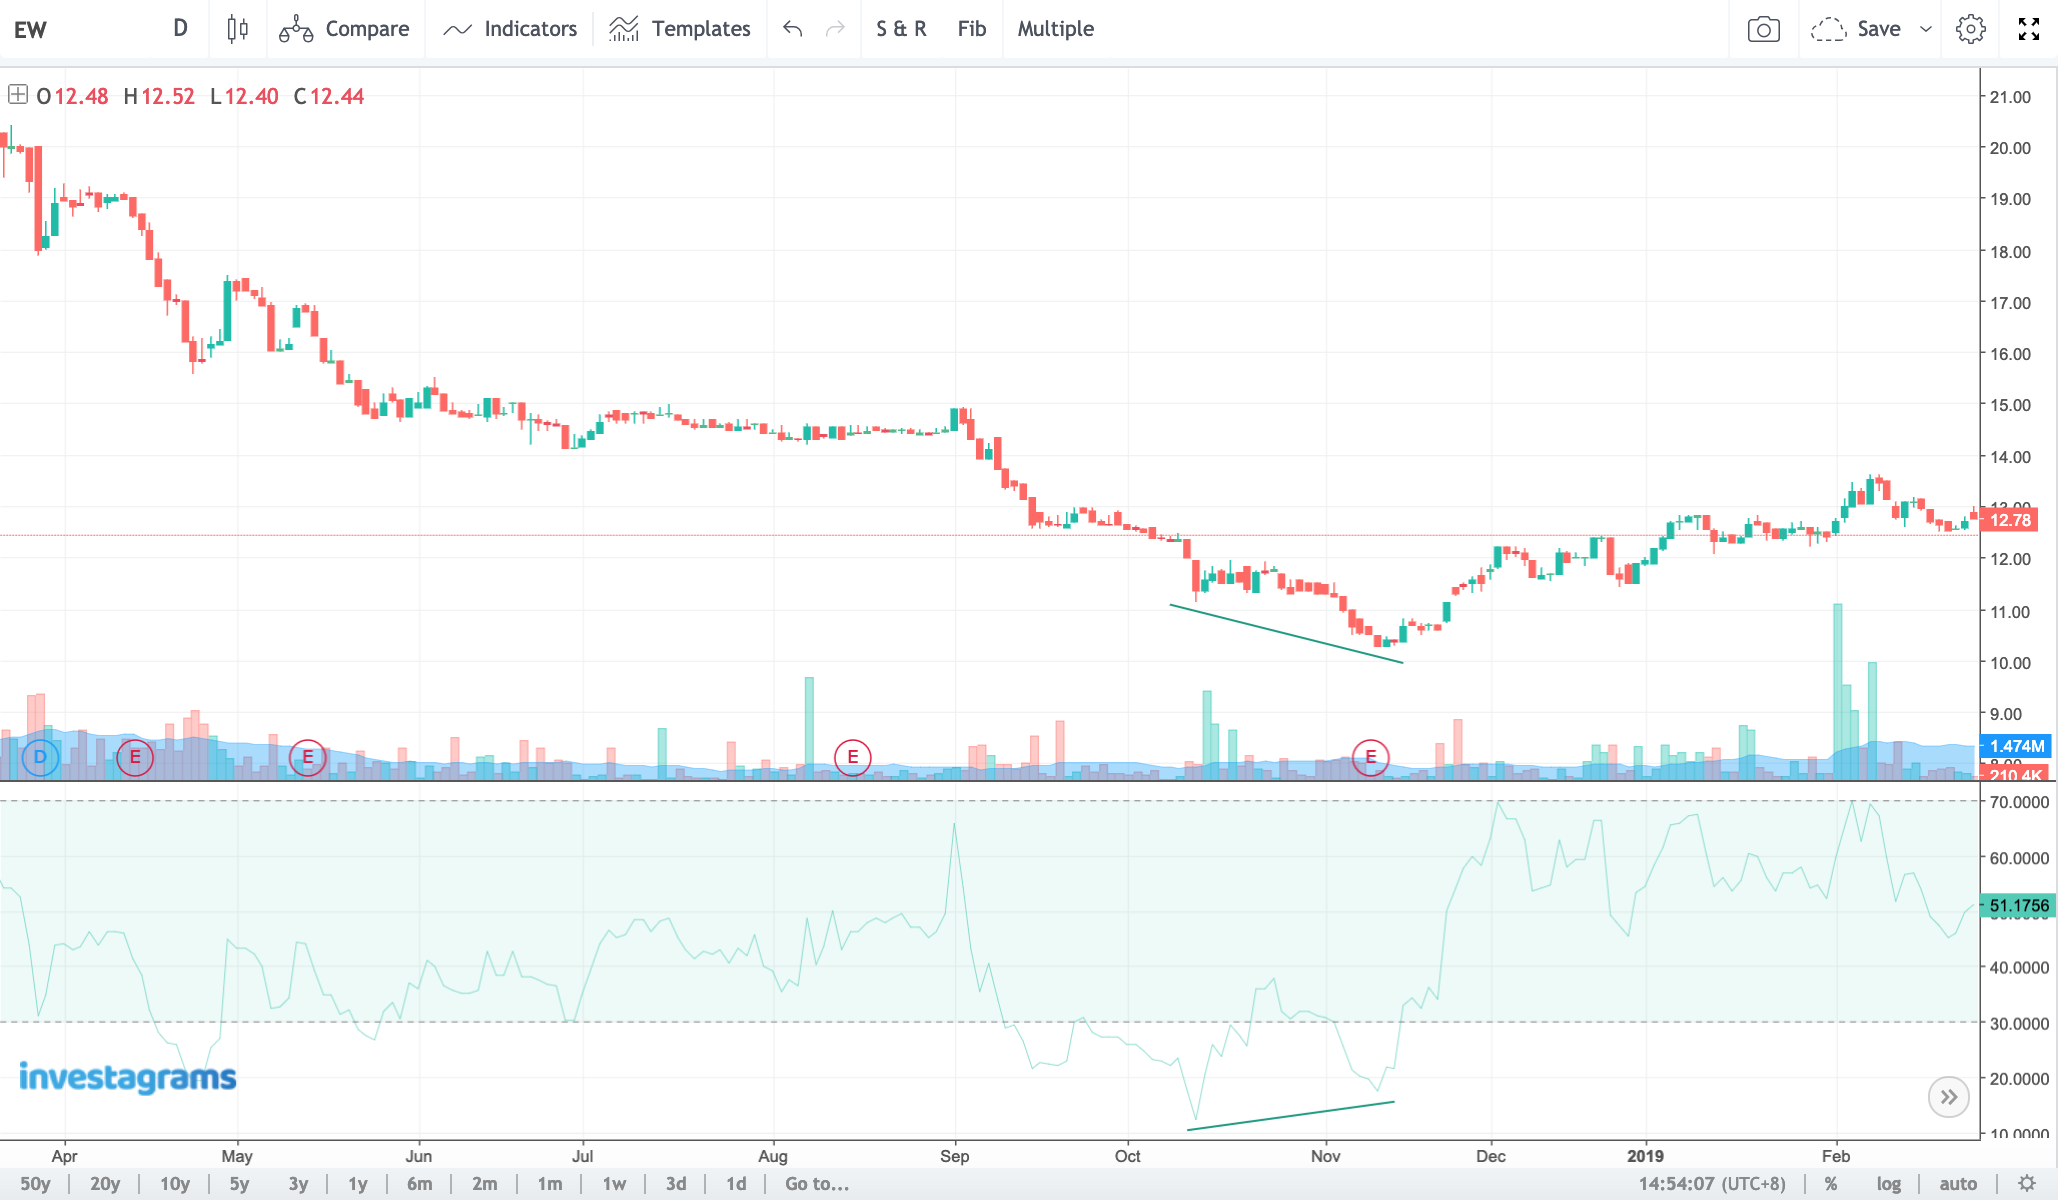
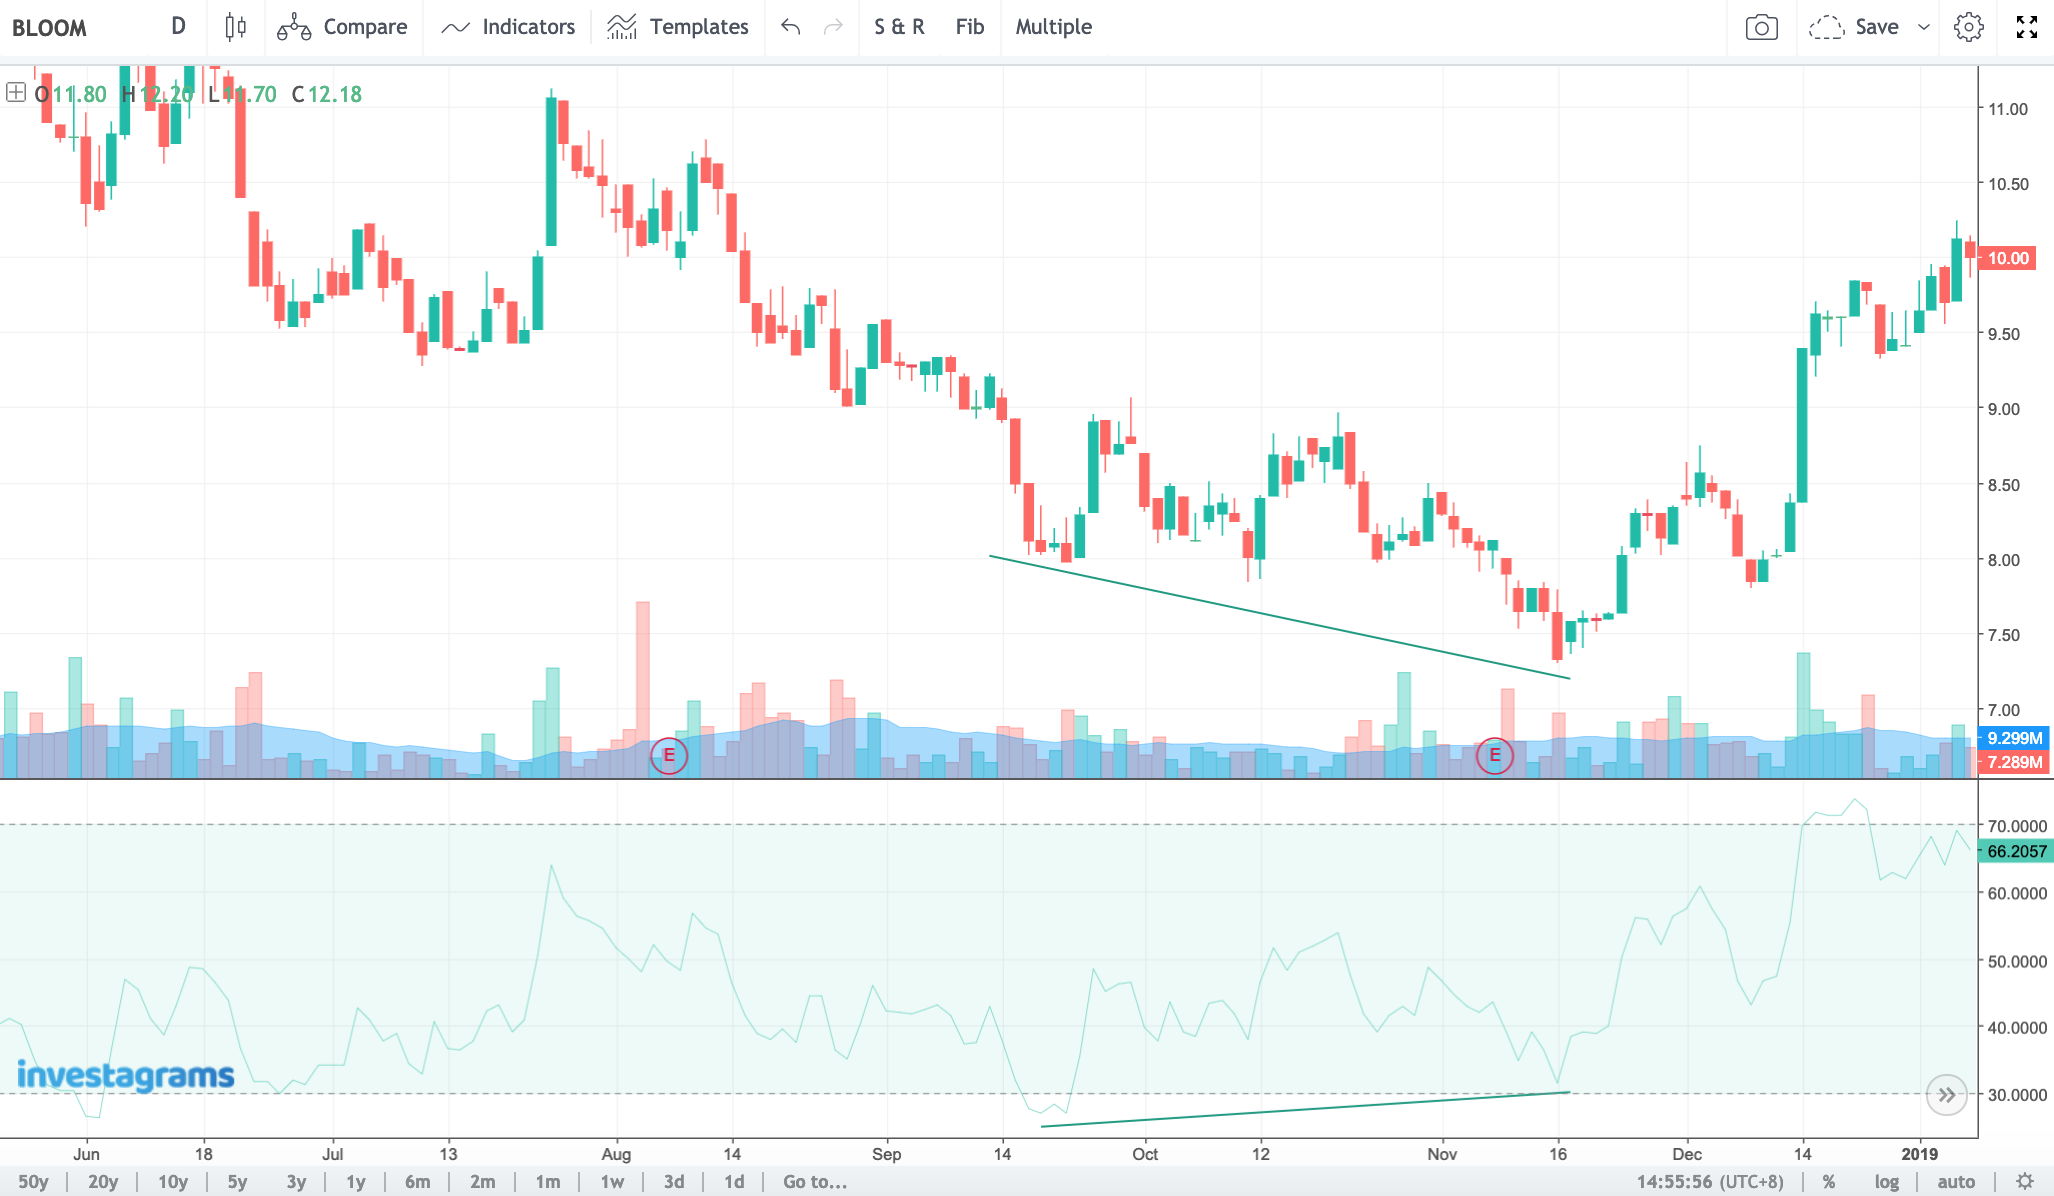
Below are a few more examples:
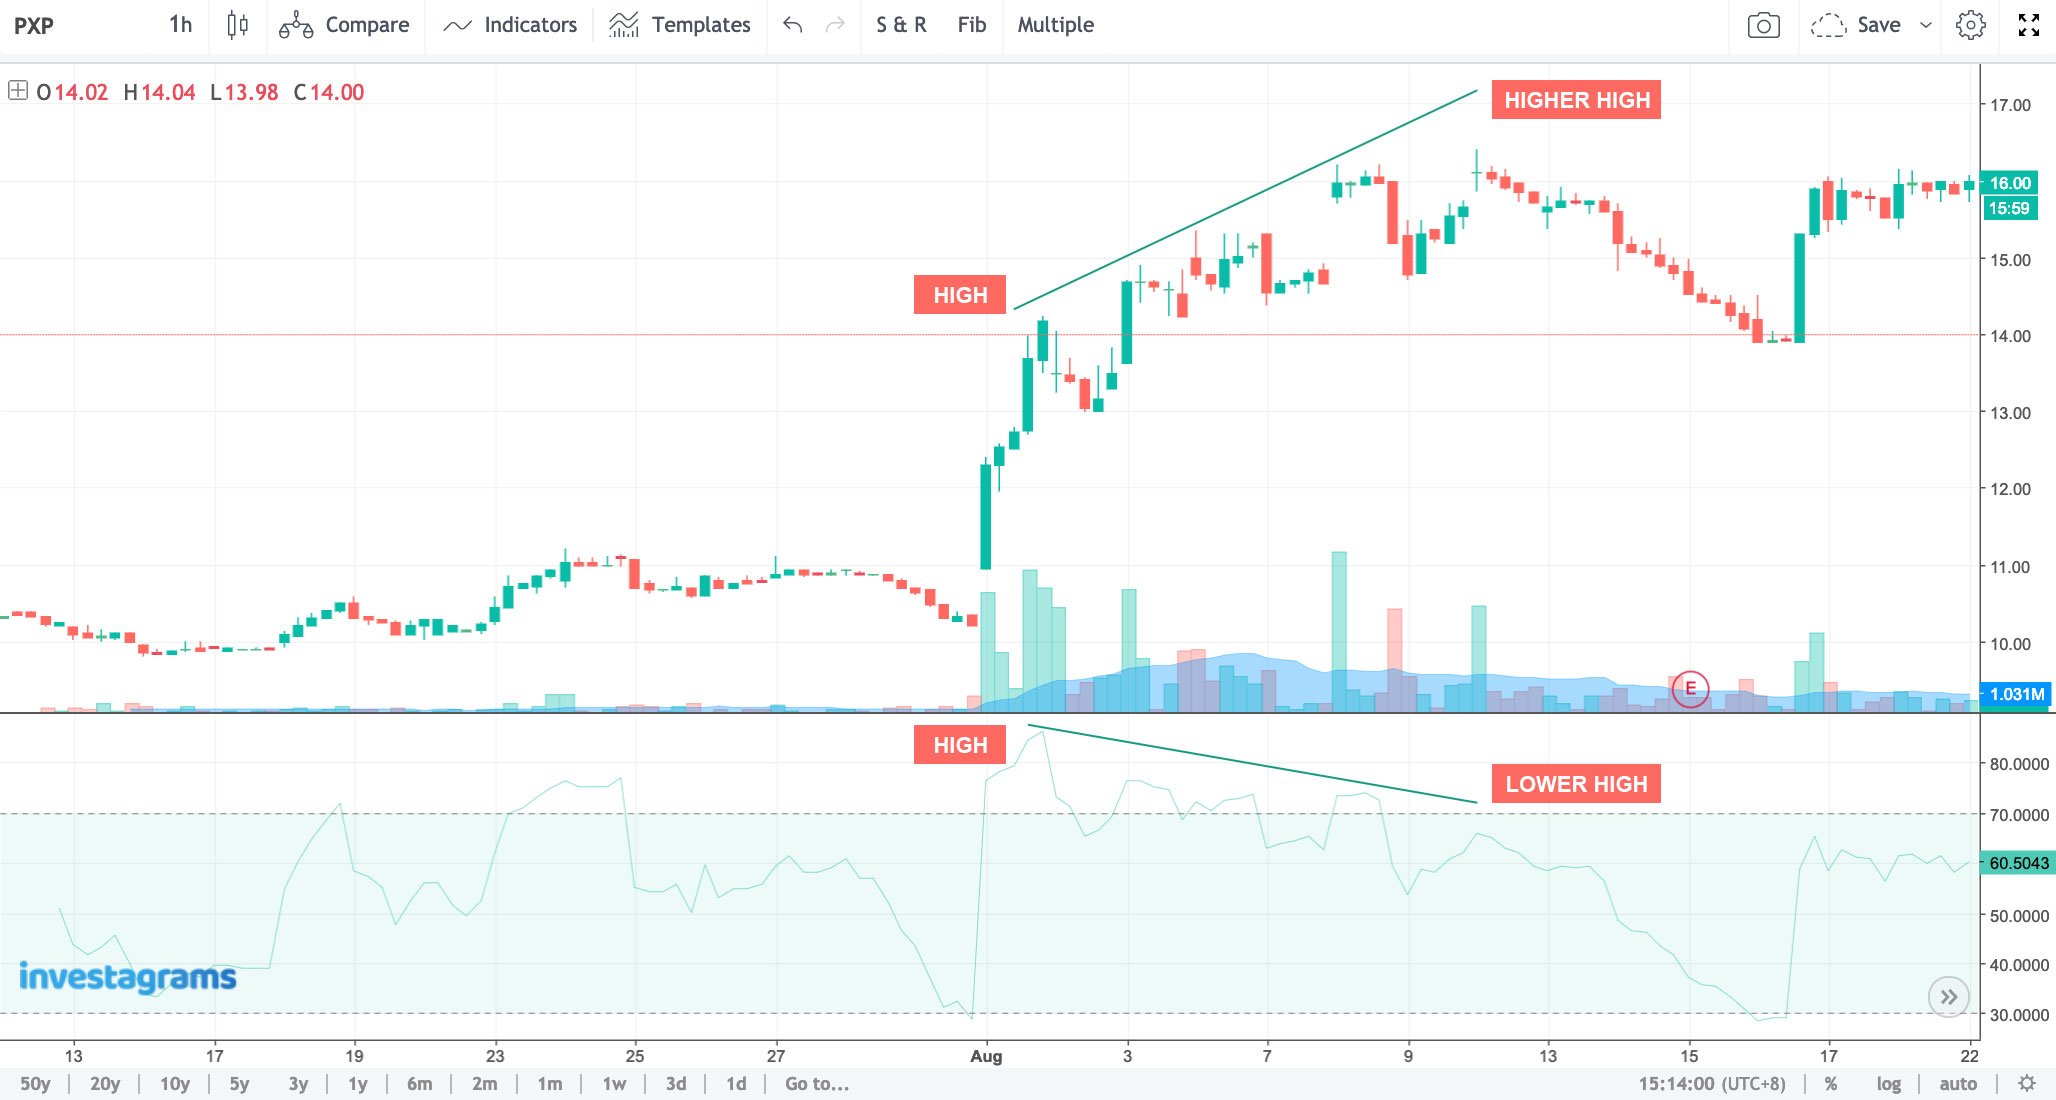
Bearish Divergence
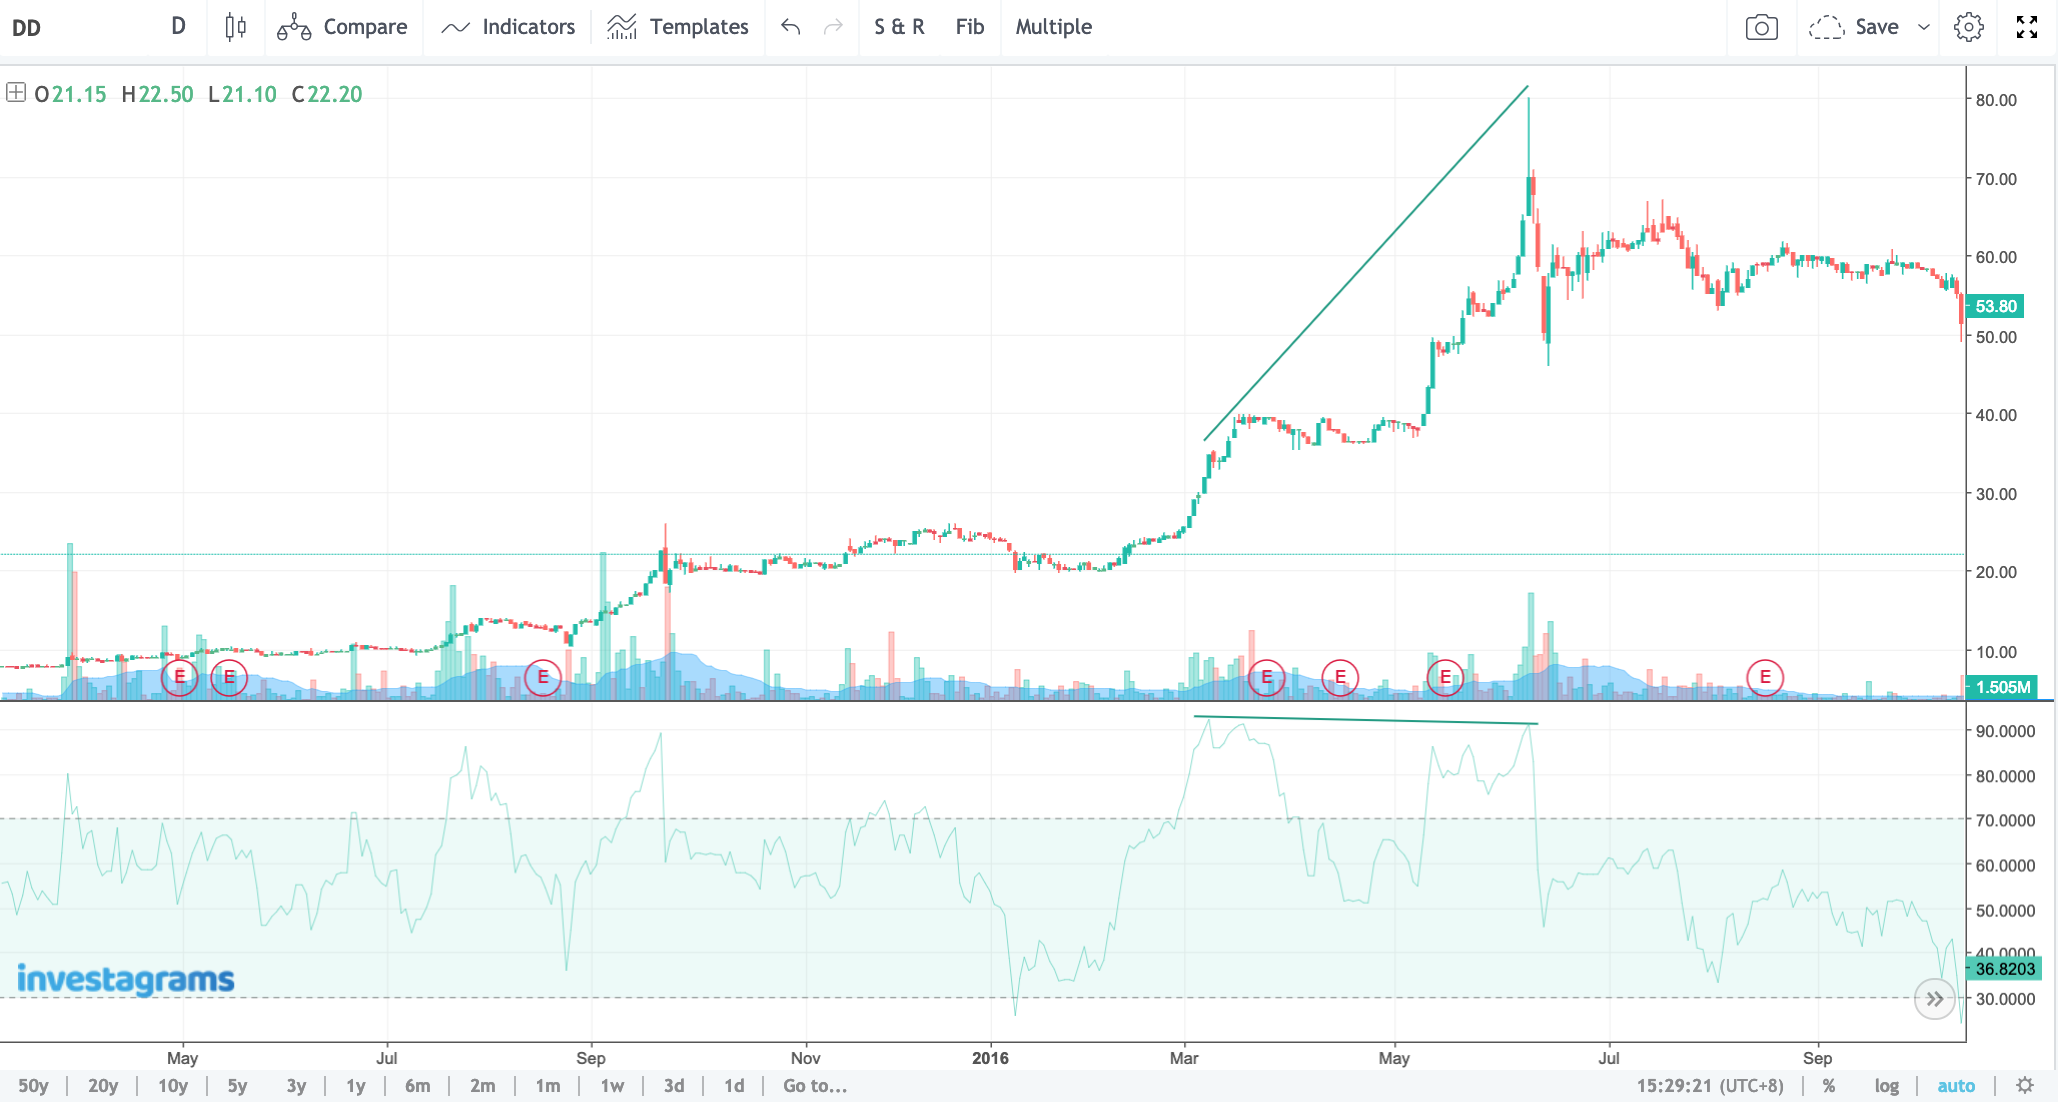
A bearish divergence (sometimes called as negative divergence) happens when price makes a higher high but the momentum indicator makes a lower high which means that the buying momentum was not strong enough to warrant a new high. It could be an indication that buying is waning down, and profit-taking is imminent.
Divergence can be as subtle as the one you can see below. The angle of the slope line may not be as angled as the previous charts you saw. But if you observe closely, the exact RSI reading of the high on the left (RSI = 92.3651) from the high on the right (RSI = 91.4676), it would show that it indeed made a lower high. And as you can see on the right side of the chart, the stock went on to start a downtrend (series of lower lows and lower highs).
Hidden Divergences
Hidden divergences are different from classic divergences. The latter indicates that there could be a reversal (uptrend to downtrend or downtrend to uptrend) to the underlying trend, whereas the former could sign as a continuation in the current trend. The theory of “buying the dips, selling the rallies” may be utilized here.
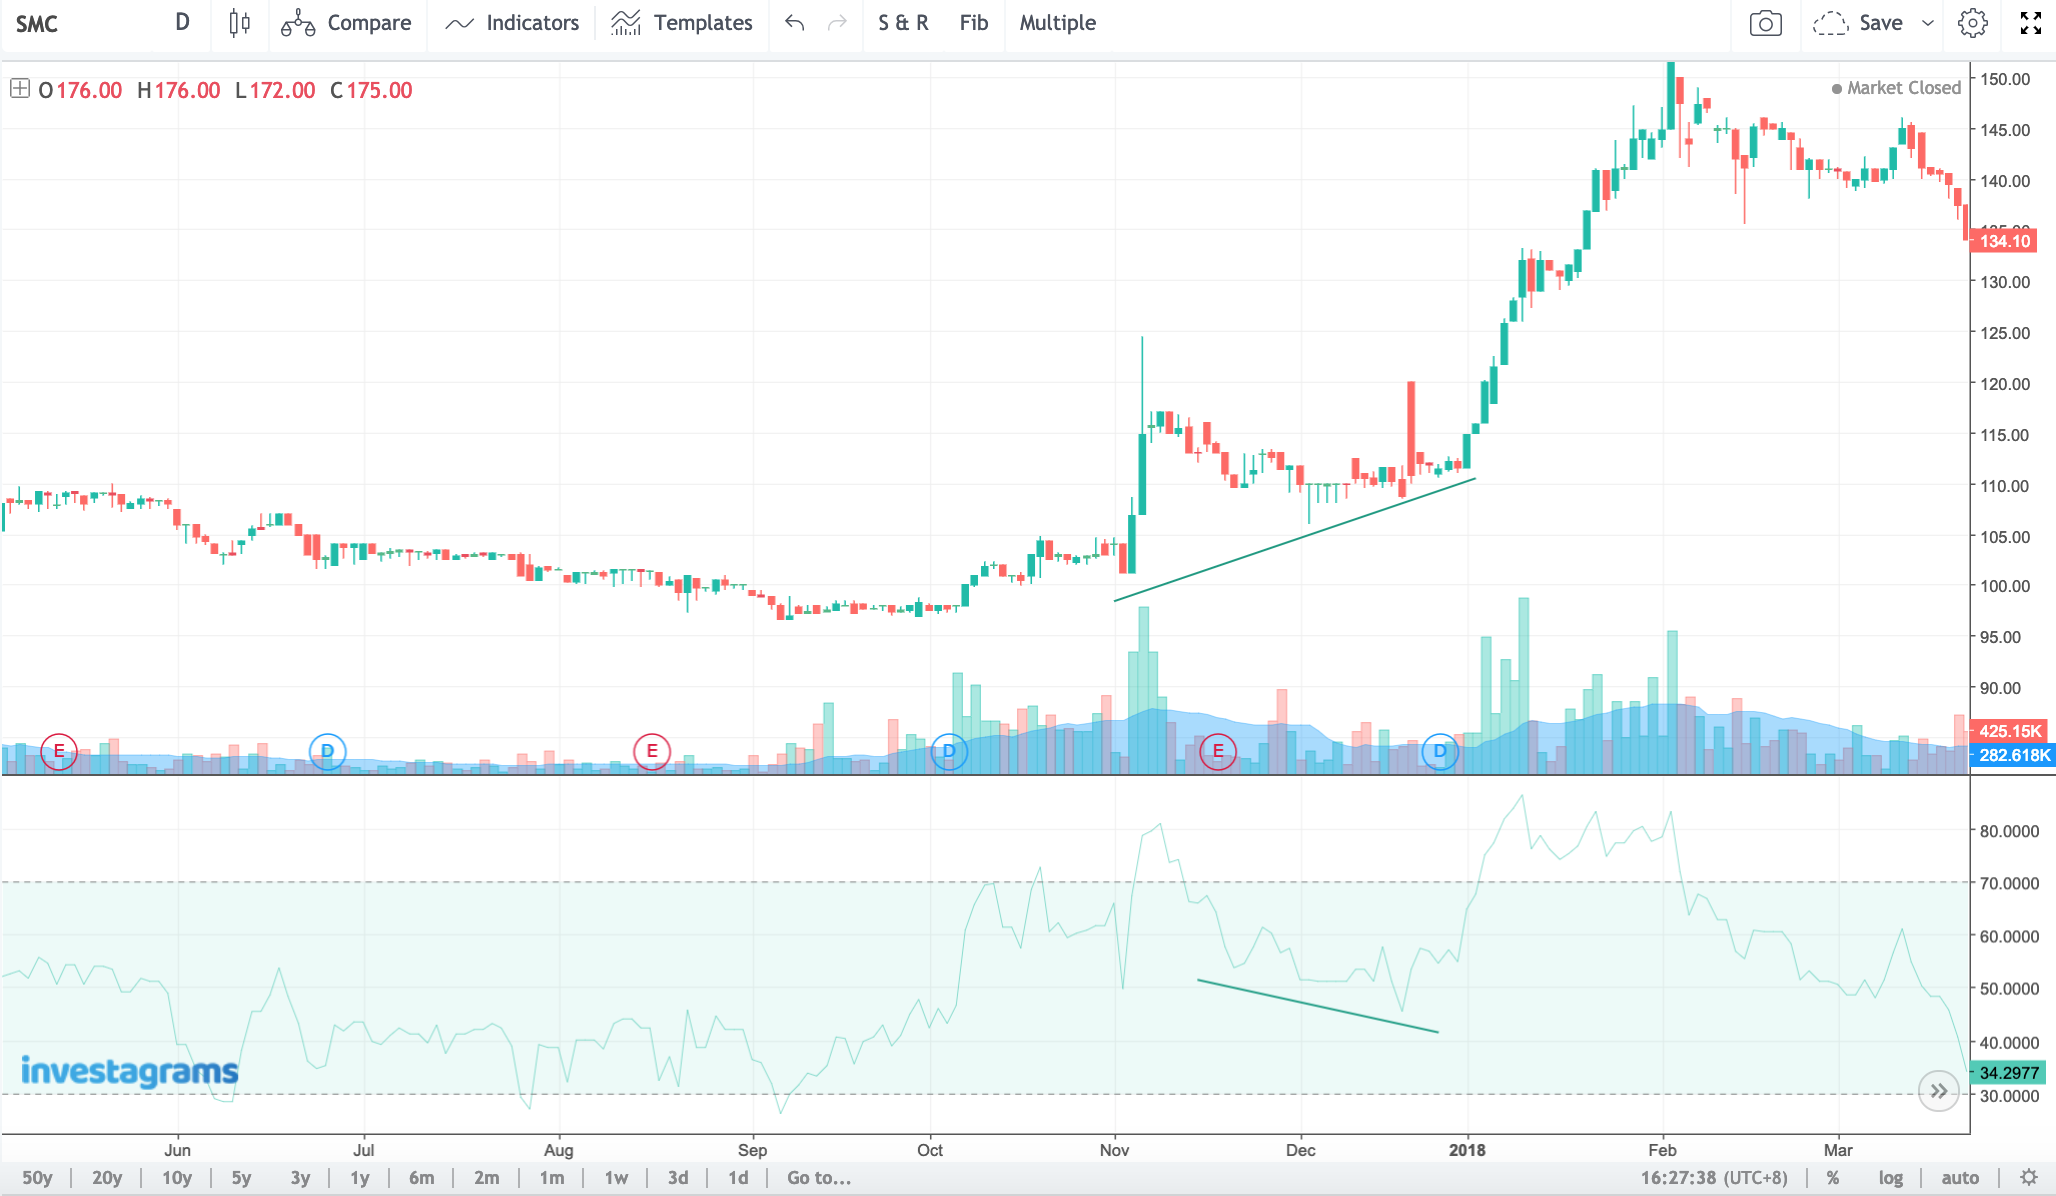
Hidden Bullish Divergence
Hidden Bullish Divergence often found during retracements in an uptrend. As you can see in the chart below, San Miguel Corporation (SMC) is in an uptrend when the hidden divergence is spotted during the pullback in price action. The concept of “buying the dips” can be used here.
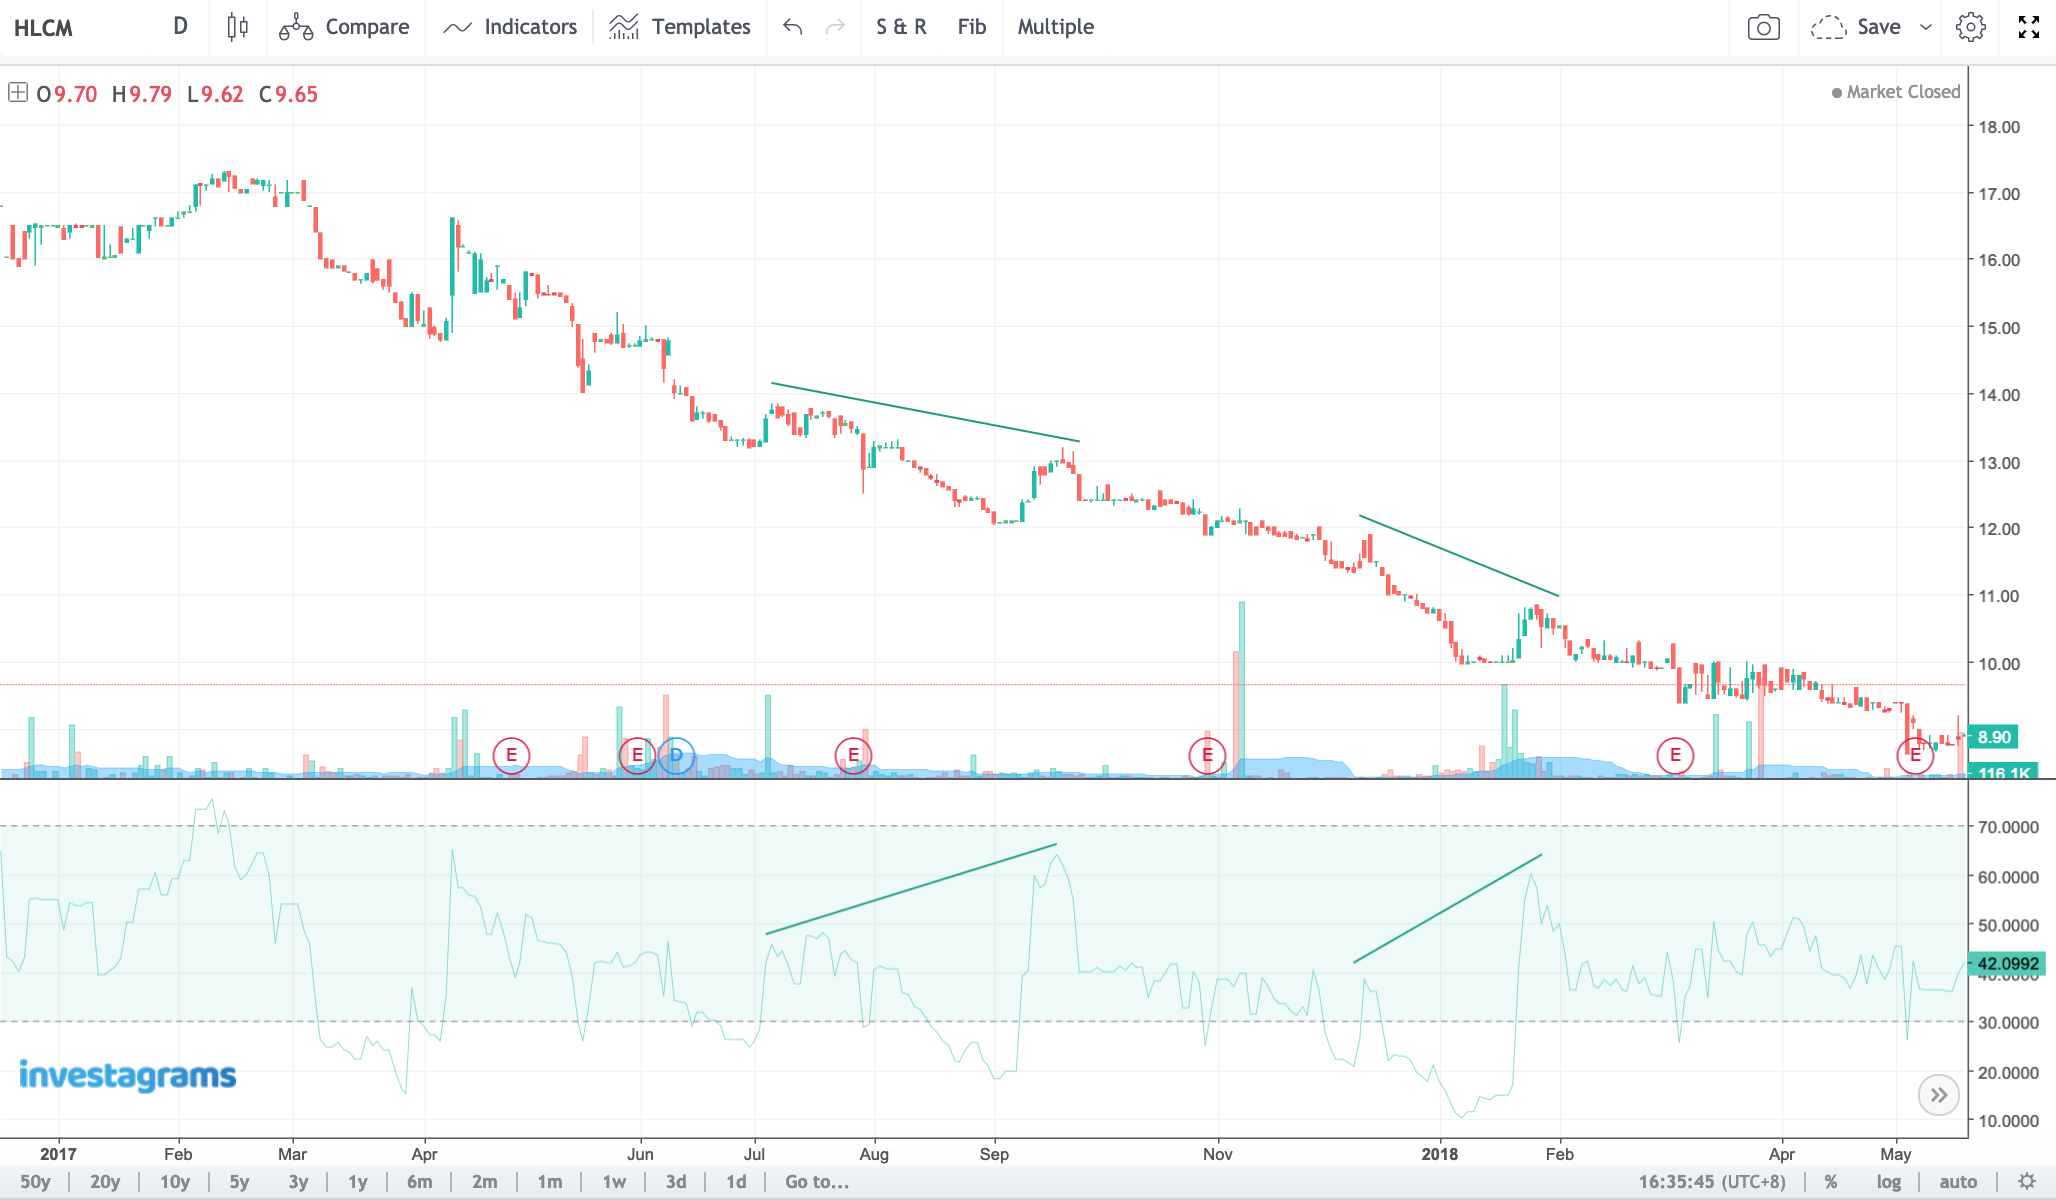
Hidden Bearish Divergence
This type of divergence tells us that there is a strong likelihood that an underlying downtrend will continue. Holcim Philippines, Inc. (HLCM) shows us how this works. We can see that price action made lower highs whereas the RSI created a higher high, an indication of a continuation of the downtrend. The concept of “selling the rallies” can be used in this regard.
Potential Buy and Sell Signals
The RSI can be used to generate entry and exit signals if coupled with other indicators such as the MACD or even just price action itself. If you backtest the divergences above and have a proper grasp of candlestick patterns and support and resistance, then you may utilize the RSI in your favor. It will help you craft your trading techniques so that you would be able to develop your own system to trade the market.
If confused, always remember:
• A bullish divergence (price action gives a lower low, momentum indicator shows a higher low) indicates a reversal from a downtrend. Look for the lows here.
• A bearish divergence (price action makes a higher high, but momentum indicator creates a lower high) indicates a reversal from an uptrend. Search for the highs here.
• A hidden bullish divergence signifies a continuation in an uptrend. Observe the lows here.
• A hidden bearish divergence suggests a continuation in a downtrend. Spot for the highs here.
• Classic divergences are a possible reversal of the underlying trend.
• Hidden divergences are a possible continuation of the underlying trend.
In conclusion
At first, it would be difficult to understand the RSI especially the signals it gives off. It is essential to train your eyes as you progress in technical analysis because it will help you handle future market opportunities, so there’s no reason to rush and get impatient. You won’t be able to memorize all these jargons in one read, so take notes, backtest, and be patient.
3. The last day for registration is on September 23, 2018 (Sunday). Please secure your entry to the competition HERE
4. There are two types of competition passes:
The Regular Competition Passgrants basic entry to the competition.
TheInvesta Booster Pass includes basic entry to the competition and allows you to reach your FULL POTENTIAL:
– DOUBLE the total base cash PRIZE from Php 250,000 to Php 500,000
– BONUS POT PRIZE on top of the base cash prize (the pot increases for each player that joins)
– Three-Part Learning Module containing Fundamentals, Technicals, and Trader Strategy & Profiling
Only 1 entry and account per person is allowed in the competition.
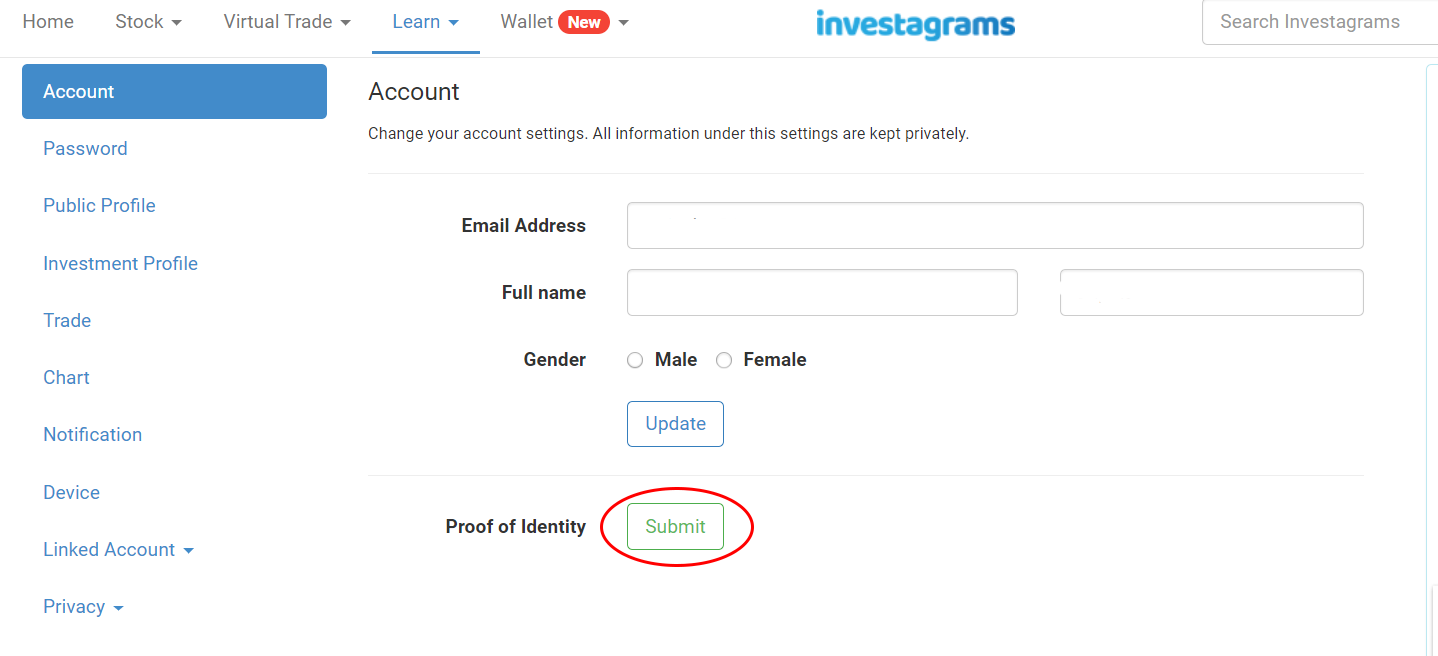
5. After fulfilling your payment through BPI, BDO, 7–Eleven (Coins.ph), or Credit/Debit Card please send a copy of your deposit slip at payments@investagrams.com and upload a scanned image of your VALID ID (Government ID, Driver’s License, Passport, TIN, Unified ID, Voter’s ID, etc.) or School ID (for students) to this link: https://www.investagrams.com/Account/Settings/AccountSettings
6. After fulfilling your payment and sending your receipt and valid ID, we will e-mail you a confirmation for your Investagrams Trading Cup 2018 registration. Please give us 24 to 48 hours to reply considering the influx of entries.
7. Once confirmed, you are on our database already! You will now have access to the trading lobby. The official start is on August 20, 2018 (Monday)— we will send you reminders and further details as we near the competition.
Competition Schedule
The competition starts on September 24,2018 (Monday) and ends on December 28,2018 (Friday).
If you reach the Top 10 of the competition rankings, there will be a required defense where you will be asked to do a brief presentation about your stock picks, strategies and insights for the competition. Winners shall also be awarded on this date. The tentative date of the defense will be around January next year.
The defense presentation is required for all the Top 10 winners but this has NO WEIGHT in determining the winners of the competition. The rankings are based purely on your trading performance. This is more of an avenue where we can get to know you personally before we give out the prizes.
We prefer to meet you in person, but for Overseas Filipino Workers (OFWs) or those who cannot go to Metro Manila (we will confirm your address and situation) during the defense day, you may present through online video call.
How to WIN
1. Each player will start with Php 100,000 virtual money. The goal of the game is simple — trade your account for the whole competition period and aim for the highest profits. The players with the highest rankings while playing within the rules will win.
2. The players will use the Virtual Trading Platform of Investagrams.com which tracks the stock price movements in the PSE. The system automatically calculates transaction fees to make it more realistic. To know more about our virtual trading platform, please visit this link: http://invs.st/InvestaVirtualTrading
3. Players may only trade from 9:30 AM to 3:30 PM, with lunch break between 12:00 NN to 1:30 PM — just like the regular trading hours in the Philippine Stock Exchange. No trading shall be done at the pre-close period of 3:15 to 3:20 PM; the system will resume trading at 3:20:01 PM.
4. Players can only transact using the current prices of the stock, meaning it changes accordingly to the actual market prices. You can only transact Market Orders;you have to monitor the market when you want to buy and sell.
5. Attached below is the list of all the tradeable stocks for the competition:
7. Investagrams has the right to add or modify the rules of the competition to ensure the integrity of the Investagrams Trading Cup 2018. Announcements shall be made if there are any changes. Rest assured, we prioritize keeping the competition as FAIR as possible to all participants.
Prizes
Only the Top 1 to 40 rankings will be announced as official winners, which means that the 40 winners may be a combination of participants with Regular and Investa Booster Passes. There will be no separate rankings for the two types of passes.
Regular Prizes
For those who availed of the Regular Competition Pass.
DOUBLE-UP PRIZES
For those who availed of the Investa Booster Pass.
At one point or another, we’ve all wondered “What is the minimum investment needed in the stock market?” or “How much should I save before investing in stocks?”
Ever since online stock brokers became popular, it seems like the minimum required investment keeps getting lower and lower. That’s good, right? Well, not always.
If you’ve tried stock trading or know someone who has, then you also know that it’s hard to make money in stocks.
There are over 200 listed stocks in the PSE, and literally thousands of factors that could affect their prices. It’s hard enough just keeping track of everything, let alone understanding each stock well enough to make money!
We don’t need to make life harder for ourselves—but that’s exactly what happens when you invest less than 8,000 pesos in the stock market.
A TYPICAL SCENARIO
Nowadays, some brokers won’t require a minimum investment. Others have been also lowering the minimum amount required so that more people can start investing.
While it’s great that this lets more Filipinos invest in the stock market, there’s a scenario that often gets first-time investors off guard.
The typical scenario goes like this:
Person A is interested in investing in the stock market. He finds out that the minimum investment is only 5,000 pesos. “Sulit na! Kikita naman ako dito,” he thinks to himself.
Person A invests the minimum amount and picks two stocks “para mas mababa ‘yung risk.” That’s around 2,500 pesos in each stock.
After successfully buying the stocks, Person A checks his portfolio and “HUH?? Bakit loss na kaagad? Di pa gumagalaw ang presyo ah!”
That’s what happens when people don’t realize that there are fees every time you buy or sell a stock.
BEWARE OF FEES
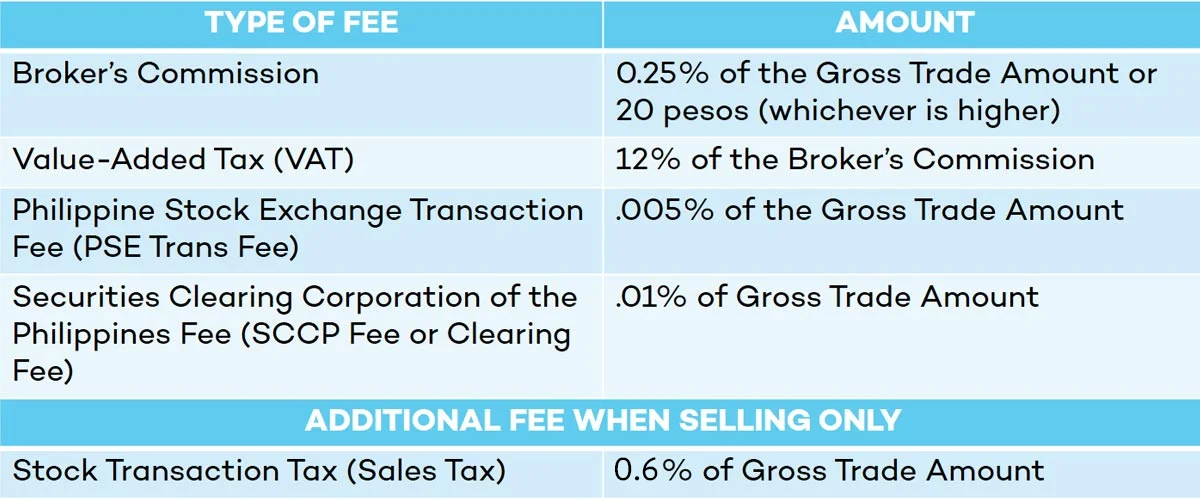
Below is a breakdown of all the fees and charges included in every transaction:
Most of the fees are based on the Gross Trade Amount (number of shares x price), so the cost is always proportionate to your investment. For example, the PSE Trans Fee will always be .005% and the SCCP Fee will always be .01%. However, notice that the broker’s commissionis 0.25% or 20 pesos—whichever is higher.
NUMBERS DON’T LIE
So what does this mean for retail traders? It means you need to avoid buying or selling anything with a Gross Trade Amount less than 8,000 pesos. Otherwise, you will be wasting money on higher commission fees and incurring unnecessary losses.
In the example earlier, Person A bought two stocks, each with a Gross Trade Amount of only 2,500 pesos. This means that Person A’s total commission fees would have been 20 pesos for each transaction, or 40 pesos total. That’s an automatic 0.8% loss on commission fees alone!
But what if Person A invested 8,000 pesos in just one stock? His total commission fee would only be 20 pesos (or 0.25% of 8,000). That means he was able to cut the commission fee in half and invest 3,000 pesos more!
CONCLUSION
We know that saving money can be very hard—especially if you have a family to support. 8,000 pesos is a lot of money after all!
But remember that investing less than 8,000 pesos, means you are losing more money even before there’s any price movement. You can definitely still make a profit, but it’s like stepping on the gas and break pedals at the same time. It will be harder to break even or make a profit.
Weigh the risks carefully before making your decision, and ask yourself: How confident am I that the (potential) profits will offset my (definite) losses?
Subscribe to InvestaDaily for more investing tips and stock market advice, or sign up for Investagrams to access special features to help you reach your first million.