Categories
How to & Advice Latest Posts

Featured Trader of the Week: @skewwyookieson

Let’s give a round of applause to Mercurial for being this week’s Featured Trader! 

Mercurial has only been a member of the Investagrams community since 2020, but that hasn’t stopped him from becoming a very active member. He constantly shares his own views and opinions on his trades, and really anything happening in the markets.

A couple of weeks ago, Mercurial posted one of his trades in PSE:EMP. Emperador is a liquor company that mainly sells brandy products famously known in the Philippines for being affordable, but still great for hangouts. Mercurial saw an opportunity to trade a reversal, and his preparation and efforts paid off as PSE:EMP had a strong price run recently.

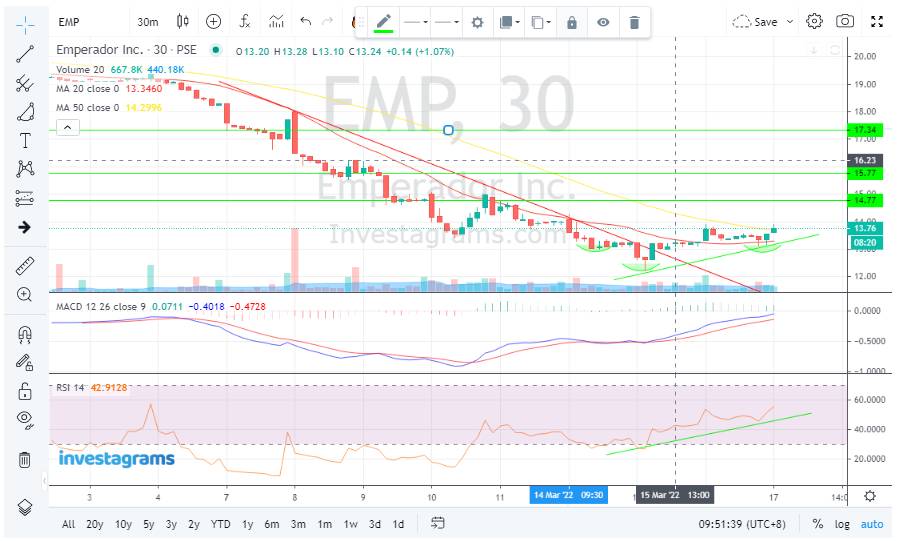
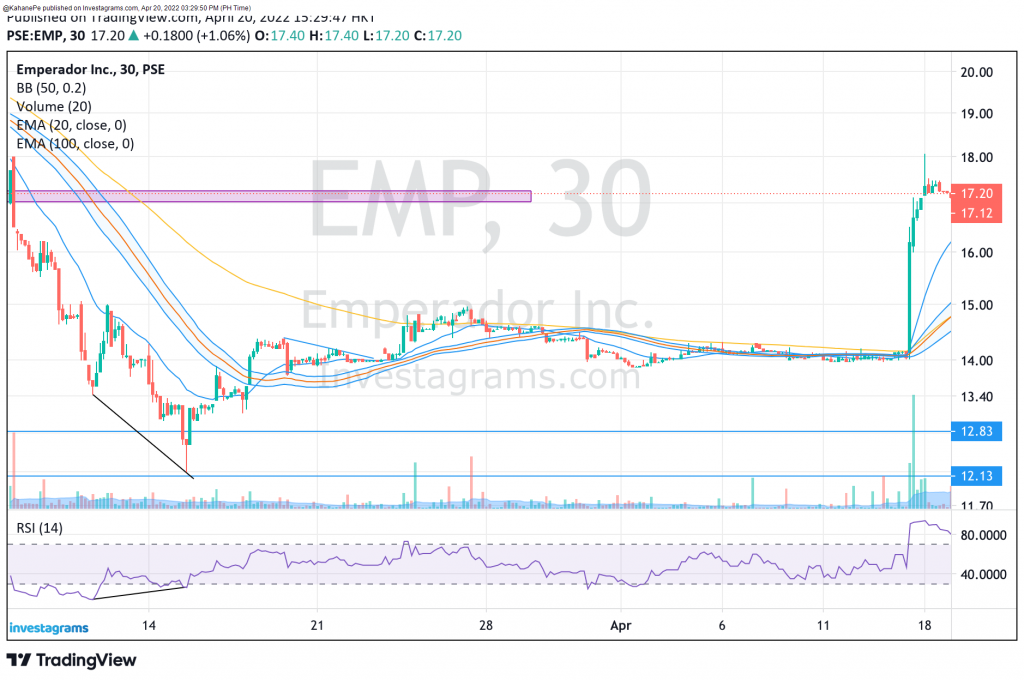
After a broad market sell-off, select stocks started to bounce back. PSE:EMP took a bigger beating than the rest as the stock experienced multiple days of big red candles. The downward momentum was very strong until price hit a brick wall at the 12.00PHP/sh support level. The stock then experienced an onset of buyers, forming what looked to be a reversal. Although it took a while after the technical pattern formed, PSE:EMP completed an inverse head and shoulders pattern and broke out all the way past 17.00PHP/sh price levels.

TECHNICAL STANDPOINT

In terms of price action, PSE:EMP came from a strong downward move. As the price was going down, traders started to wonder when the stock would bounce. After a long while, hope came when a bullish divergence appeared right as PSE:EMP right as prices came into the major resistance around the 12 peso per share area. As prices started bouncing back, an inverse head and shoulders was forming. Usually a sign of a reversal, an inverse head and shoulders is completed when the neckline resistance is broken. It took a while for the stock to really surge after breaking through the neckline, but the wait was worth it as the stock price reached levels as high as 17PHP/sh. This is the ideal target for PSE:EMP as this was a resistance level where a lot of trading volume occurred.

FUNDAMENTAL STANDPOINT

PSE:EMP is the liquor company of Andrew Tan’s Alliance Global Group. A staple in the Philippines, Emperador is well known for its product Emperador Light, an affordable brandy that is in almost every inuman in the Philippines. Aiming to grow bigger, Emperador is planning to go global as they will introduce their products to new markets. In order to fund their efforts, they will do a secondary listing, but on the Singapore Exchange, where they expect to raise up to PHP1.5B through proceeds.

What should be my next step?

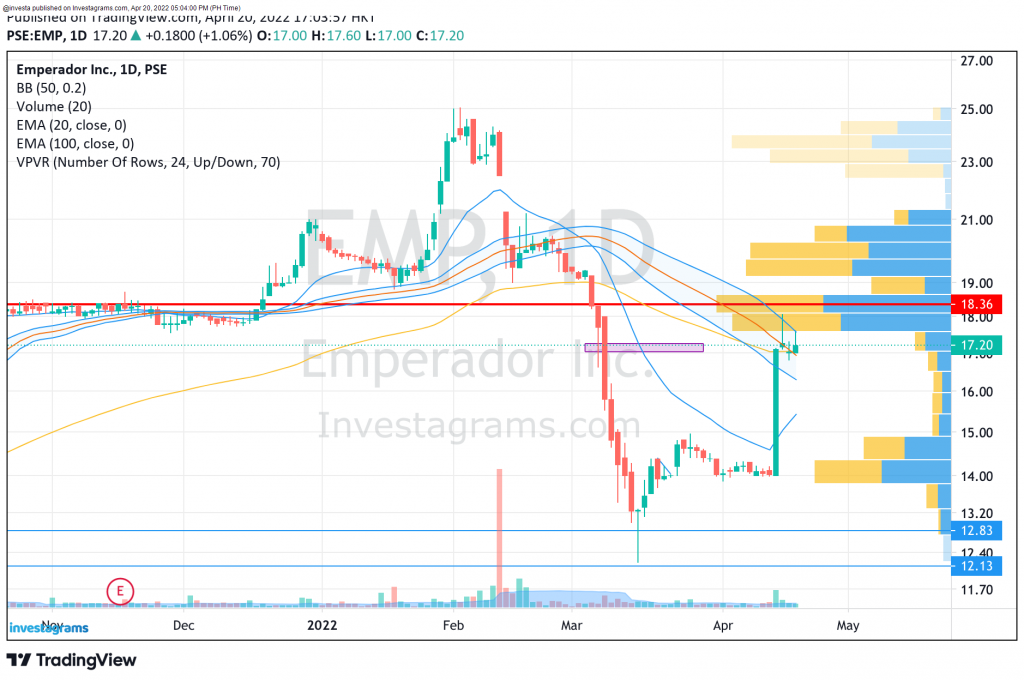
As PSE:EMP is already at a big resistance level where a large amount of transactions occurred, many are already looking to lock in profits, or maybe even sell all of their shares. For those who haven’t gotten any shares yet at lower prices, it might be wise to wait and see how the markets will unfold in the coming weeks. As there are a lot of headwinds for the Philippine Stock Market, there is a lower chance for breakouts and surges to keep on moving in the same direction as compared to when we are in a bullish environment. The key behavior to look out for should you want to enter, or re-enter, in PSE:EMP would be to see how prices are reacting around the major resistances from PHP18.00 – 20.00. The best case scenario would be for prices to consolidate above broken levels and to possibly creep up higher in anticipation of the company’s foray into the global market.

Once again, KUDOS to Mercurial for being this week’s Featured Trader! Enjoy your 14-day InvestaPrime Access and continue to be an inspiration to the trading community.


Categories
How to & Advice Latest Posts

Busy for Trading? This is the key!

“Saka na ko mag-iinvest, kapag ‘di na busy.”

Isa sa pinakamalaking dahilan kung bakit ang komplikado at overwhelming ng pag-iinvest ay dahil napakarami nating options. From stocks and bonds, to real estate or money markets — madalas natin marinig ang mga ito; pero mahirap pumili kung ano ang makakapag-guarantee sa atin ng good returns. Plus, madami sa atin ay busy sa work, kaya hindi tayo makahanap ng oras para mag-aral ng mga ito.

Pero ka-Investa, what if we tell you: pwede ka na mag-invest nang hindi naglalaan ng napakalaking oras at effort through mutual funds? 

“Pero paano ba ako magsisimula?” “Mutual funds? Ano ba yan?”

Essentially, mag-aambag ka lang, kikita ka na. No joke.

Nagwowork kasi ang mutual funds sa pamamagitan ng pagtitipon tipon ng pera ng mga investors. Ang funds na natipon ay siyang i-iinvest sa mga assets tulad ng stocks, bonds, money market, at iba pa. 

“Ha, so paano ko mahahawakan ang pera ko?”

Good question, ka-Investa! Ito actually ang rason bakit swak ang mutual funds sa mga busy na tao — ang pera sa mutual funds ay hinahandle ng professional fund managers. Sila ang bahala sa pagpapalago, at ginagawa nila ito sa pamamagitan ng pag-iinvest sa iba’t ibang nasabing securities. 

Ngayon, ang tanong mo siguro: “paano ba ako kikita?”

Kapag tumataas ang value ng mga securities ng mutual funds, dito ka ngayon kikita. Sa madaling salita, kapag may mutual fund account ka, nagiging part-owner ka ng mga investment securities ng mutual funds. Kaya’t kapag kumita ang mga securities na ito, ikaw din ay kumikita.

Ngunit shempre, gaya ng ibang investments, may risk din ang mutual funds dahil nag-flufluctuate ang value ng investments.

At shempre, kailangan alam pa rin natin kung ano ba talaga ang goals ng investment natin. 

“Long-term o short-term investment ba ito?” ”Kailangan ko ba ang pera, if in case may emergency?” Ilan ito sa mga tanong na kailangan mo sagutin bago ka mag-invest. 

Lagi natin tatadaan na walang 100% sure return, ngunit malaki ang possibility na kumita tayo kung alam natin ang objectives natin, at pinaplano natin ito.

Pero at the end of the day, ang maganda sa mutual funds ay pwede ka mag-diversify, at kapag bumaba ang value ng isang stock, maliit lamang ang epekto nito dahil diversified ang portfolio. Kaya in the long-run, pwedeng masabi na sustainable ang mutual funds.

Ka-Investa, kung may oras tayo mag-scroll sa social media, then dapat kaya din natin mag-laan ng oras sa pag-iinvest. Kailangan lang natin alamin kung saan tayo magsisimula.

Kung nagustuhan mo ang article na ito, don’t worry kasi marami pa kaming i-rerelease tungkol sa mutual funds and investing. Mananatili kaming andito, hangga’t matulungan namin ang lahat ng Pilipino sa kanilang investment journey.


Categories
How to & Advice Latest Posts

Why You Need to Diversify Your Portfolio Now

Ever heard of the term diversification? A common phrase heard in the financial world is “diversify your portfolio”. Many have heard it and the next phrase would come up, “is it important?” It’s actually key for most financial successes. So, let us explain why.

Diversification is the practice of spreading your investments around so that your exposure to one type of asset is limited. Essentially, if you have your money all-around, you’ll be able to cushion yourself for riskier investments with safer ones. By diversifying your portfolio, your risk and reward in your investment portfolio would be more balanced.

It reduces risk and is designed to help reduce the volatility of your portfolio over time. Most investment professionals agree that diversification is the most important component of reaching long-range investment goals while also minimizing risk.

Balancing a diversified portfolio may be complicated and expensive but there are many options to widen your diversification without having a difficult time. These options are specially designed for beginners or for people who would like to be more hands-off with their portfolio.

A great example would be found in mutual funds. There are so many choices to mutual funds to fit your preferences, goals, and needs. By investing in mutual funds like real estate funds, sector funds, and commodity-focused funds, you will instantly have a diversified portfolio.

Because market risk is generally unavoidable, diversification is a great way to soften the blow. In practical terms, diversification is holding investments that will react differently to the same market or economic event. Being able to invest in different assets reduces the consequences of a wrong forecast. This is very important in investing because markets can be volatile and unpredictable.

With this practice, you’ll be able to spread your risk across different types of investments, the goal being to increase your odds of investment success.


Categories
How to & Advice Latest Posts

Short-Term Investments You Can Start Now

Do you have liquid assets you want to see grow? Short-term investments might be exactly what you’re looking for. A short-term investment is a temporary investment that can be easily converted to cash. These investments are typically stored between 6 months to 5 years. The end goal of this type of investment is to gain more money quickly mostly through a passive income.

MONEY MARKET FUNDS

Money market mutual funds are a type of mutual fund that invests in low-risk and short-term debt securities. This is definitely a good choice for liquid assets because it still earns small returns without having to wait a long time. This type of fund takes about 6 months to 1 year to mature. It’s considered one of the least risky investment options because of its high liquidity.

Some of the things that need to be taken into consideration with looking into which money market fund options might be right for you are the minimum investment needed, the administrative fees, the maturity period, and the early withdrawal fees.

TIME DEPOSITS

Another good investment option is a time deposit. Time deposits are a kind of bank account that earns a fixed interest over a period of time. During the specified term, the money cannot be withdrawn. In some cases, it can be withdrawn with but it will have an early withdrawal fee.

The selection of lock-in periods can range from 30 days to 5 years. Interest rates of time deposits are higher than savings accounts. This could be a good investment if you have passive money that you would like to grow. Just like savings accounts, these are options often given by traditional banks but digital banks have better rates.

STOCKS

Investing in stocks can be for the long-term or for the short term. Short-term stocks mean more attention but with the right research, you should be able to get a good return. A disclaimer would be that stocks do not always guarantee a return.

Some things to consider when looking for short-term stocks would be the stability of the company and understanding the risk involved for each stock bought. If you would like to learn more about stock trading and the stock market, definitely check out the free lessons at Investa University.

ONLINE SAVINGS ACCOUNT

The most common option in this list would be a savings account, more specifically a savings account opened in a digital bank. To be honest, traditional banks’ savings accounts often provide the worst interest rates. Instead of investing your money there, look for higher interest rates in digital banks.

Digital banks can offer fewer fees which means more profit for the customers. Some things to keep in mind when looking for an online savings account would be to make sure they don’t have a minimum deposit, check if they have fees per deposit, and no hidden fees.

Remember Ka-Investa, there is no better investment — only the one that fits your lifestyle. Whatever you choose among all of these, the most important thing about investing is to START NOW.


Click the photo to join


Categories
How to & Advice Latest Posts

Financial Ratios for Beginners

Introduction 

  • What are Financial Ratios? 
  • What are they used for? 

Examples of Financial Ratios 

  • P/E Ratio 
  • EPS 
  • ROE 
  • PEG Ratio 
  • Dividend Yield 

Experienced investors and bankers talk about Financial Ratios all of the time. You may be familiar with a couple of them like P/E Ratio and EPS, but have no idea what picture they paint. Financial ratios are values derived from financial statements to come up with useful information about a company.

The numbers from the financial statements are used to conduct quantitative analysis and assess a variety of things such as growth, profitability, rates of return etc. The information derived from these ratios would help you create decisions and more accurately predict the performance of a stock. 

There are a lot of financial ratios out there, financial analysts and accountants may use every single one of them everyday, but to help you ease into the concept of Financial Ratios it would be best to focus on these five financial ratios: 

P/E Ratio 

This is perhaps one of the best and most used financial ratios. If P/E Ratio seems familiar to you, maybe it’s because it’s commonly shown in the stock’s summary along with other useful information such as the Open, Close, Market Cap, and Volume. The Price/Earnings ratio is used to value a company by comparing its current share price to its per-share earnings or EPS which we would discuss later.

This can be used to compare a company to its historical record. A high P/E ratio signifies a company’s stock is overvalued, meaning investors are expecting high growth rates. Companies that have a net loss do not have a P/E ratio since nothing would be put in the denominator. 

EPS 

EPS is another common financial ratio because it tells us about the company’s profitability. Earnings Per Share is derived by dividing the company’s profit by the outstanding shares of its common stock. A company with higher EPS means that it is considered profitable. Investors consider stocks with higher EPS as stocks of greater value since the company has shown to have higher profits relative to its share price. EPS can be in different forms such as excluding extraordinary items or discontinued operations, or on a diluted basis. 

ROE 

Return on Equity calculates a company’s financial performance by dividing net income by the shareholders’ equity. ROE is a measure of profitability in relation to the stockholders’ equity. An ROE value of a particular stock is good or bad depending on the ROE of similar stocks. The rule of thumb is to

target the ROE that is just above or equal to the average. Growth rates and dividend growth rates can also be estimated ung ROE. 

PEG Ratio 

The price/earnings to growth ratio is one of the more unheard of financial ratios as compared to the ones that I have talked about. The PEG ratio is derived by dividing the P/E ratio by the growth rate of its earnings for a specific period. The PEG is useful in determining a stock’s value while also considering the company’s expected earnings growth. It is considered to give a better picture than just the P/E ratio. The difference between the two is that the PEG ratio adds in expected earnings growth into the formula. It is usually used as an indicator of a stock’s true value. 

Dividend Yield 

This financial ratio shows the amount a company pays out in dividends per year relative to its stock price. This is a very good indicator for investors who are looking to position themselves for the long term. Compared to the other financial ratios, this financial ratio is more straightforward in what the result of the ratio tells us. It is worth mentioning that higher dividend yield doesn’t automatically equate to a good investment opportunity as high dividend yield can be attained by declining stock prices. 

In sum, just like indicators and many investing strategies, different financial ratios are more useful to specific types of investors. These are very useful when making decisions and add an extra layer of thought before going into a position. These tools provide an inside glance at the position of the company you are going to invest on. What technical analysis and fundamental analysis cannot predict may be seen when comparing these financial ratios.


Categories
How to & Advice Latest Posts

Do I Need a Trading Break?

When we want to do things for a prolonged period of time, it is necessary that we take the appropriate amount of breaks at the appropriate times. But how exactly would a trader determine when to take a break when the markets trade for 5 days a week? Before we move on to the “when”, let us first discuss the “why”. 

For starters, taking trading breaks is necessary for the long term sustainability of your trading. Let’s say that you are on a losing streak  and you are trying to decide whether to take a break or not. On the one hand, taking a break for one week will let you evaluate your system.

On the other hand, continuing to trade despite your losing streak might be what you need in order to end the streak. Although continuing to trade might sound like a compelling option, there is a possibility that you’ll end up with more losses thereby by lowering your spirits which eventually leads to the end of your trading journey.

Journaling

Now that we have established the importance of taking breaks, let us discuss exactly when you should take breaks. It is worth noting that these tips are only possible through journaling or the act of recording your trades. You can use anything from Investajournal to simply using a notebook to record your trades as long as the journal contains your entry and exit prices as well as your entry and exit reasons. Now that we have our journal, we must discuss two important metrics: VAR (Value at Risk) and Exit Notes.

Value at Risk

Value at Risk (VAR) is actually a statistical measure used by financial institutions in order to determine the risk involved in a certain portfolio. However, in the context of retail trading, VAR pertains to the amount that you are risking relative to the size of our portfolio. So lets say that you have PHP 100,000 in your portfolio, 1 VAR is equal to PHP 1000. This means that if a trade involves the risk of losing PHP 1000, then you are risking 1 VAR. 

So how can we use VAR to determine when to take a break? Well, it can be as easy as taking a break when you are down 10 VAR. This means that if your initial capital of PHP 100,000 has turned to PHP 90,000. This is the perfect time to take a break because it shows us that there is something wrong with our system. Losing 10% of your portfolio is not something that you should take lightly. This requires an evaluation of your system that usually entails virtual trading and continuous learning. 

Another metric that you can use is if you lose 5 VAR in consecutive trades. So if your capital is PHP 100,000 and you raise it to PHP 120,000 but lost PHP 5000 in consecutive trades (net PHP 115,000), then maybe there’s something happening to the market that requires you to adjust your system. In summary, you can either take a break when you’re down a certain number of VAR from your capital (regardless of win/loss ratio)  or you can take a break when you lose a certain number of VAR to consecutive trades. 

Join the INVESTAFEST2021 FOR FREE. Click the photo to register.

Exit Notes

Aside from the amount that we gain/lose, we also have to look at WHY we lost/gained money. Basically, if you are losing for the same reasons (e.g. failed breakout, whipsaw) then maybe you need to adjust your system in relation to that.

An example is adding Average True Range (ATR) to your system to avoid further whipsaws. It’s easy to say that you don’t need to take a break to adjust your system but in reality, you cannot be objective with your trading setup if you have open positions.

Conclusion

It does not matter if you are a beginner or an experienced trader, everyone goes through losing streaks. In the end, we have to remember that bouncing back from losing builds character which is the primary tool that we need in order to find success. However, you do not need (nor should you)  bounce back right away. Oftentimes, a break is necessary in order in order to avoid making the same mistakes that brought us to our downfall in the first place.

Categories
How to & Advice Latest Posts

Bottom-up Approach: An edge to navigate the markets

Amidst the Stock Market crash across the globe last March of 2020, novice traders have turned a blind eye in the markets since then. It somehow makes sense. The pandemic has caused tremendous financial damage across the world.

Although, the financial markets, especially the US stock market, started to rise a few days after the market crash of 2020. In the context of measuring the March low and the September high, the $NDX rose 84%, the SPX rose 63.5%, and the DJI rose 61%. Within six months, the stock market presented loads of opportunity to those traders who used the Bottom-up Approach to navigate the markets.

As introduced by Mark Minervini in his book “Trade Like a Stock Market Wizard: How to Achieve Super Performance in Stocks in Any Market, ” the Bottom-up approach is a type of method in selecting a stock. It is where a market participant shifts their focus on individual stocks first, then its respective industry group or sector, then its separate market index.

Through this approach, the index and any adverse event do not discourage the market participant from trading. If you have applied this method during the April recovery, then the said trader would have maximized the US market’s up move.

Figure 1: Example of a VCP pattern

The key to identifying market leaders through the bottom-up approach is to spot names hitting 52wk highs or All-Time highs exhibiting a VCP pattern in its price behavior. It is a pattern that displays contraction in its volatility from its previous data to the following or present data.

Moreover, the said stock should be in the confluence of a surge of volume when creating a new move on the upside. Various names that have hit such parameters in a respective sector will often be the leaders.

Also, during a bear market, spotting names that are creating new highs with enormous volume, while the market is doing otherwise, is a good indication that when the bull market comes, the stocks that were unveiling such features are bound to become the overall market leaders for that period. They correct the least during a general market correction and rebound the fastest during a market recovery.

On the other hand, the Top-down approach is the opposite of that of the Bottom-up approach. This method’s problem is that a market participant gets discouraged from the overall indices and market sentiment. The top-down approach would limit the trader from the outliers or the potential market leaders that would move oppositely to its respective index.


LEARN STRAIGHT FROM THE EXPERTS FOR FREE! JOIN THE #INVESTAFEST2021 NOW.


If a said market participant adheres to the Top-Down approach, the chances are that the specific trader has loosely participated in the April 2020 rally. Wherein, these types of traders may have only grasped 5% of the overall opportunity that was offered by the financial markets.

There is no right or wrong approach to trading the financial markets. As Mark Douglas always exclaims, trading is an activity that offers the individual unlimited freedom of creative expression. Although aspiring market participants should be aware of the pros and cons of both methodologies.

Although professional traders use the bottom-up approach, wherein a trader does not rely on the opinions of other market participants; instead, they rely on their own bias towards individual names. 

Are you a trader who employs the Top-down approach or the Bottom-up approach? Let us know in the comments section below!

Subscribe to our Newsletter

Join our mailing list for investing tips and stock market advice
to help you reach your first million.

You have Successfully Subscribed!