With the increasing number of competitions available to the public, newbie traders might be wondering whether or not joining a competition may offer significant advantages as opposed to sticking to virtual trade. With Investagrams, the platforms for virtual trade and competitions offer similar features. They both offer a way to trade with virtual cash while using real time data which simulates real time scenarios without the risk of losing capital. Obviously, competitions give you the chance to win prizes. But the advantages of joining competitions extend beyond monetary value.
Thinking Long Term
The advantages you can get from joining competitions mostly revolve around your discipline as a trader. When joining a competition, you are encouraged to look beyond short term gains and onto sustainable growth. This forces you to protect your capital through proper position sizing and appropriate exits. Although you can do this through virtual trade, it is very easy to just reset your account or to lose interest in your virtual trade portfolio if you get a losing streak. It is important to note that competitions are marathons, not sprints because local competitions usually last for around 4 months. This means that no matter how much gains you get with one trade, if you can’t sustain this growth then you’ll most probably get overtaken by your competitors.
Beating the Market
Competitions also encourage you to push yourself beyond merely being profitable to actually being more profitable than the rest of the market. Of course, there are ways to do this through virtual trading such as setting a monthly goal or using the index to track your performance. However, these goals are not as dynamic as directly comparing yourself to similar traders at the same level. Having the ability to compare your performance to other traders in real time will have you constantly searching for high probability trades instead of passively riding on trending stocks.
Being Part of a Community
Aside from prizes and technical benefits, you also get a better sense of community. For example, Investagrams’ group feature offers a way for Trading Cup 2020 participants to share their learnings and insights throughout the whole competition. Because competitions let people have the same initial capital as well as the same restrictions on the number of trades per day and lock in periods, all participants effectively start on the same level which makes it easier for participants to relate to each other. Ideally, this behaviour will spillover to the whole trading community even after the competitions end.
Overall, joining a competition offers a good benchmark on whether or not your strategy is optimal. If you find yourself underperforming compared to your competitors, then you may want to realign your learnings and backtest your strategies in order to find the optimal system for you. However, if you find yourself performing better than others, then maybe you should think about transitioning to using a real portfolio with real cash or maybe even consider a career in professional fund managing. Joining a competition is truly a great opportunity that newbies and intermediate traders alike should not pass on.
It’s time to challenge yourself.
JOIN THE BOUNCE BACK CHALLENGE, be hailed as the INVESTACUP 2020 CHAMPION, and get a chance to win awesome prizes — PRIZE POOL NOW PHP 500,000!
Have you ever seen a stock gain upwards of 20 percent in one day? If so, you probably ignored it since you may have thought that there is no possible way for the price to go up any further. Or, maybe you rode the hype only to be disappointed by losses after a few days. However, as you check the top gainers three to four days after the first 20% gain, you see the same stock rise up another 10 percent! What causes this phenomenon? And more importantly, how can we capitalize on this market behavior?
The momentary drop of a stock’s price is called a retracement or a pullback. Retracements are caused by traders or investors taking profits from the big move prior to the retracement. This behavior applies to both large trends as well as big moves in the intraday time frame. The momentary drop in stock price gives us traders the chance to enter the stock at support levels at a relatively lower risk. But what happens if the supports are too far away? How can we anticipate the reversal point of the retracement?
The Fibonacci Retracement
The fibonacci retracement tool indicates potential support and resistance levels of a stock. The name comes from the fibonacci sequence also known as the golden ratio. However, in the context of trading, we only need to familiarize ourselves with the tool and not on the sequence itself.
Using the tool is as simple as tracing the bottom of the move all the way to the point before the start of the retracement. After this, fibonacci levels (50%, 23.6%, 38.2%, 61.8%) will appear as colored bars within the range that you traced. Once the levels are visible, you may observe the different levels for confirmations of support. Alternatively, tracing a big downward move from the top to the bottom will show you potential resistance levels. Of course, this tool is best used together with other momentum indicators in order to validate the price reversal. In addition to this, a fibonacci level may show additional strength when it is in line with a significant moving average.
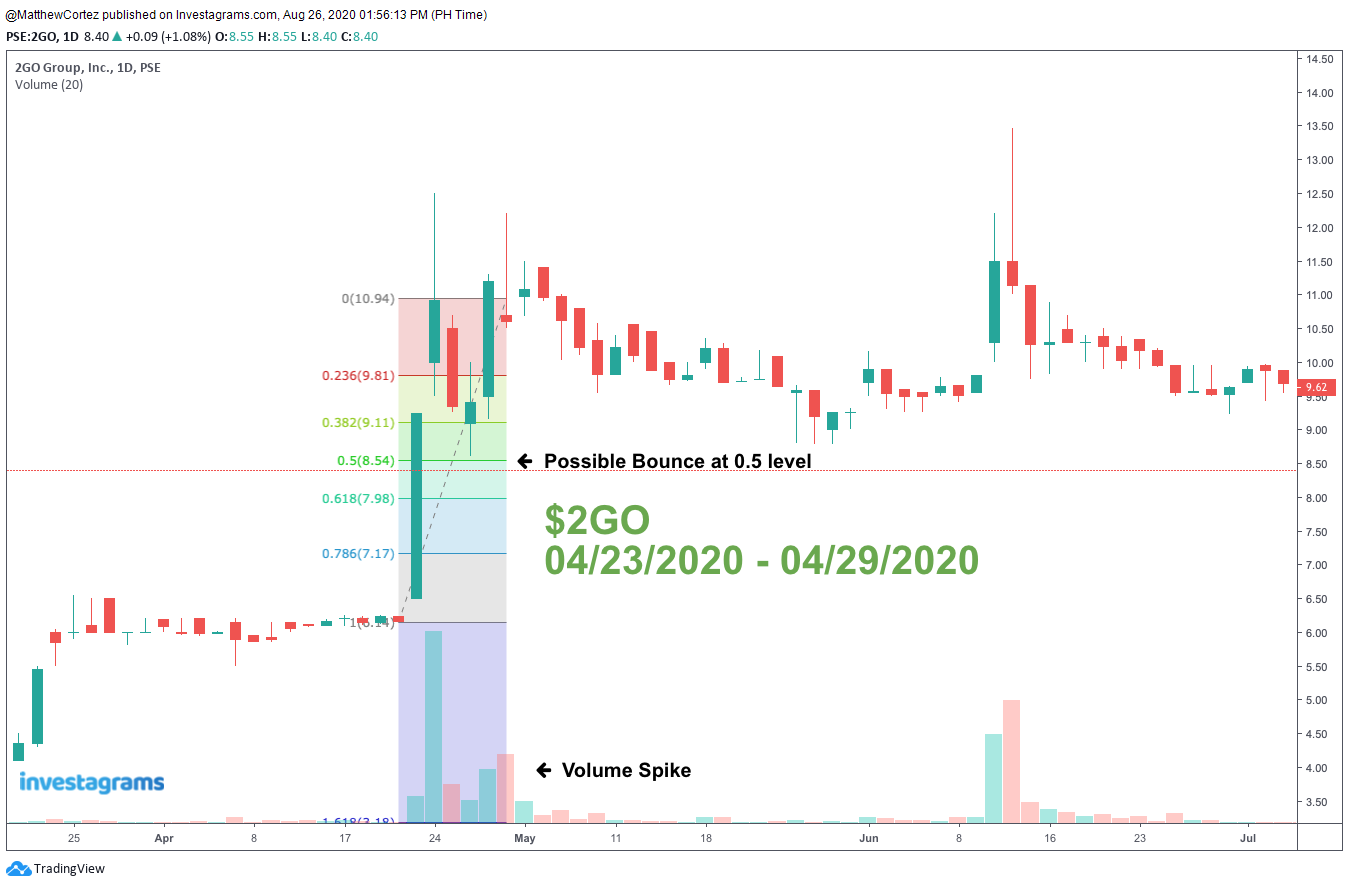
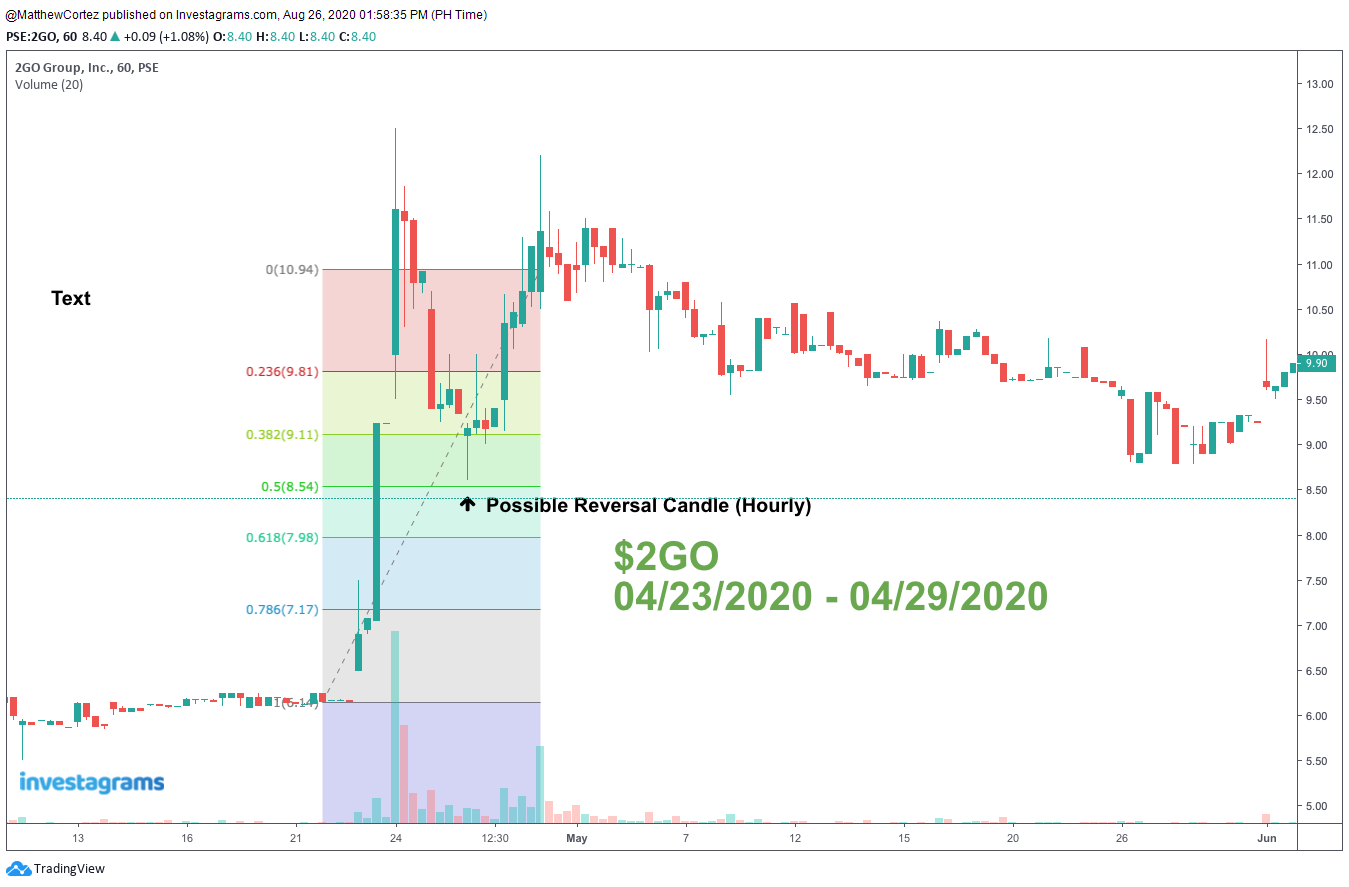
In the context of intraday penny/basura stock plays, it is important to check both the daily and the hourly time frames in order to get the full picture. Typically, it is important to take note of the bodies and wicks of the daily candles to see if they have bounced from a fibonacci support level. On the other hand, looking into the hourly time frame may show you reversal candles that may signal a change in direction.
EXAMPLES
High Volatility Bounce Play [$2GO]
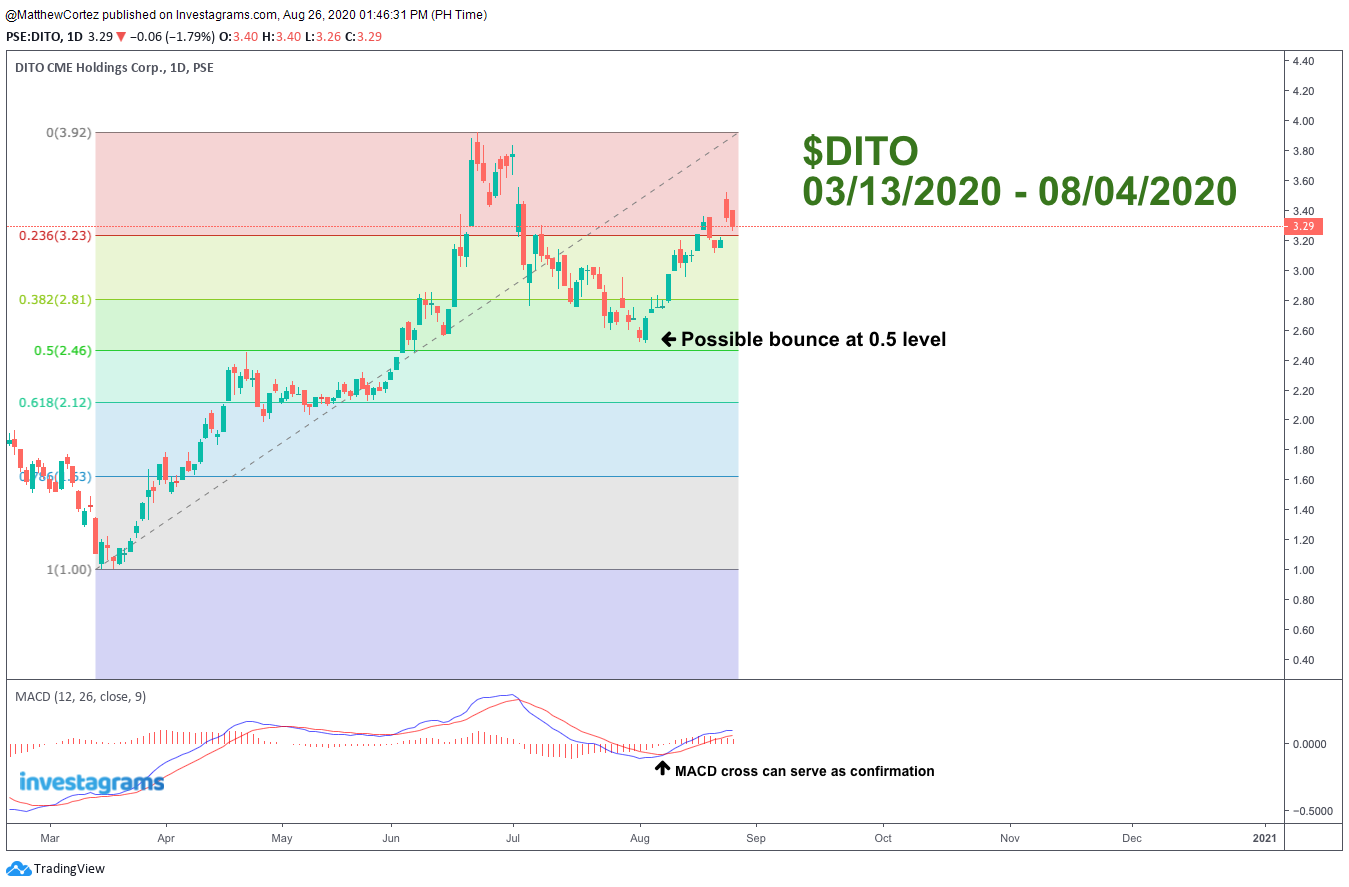
Long Term Retracement [$DITO]
It should be noted that whether or not you include the wicks of candles entirely depends on the behavior of each individual stock. In addition to this, the fibonacci retracement tool is best used with other indicators and will be most effective when in line with areas of high confluences. Regular trading rules (stop loss, position sizing, and take profit levels) still apply. Hopefully, this article has equipped you with the skills and the mindset necessary to catching the bounce rather than chasing the stock. Happy Trading!
It is time to take your trading to the next level.
JOIN THE INVESTACUP 2020 and have the chance to win over PHP 300,000 in prizes!
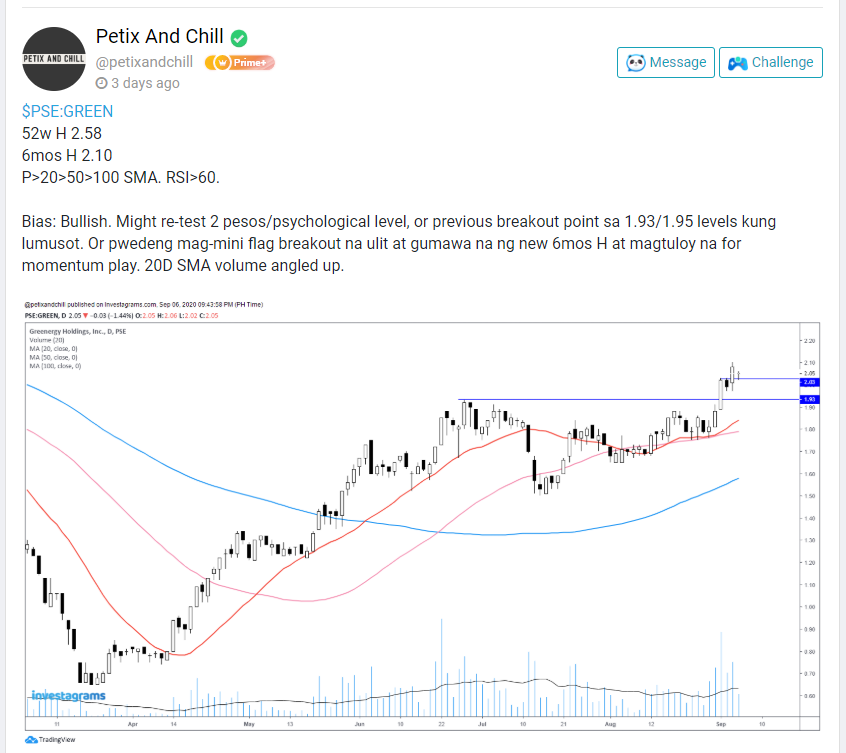
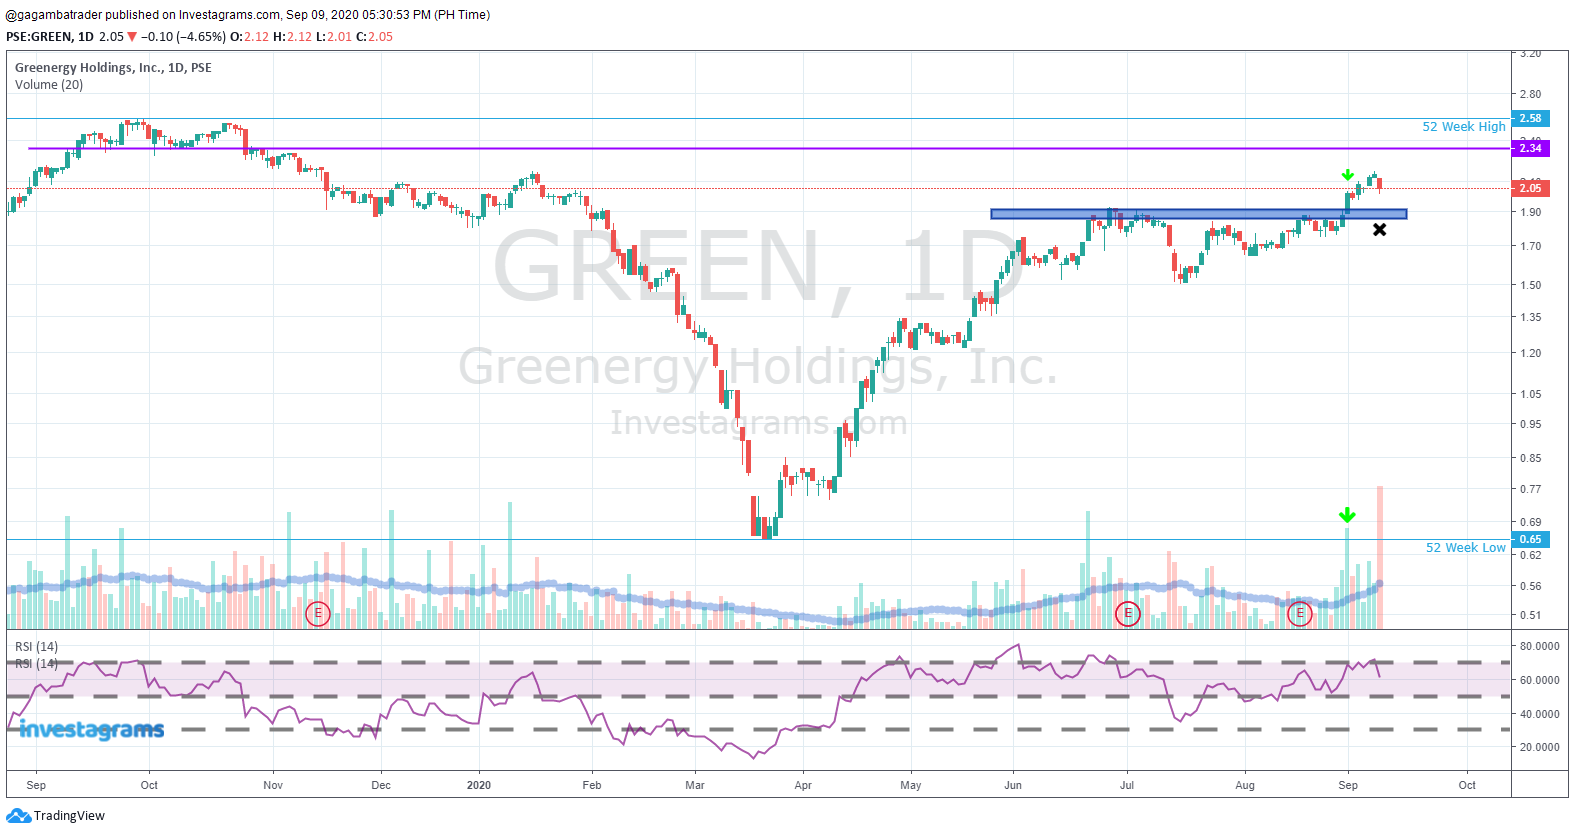
As the local index found support at the 5700 levels, the $PSEi presented numerous trade opportunities to select from. Petix and Chill (@petixandchill) was able to spot one of those potential leaders — Greenergy Holdings, Inc., or $GREEN. This trader is an active member of the Investagrams community who endlessly provides his analysis and insights focusing on the local market.
As seen in the technicals of the said stock, this name formed an ascending triangle pattern. This pattern resembles a triangle or flag that exhibits higher lows in price in confluence with a resistance level from a recent pivot high. While the stock was forming a base, it was supported with dried-up volume. Furthermore, it was also hovering above RSI (14) 50, which further solidified the creation of the said base.
A breakout of the 1.95 pivot area was an ideal buy point as it was the confirmation of the said bullish pattern accompanied with massive volume. It is a low-risk, high-reward trade, as the stop loss levels for the said breakout point is around 1.85 (-5%), and the take profit areas could be the structural resistance at 2.35 (20%) and near the 52-week high (28% to 30%). As of this writing, the stock ended the trading session with a loss. This could be an opportunity to wait for a pullback at the previous breakout point.
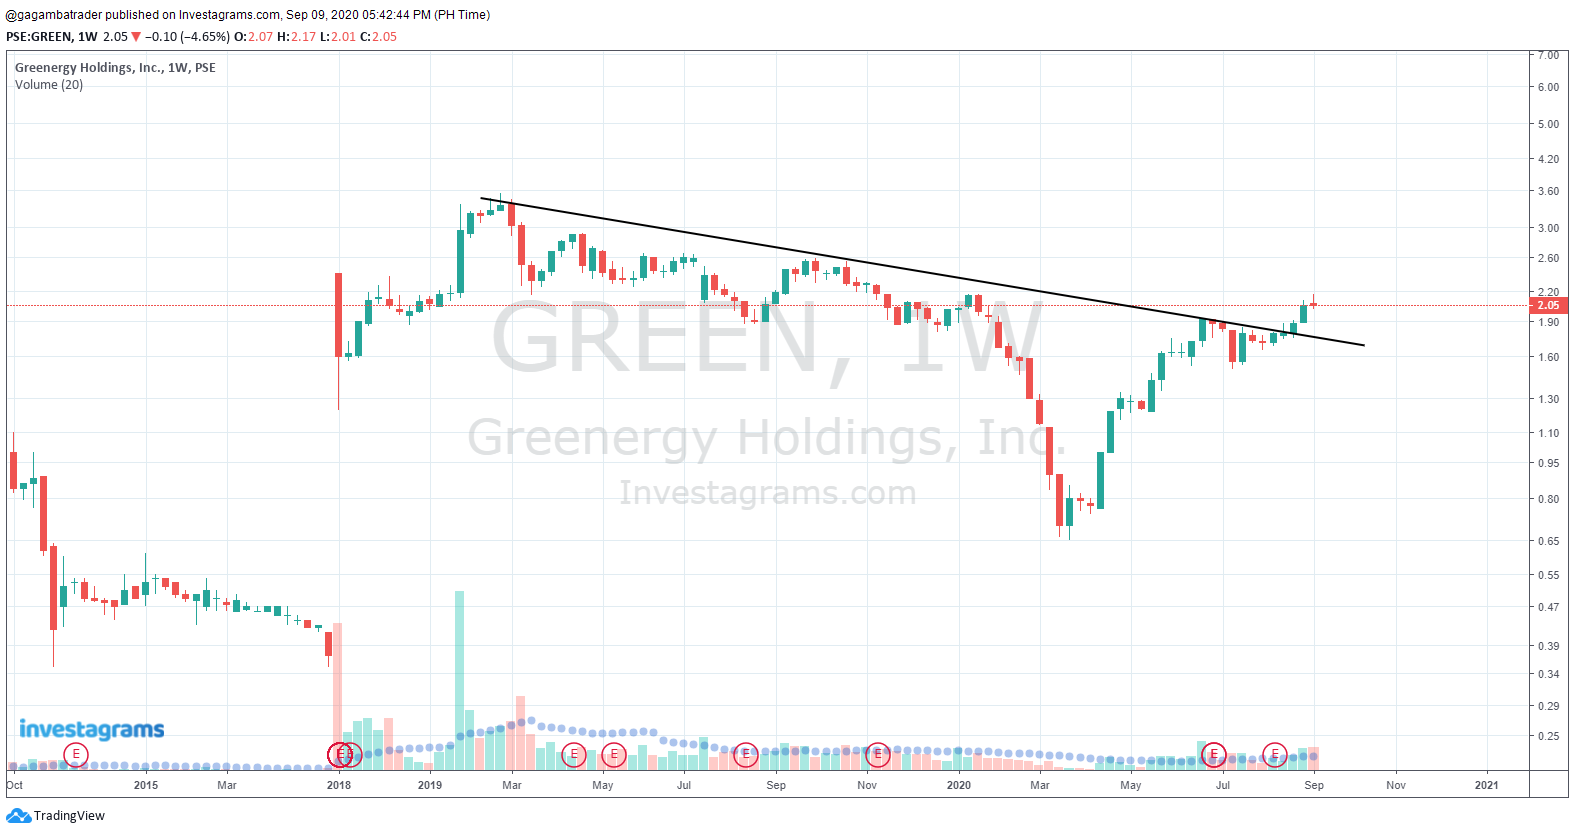
To further sustain its dominance, this stock should hover above the 1.9 to 1.95-peso area. In the bigger picture, the stock seems to be on the right track as the breakout of the said pivot was also in conjunction with the breach of the longer-term trend line resistance as seen in the weekly chart.
The epitome of professional trading is the ability to be disciplined and patient when it comes to an emerging name. Waiting for the right moment to strike, whether it would take weeks or months, is an essential skill that we must incorporate in our trading arsenal.
Congratulations to those who were able to maximize the technical swing of $GREEN. Lastly, kudos again to Petix and Chill a.k.a. @petixandchill for sharing his execution. Your FREE 1-Month InvestaPRO access is on its way!
Take your Trading to the Next Level.
JOIN THE INVESTACUP2020 and have the chance to WIN MORE THAN PHP 300,000 IN PRIZES!
In any kind of team sport having LEADERS is always important.
The names we give positions of leadership whether they be managers, trainers or coaches are mostly only made to define specific roles in a team. As backseat personalities, such roles can overlap. They are there to either provide logistics, formulate strategies and game plans, or give instructions in real time situations. Among those other components of course, they must share the visions and ideals of the team and would be expected to work hard to PREPARE it towards achieving set goals.
When game time commences, while coaches still play active roles, the burden of performance now shifts to the players. Physical and mental conditioning during the training phase are critical to the outcome. Endurance and tenacity usually become differentiating factors. One team may easily dominate a league if and when it is properly trained, well coached, and have a roster of talented players. In real life sports competitions however, close matches usually tend to happen. And at crunch time, leadership qualities will inevitably become of much higher importance.
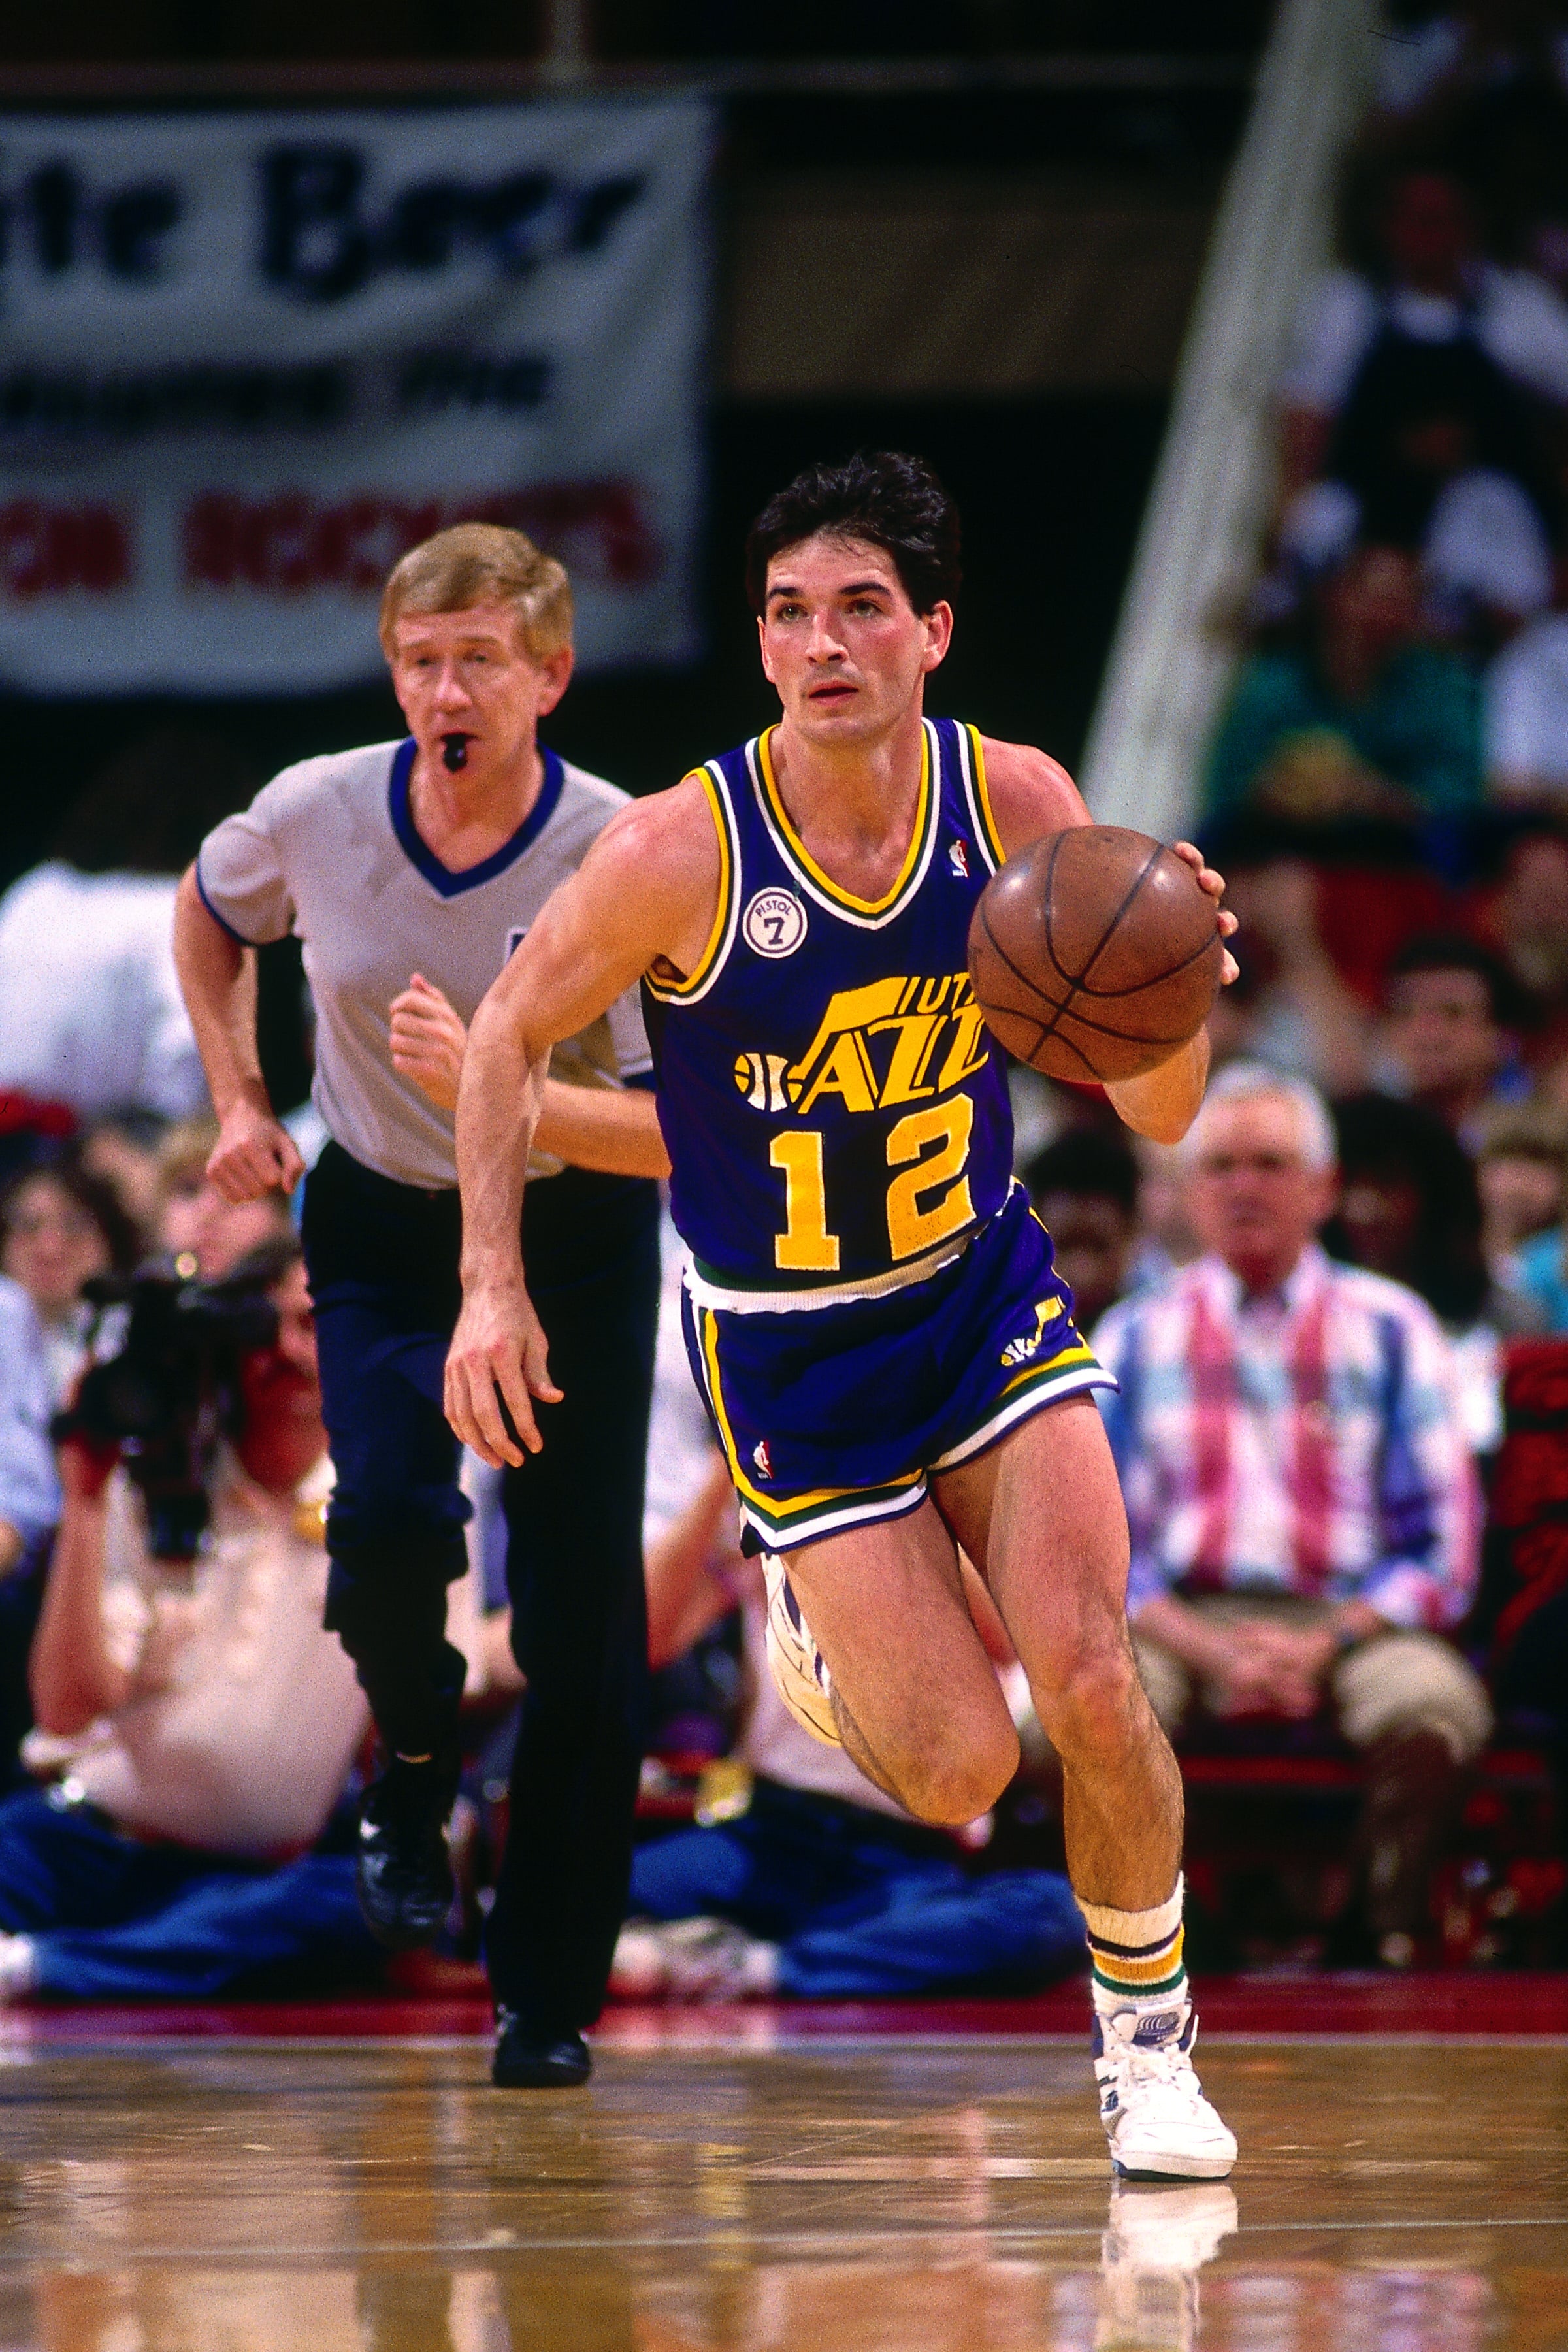
In a game of basketball for instance, while positions may have been set with roles well defined, a single person is almost always tasked to initiate plays and carry the burden of leadership. Most often, the POINT GUARD takes the helm. He/she would surely not only have excellent ball handling skills, but the needed “command and court sense” to execute set plays.
The POINT GUARD must also be able read into the defense, put the play into motion and when needed, modify or innovate by providing visual or audible signals to his team mates as the situation calls for it.
In the end, the objective of scoring against the opponent is achieved only if most of the players contribute either by moving the ball into scoring position, giving out an assist, providing a pick or a screen, and most important of all, TAKING THE SHOT.
Of course, not all shots will go in. But if the players know and have confidence in their skills, they TRUST and execute the play. Whether drawn or improvised, taking the shot before time expires is an absolute must. You might miss it and make only say, half your attempts. That will always be better than not taking one.
In an actual game, the PG (point guard) is expected to perform most of the following: Know the players on the court for his team in terms of their capabilities particularly the strengths and weaknesses of each and every one.
Communicate instructions on the fly and execute drawn up or preset or plays.
Survey the field of direct and peripheral vision and read into the opposing team’s defense (or offense). He must make his unit react to on-court movements and respond accordingly to evolving situations. He must always improvise when necessary.
Provide visible leadership that will spur his team mates to raise their level to confidently gain and achieve victory.
People who trade the market should be like point guards.
Although except for the most part we are all only a one-man team. Sure, we sometimes collaborate with other traders or maybe become members of a small, like-minded community but in the end, we play the game alone and by ourselves.
That does not mean though that we cannot apply the “game on” mentality. After all, we constantly train ourselves by being actively or passively engaged in the market. Eventually we evolve with a skill set not unlike a prized POINT GUARD.
Here’s how:
Finding high probability trades using an objective process of stock selection.
Like PGs we survey the court and pick on which side is best to create a play. We carefully consider available choices using set criteria as volatility, momentum, and liquidity and pick a path to follow. Needless to say, picking the right stock to play with is an all-important process that we try to master. It’s like having a DREAM TEAM in your portfolio where when chosen correctly should paste a smile on your face. For us traders, it should not be about popularity although a favorable market sentiment is always welcome.
A methodical trader will always let the numbers do the talking. Quant-based methods provided by trading support providers (like BoH Society) are both impersonal and objective. And preferably using a mathematically-derived short list of candidates in a field of current market leaders that exponentially increases chances of success, we decide on where to set our laser sights on.
Knowing the strengths and weaknesses of our potential trades.
Great PGs are like playing coaches. By both instinct and experience they know which options they can take to create mismatches against the opponent. He finds them and exploits the perceived disadvantage. Loosely translated, it would be like how we view the possible setups, in relation to supports and resistances, and ultimately in the actual Reward to Risk ratio (R/R).
Buying near supports and selling near resistances is the simplest strategy anyone can take. And by most standards the best one that should rack up your wins.
Employing the capabilities of various chart indicators.
In modern day sports programs, the good ones recognize the value of data. When you are using algo-based information, statistics are gathered, collated and brought to life as visual infographics. Most often, team leaders like the PGs are given this information and during pregame huddles discuss with the coaching staff how to work with such in offense or defense plays.
For us traders, this visual data is available in select indicators for us to interpret. The more common ones like Stochastics, RSI, various moving averages, Bollinger bands, etc., can provide evidence or confirmation of price behavior.
It’s quite simply like putting trust in a closely-knit team that you know is there to support you. Of course as they say, less is more. As each has a defined role that has been tested and proven, the trader must now rely on each one to deliver pertinent information that can be useful at the most opportune time.
Execute a trading plan with a proper scale of commitment(aka position size).
A good PG always knows how to set the right pace. In a 48-minute game, he is not likely going to run fast breaks every time. Instead he would try and change the pace every so often and keep the opposing team guessing. Tactics require variations in order to be effective and conserving energy for an end game is crucial to winning.
This is a strategy that all traders must hold dear and have ingrained in their minds.
Capital preservation is always of paramount importance. We need to constantly realize that the only improvisation available for us is in having the will to cut losses, adjust trail stops, average up, or simply take profits. Like the skillful PG, a decisive advance or retreat is the key to securing long term success as traders.
Because win or lose, there is always the NEXT GAME.
Contributor:
Name: Jojo Gaston
Investagrams Username: @JojoGaston0
About the Contributor:
Jojo Gaston is a partner/mentor at BoH Society, an online trading support group that provides traders’ education, and data driven trading format for local stocks, forex, and other foreign markets.
Investagrams’ most powerful suite of tools is now FREE FOR 14 DAYS!
ACCESS YOUR INVESTAPRIME ELITE FREE 14-DAY TRIAL TODAY.
“Successful traders know that a consistent and systematic review of their daily trading activities is the direct path to growing and improving”
– Van K. Tharp
While looking at the movements of your charts, play the Reflection song by Lea Salonga and sing along with these lines: What is that trade I see? Staring straight, back at me. Why is the reflection something I don’t want?
Reflecting is not only done for the state of your mental health, to have a clear mind, or even to create better decisions. Reflecting must also be done when investing and trading to create sound and correct decisions. In order to do this, you must have a good, healthy, and peaceful environment. At the same time. It is very essential to have your thoughts and actions documents. Just like how you journalize the things you do every day; you must also journalize your investments and trades!
For investors and traders, journalizing helps develop a more efficient and effective strategy in dealing with the market. With journalizing, you can see your mistakes clearly and what were the principles and rules that you have went against. At the same time, you can look at where you have excelled in! That’s the great thing about journalizing, it gives a peace of mind and determines the areas where you need to improve on. It instills the value of sticking with the rules and principles in beating the market.
One thing to know about journalizing your trades and investments is that it develops the discipline and habit of documenting every transaction that you have made — from buying to selling, and even checking the chart movements.
Here are the things you should know when creating a journal for your trades.
Step 1: Determine what stock to purchase and what type of stock
It’s a must to know the stock you will be purchasing. But not only that, you must know what stock you will be purchasing. Is it a speculative stock? Defensive? Cyclical, blue chips, or tech stocks? This initial step already determines if you are a good trader. A good trader knows where he or she invests in. You can use either technical or fundamental analysis, or combination of the two. Remember, the organization of your trades starts on your discipline in analysis.
Step 2: Listing the quantity of shares bought
Do not rely on the information and journal given by your stock brokers. Record and list down the quantity of shares bought so you can be fully informed about your total investment. This will help you note if have already gained or made losses in your portfolio.
Step 3: The buy and sell point
This refers to the entry/exit point at which you decide on the price you would buy or sell your stock. To limit losses, you must note your target profit and stop loss. The benefit and essence of this step is to know the progress or status of your holdings.
Step 4: Type of time holding period
Determine on how long would you be holding the stock. Would it be for 3 weeks? For 2 months or 3 years? Decide whether you would be holding it on a short, medium, or for long term.
Step 5: Trading Strategy
Trading strategies and holding period goes hand on hand. Journal whether you will be strategizing it with position trading, swing trading, day trading or scalping. Being informed with your strategies will help you on your decision making
Step 6: The buy signal and the reason
Journal the signals and indicators at which made you buy a stock. Were you just hyped with the news or alongside with the comments of traders? Always make a logical and clear decision with a good foundation of analysis, not with feelings. This will also help you understand more the importance of understanding the market structure and indicators. Was there a breakout? A hammer candle stick? A double bottom or an ascending triangle?
Step 7: Date when sold
Consider all dates important, as if they were your anniversary or even your birthday! Treat this as an important component of your trade for it will determine if you broke your rules and time frame.
Step 8: The sell signal and the reason
Selling your stock also goes hand on hand with your time frame. Determine what was the reason for selling. Have you reached your stop loss or target profit? Was there a market breakdown or have you foreseen that the market is on downtrend?
Step 9: Principles and Results
As much as every step is important, you would and must also see the results of your trades! Have your stocks been performing well? Have YOU been performing well? Were your imposed rules and principles followed? If not, what were the results of your non-compliance with your principles?
Conclusion
Consider every step important. With the discipline of journaling, you will always continue to grow and develop the areas you need to improve more!
Take note: You do not just record your success but failures as well! TAYOR!
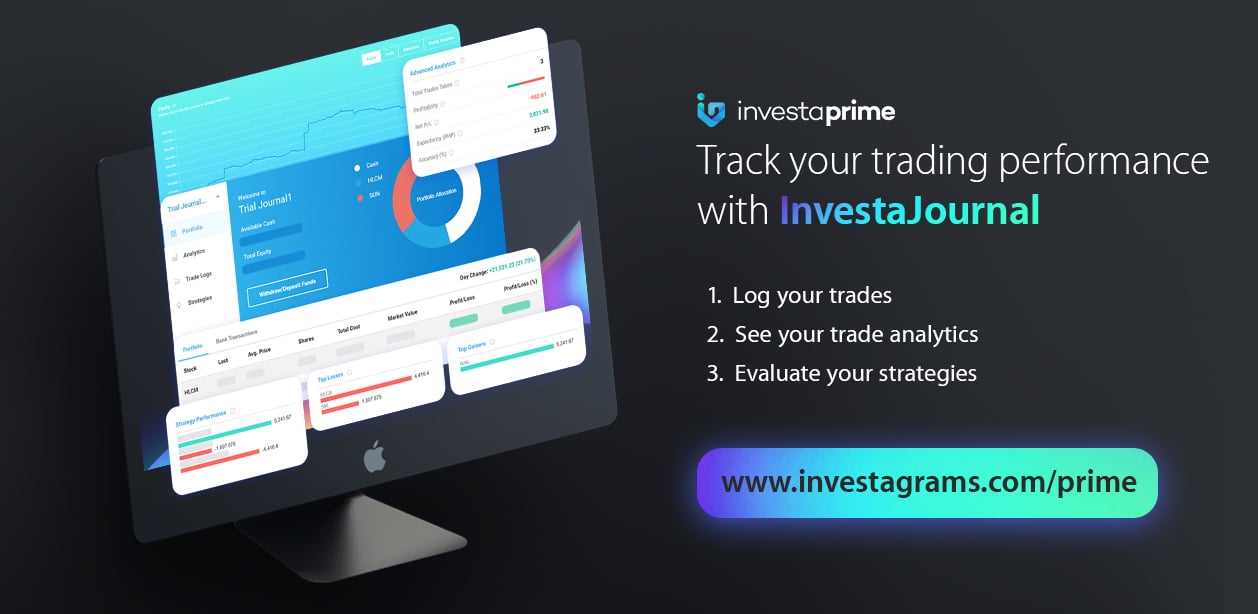
Track your trading performance with InvestaJournal. Now available on InvestaPrime’s FREE 14-DAY TRIAL!
Click on the photo to get your InvestaPrime FREE ACCESS.
Since the Philippine market has been lagging compared to various financial markets across the globe, it is a limiting belief that the local market is enough to amass the limitless opportunities in the markets. The global markets offer several asset classes along with the ability to short, leverage, and margin as part of your trading arsenal.
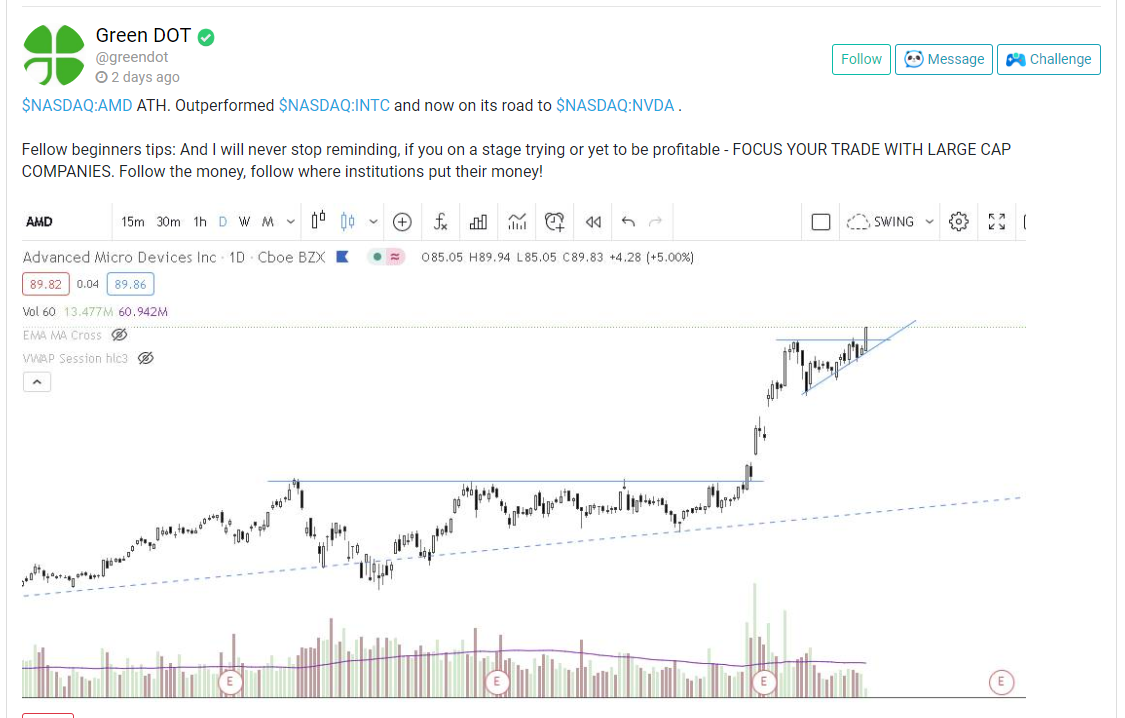
For our featured trader for the week, we will be showing you how he was able to spot Advanced Micro Devices, Inc. or $NASDAQ:AMD. Green DOT a.k.a. @greendot is an active member of the Investa Community who continuously spreads his knowledge, insights, and expertise in both the local and the global markets.
Technical-wise, $NASDAQ:AMD price structure represents a picture-perfect trade setup. It first formed a cup and handle formation. The handle of the said pattern is indeed long, yet it is ideal for a stock or any asset class to form a proper base to further amplify its probability for a strong and massive breakout.
It was a low-risk, high-reward trade, as accumulation levels could be at around the $50 area and a quick cut below $48 (-4%). It had an opportunity to tranche at the breakout of the $60 area with a quick cut below the breakout candle (-5%). Furthermore, it also presented another opportunity for a breakout in case you missed the previous move at the $88 area with a quick cut below the breakout candle as well (-4%). Selling into strength (selling on the way up/while it is easy) and into weakness (the breakdown of a, for example, a pre-determined Moving Average) is fitting since this is an All-Time High stock.
The base at the handle area was supported with dried-up volume. When it managed to breakout of the said base, the up move was supported with massive volume. During its formation of the Ascending Triangle pattern, the formation was also accompanied by dried-up volume, and once it broke out of the said pattern, the up move was also backed with immense volume. $NASDAQ:AMD must at least sustain the $80 levels to further assert its ascendancy.
The ability to spot resilient stocks despite the noise concerning various opinions regarding the future of the US Stock Market is the key to truly function as an independent operator. The bottom-up approach is the way to lead you to potential market leaders despite the performance of the overall indices. That is an approach that is hard to stomach in but is essential to your growth as a trader.
Congratulations to those who were able to maximize the monstrous move of $NASDAQ:AMD. Lastly, kudos again to Green DOT a.k.a. @greendot for sharing his execution. Your FREE 1-Month InvestaPRO access is on its way!
READY TO LEVEL UP YOUR TRADING? Join the #InvestaCup2020 and have the chance to become the Champion of the Biggest Trading Competition in the Philippines.
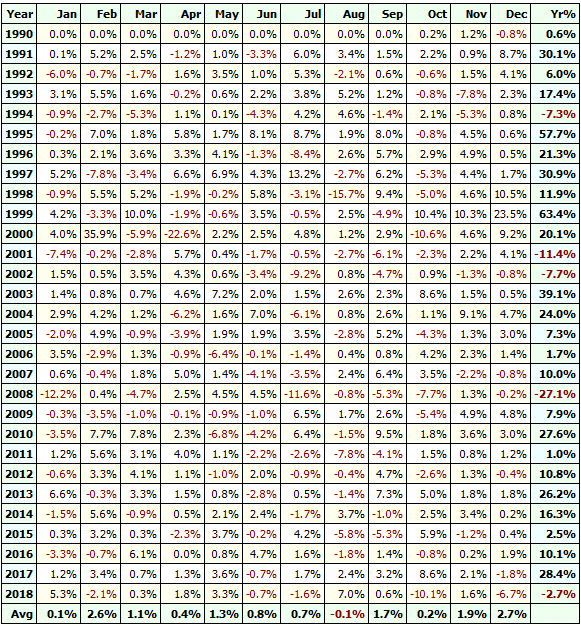
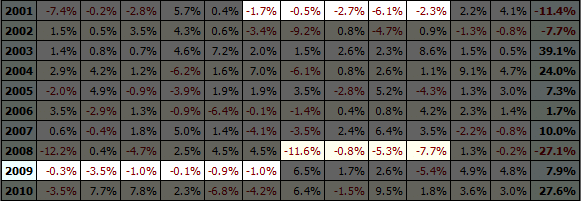
There are better systems out there, but this system beats the 32-year average annual return of the PSEi which is 7.50%
Now, the first thing to analyze is…
The strength and weakness of your strategy
Not only you should know when your strategy works, but also when it doesn’t work.
As you can see, this market thrives on long-term trends and lost only 5 out of the 28 years the strategy has been tested.
However, you must take note that this strategy does not work well on Financial Crises:
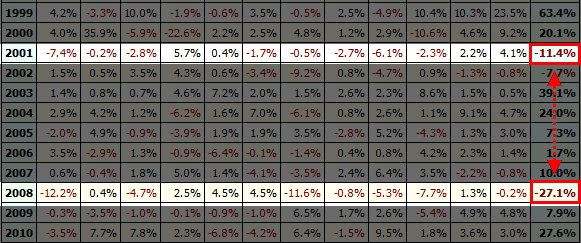
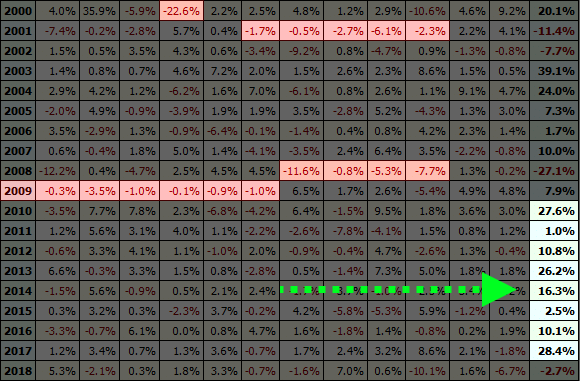
The next thing you must identify is…
The worst-case scenario of your strategy
Now, what would you’ve done if you have experienced a 4-6 month losing streak?
Or lose 22.6% of capital in just a month?
Would you start tweaking your indicator settings, add new indicators, or pull out your capital and hop into a new system just because you are not “satisfied” with the results?
A worse-cast scenario is never easy to accept, but identifying it plays a crucial part in choosing a strategy
If you do not have the conviction to stick with your system through hard times, then you won’t thrive long enough to experience consistent returns:
So, the next time you encounter a strategy that promises huge returns…
Always determine what its maximum risk and average reward are, and think independently whether or not you can accept the risk, reward, and the concept of the strategy.
Next…
4. You Must Execute Consistently
As a human being, you will miss some trading opportunities and miss checking your charts.
This is why you must develop not only habits but a system to put your habits into action consistently.
So, what you must do is to…
Have a trading routine
One thing you must know first is that your trading business by any means should not damage your relationships or hinder other responsibilities
Overall, your trading routine should at least have the following:
analyzing charts/building your watch list • reviewing your trading journal • executing trades • a fixed time where you must execute your routine
With that said, you must…
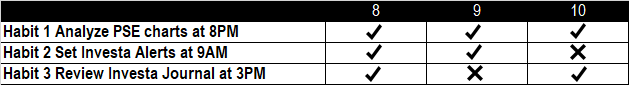
Track your trading habits
You can add more habits if you wish, but tally what you’ve accomplished by the end of the week/month and see how you perform.
If you have barely accomplished half, then make adjustments or improvements to your trading habits.
Remember, consistent results can only be achieved by consistent actions.
And finally…
5. You Must Grow Continuously
If you think that there’s nothing else to learn as a profitable trader or you feel that you are not growing, it’s either your trading business is dying or you are not growing fast enough.
In able to grow continuously, a couple of things you can do is to…
Feed your mind with contents that ONLY help you improve what you have
Instead of trying to add more knowledge into your “toolbox,” choose to improve the tools you already have and how to use them effectively.
If you are looking for direction in trading, then the TradingwithRayner Show will help you out.
If you are a price action trader, then Your Trading Coach has one of the best content for it.
But if you are new to trading, then Investa Learn will help.
Again, choose contents that’ll only help on what you have and where you are now.
Have a trading circle that helps your growth
You don’t need to look for traders who trade the same as you.
But what you do need is to be with independent thinkers who can give you wisdom and direction in trading (instead of hype and tips on which stocks to buy).
Because being around with disciplined traders and high-performance traders open your mind to new possibilities on how you can improve your own.
Overall…
The besttrading groups I know not only support you in your trading but also produce a huge impact on your life outside of trading.
Putting Things Into Perspective
Trading is a journey worth going through for a lifetime.
What’s important is not just the money you can potentially make (or lose), but the meaningful relationships you build and the person you become in the process.
Overall, these 5 characteristics must be practiced in harmony as it is crucial not only to your trading success but the longevity of that success you have or will achieve.
As the saying goes, “success requires maintenance.”
With that said…
What else can you add to these 5 things?
Let me hear your thoughts in the comments below!
Contributor:Jet Toyco
Investagrams Username: @Jet_Toyco
About the Contributor:
Jet Toyco is a private executive trading coach and a systematic trading portfolio fund manager at TradingwithRayner.
He is also a public helper of the trading community that is always open to questions anytime to give the knowledge people deserve at no cost, and no hype.
Subscribe to our Newsletter
Join our mailing list for investing tips and stock market advice to help you reach your first million.