It’s very common to hear that the first step to financial freedom is saving. Easy enough to say, many are still having difficulty into walking into the path of financial journey.
“Mag-ipon ka lang, tapos invest!”
It’s not the same ride for everyone of us. We all have different privileges in life. We all have different risks. Fundamentally, everyone needs to know that we need to minimize expenses, and maximize savings. Is that possible? Yes, it is!

What’s your current state right now? Tipid-tipid din kapatid. That’s right! However, in reality, these things are difficult to handle; expenses here, liabilities there, payments are everywhere.
Look into the world with the lens of saving and investing. Without any savings or extra money, investing will be difficult. The purpose of saving is to be financially free, and to live tomorrow without doubts in expenses or even emergencies.
Take it or leave it, it’s easier to spend than to save. Think of your future, or even the people around you. Sometimes, life would only give you enough money to survive; it’s difficult to even support those who are in need or even get what you need. Improve on that and get to your starting line, be a game changer!
Saving is not all about getting a portion of your money for your emergency funds or even getting what is left. It’s also about spending wisely.
If you are having difficulties in saving, you might want to try this as well. There are various applications for budgeting that are currently emerging. What is good about the applications are being free and convenient. You might be asking what change could it bring for you to try the applications such as GCash, Shoppee, Lazada, or PayMaya, if the only thing it brings is a change of payment or transactions.
These applications are not just for your convenience in shopping. It offers so much more than that! Try and download these applications in your gadget, and try to scroll on it. These apps allow the user to use discounts, rebates, promos, and even free shipping.
Interesting, right? Hearing these things would not only make your shopping fun, it could also help you a lot in your finances. You can either avail the promos, use free delivery coupons, or even your vouchers. Besides buying on sales and bundles, these things would help you save up. Especially that now is the time to use online platforms for your necessities.
Now, this is only one of the many things you can do to save ad spend wisely. You could also try exploring on more ways how to spend wisely such as using online banks for your payments or even choosing to cook at home than call on Jollibee delivery.
As long as you have the heart to manage your finances, continue to have that discipline in managing your finances. Remember, your future is also your responsibility; the first step to create a better future for you and your family is to be well-informed and guided with how you follow your finances.
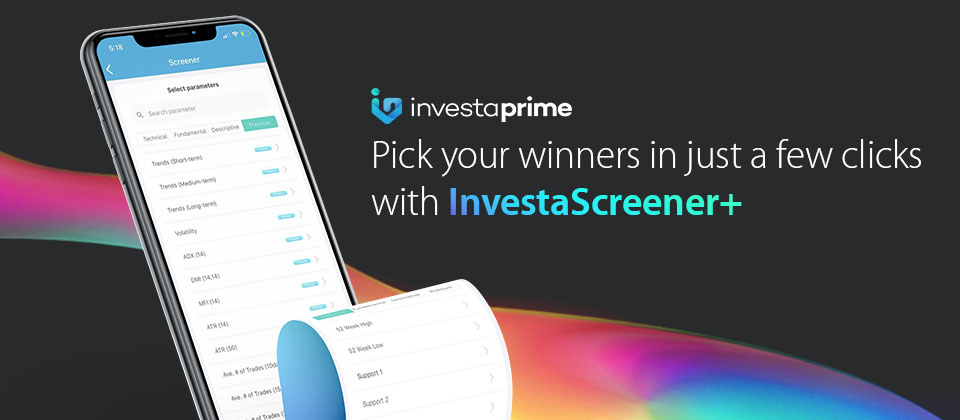
EXPERIENCE THE POWER OF INVESTAPRIME ELITE IN OUR 14-DAY FREE ACCESS!