Categories
How to & Advice Videos

Stock Market Basics: How to Read Stock Charts (Part 2)

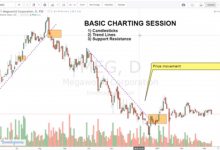
In our first video, we taught you the basics of how to read stock charts. We explained candlesticks, trend lines, and support and resistance.

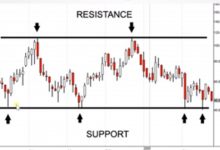
Now, we’ll dive deeper into support and resistance—the backbone of all price structure analysis methods in technical analysis.

Watch the video above to learn how mastering support and resistance can make you a more profitable trader. We’ll also teach you about breakouts, breakdowns, and role reversals—when resistance becomes support or support becomes resistance. This will help you predict the best time to buy and sell.

This video is in a mixture of Filipino and English.

Subscribe to InvestaDaily for more investing tips and stock market advice, or sign up for Investagrams to access special features to help you reach your first million.

Categories
How to & Advice Videos

Stock Market Basics: How to Read Stock Charts (Part 1)

Whatever your investing style, knowing how to read stock charts is a skill that is sure to help you succeed in the stock market.

Watch this short tutorial video to learn the basic ways to read a stock chart—including how to read candlesticks, identifying trend lines, finding the support and resistance, and spotting breakouts or breakdowns. All of these will help you understand charts better and make more informed trades.

Once you understand these basic concepts, go ahead and watch our video on How to Read Stock Charts (Part 2)!

This video discusses technical analysis concepts in a mixture of Filipino and English.

Subscribe to InvestaDaily for more investing tips and stock market advice, or sign up for Investagrams to access special features to help you reach your first million.

Subscribe to our Newsletter

Join our mailing list for investing tips and stock market advice
to help you reach your first million.

You have Successfully Subscribed!