All-in-one platform for market education

Your Official Learning Hub on Trading,
Investing, and Personal Finance

Learn about Stock Market

Learn about Crypto Trading

Learn about Forex Trading

Learn about Mutual Funds and UITF investments

Learn about Business and Entrepreneurship


Unlock the full power of Investagrams
Please enter your first name.
First Name - Special characters and Numbers are not allowed.
First Name must be at least 2 characters.
Please enter your last name.
Last Name - Special characters and Numbers are not allowed.
Last Name must be at least 2 characters.
Please enter an email address.
Please enter a valid email address.
Please enter a password.
Password must be at least 6 characters.
By signing up, you agree to our Terms of Use and Privacy Policy .

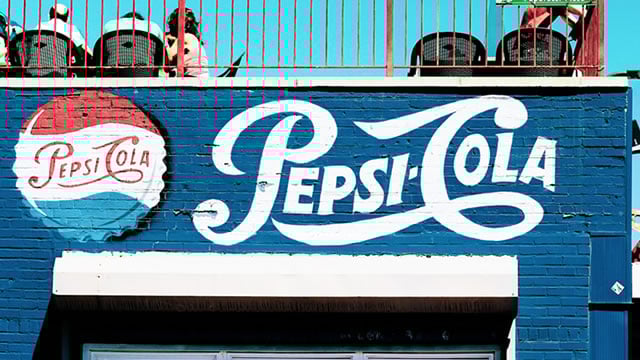
Pepsico Inc.
 United States
 | Open | Prev. Close | Volume | Market Cap |
|---|---|---|---|
| 147.00 | 147.00 | $321.80M 2.19M shares | 201.36B |
An RSI between 50 to 70 signals that prices have been strong recently.
An ADX reading of 25 to 49 suggests that a trend is present.
The trend reversed downwards in the short-term.
| TIME FRAME | VOLUME | % CHANGE | -100 | -50 | 0 | 50 | 100 |
|---|---|---|---|---|---|---|---|
| 1D | 11,208,175.00 | | |||||
| 3D | 7,683,532.00 | | |||||
| 7D | 8,532,286.71 | | |||||
| 30D | 8,872,448.70 | | |||||
| 50D | 9,730,551.68 | | |||||
| 100D | 9,297,446.14 | | |||||
| Indicator | Value | Gauge | Status |
|---|---|---|---|
| RSI (14) | 54.4984 | | Bullish |
| ADX | 38.4182 | | Strong Trend |
| MACD | 2.6079 | | Weak Downward Momentum |
| Candlestick (1 day) | None | | neutral |
| Candlestick (2 days) | None | | neutral |
| Candlestick (3 days) | None | | neutral |
| TOP NET BUYERS | VOLUME | SHARES | AVG PRICE |
|---|
| TOP NET SELLERS | VOLUME | SHARES | AVG PRICE |
|---|
History


Subscribe to Prime and win exclusive prizes


Join the Discussion
Make a forecast
Create a post to break the ice