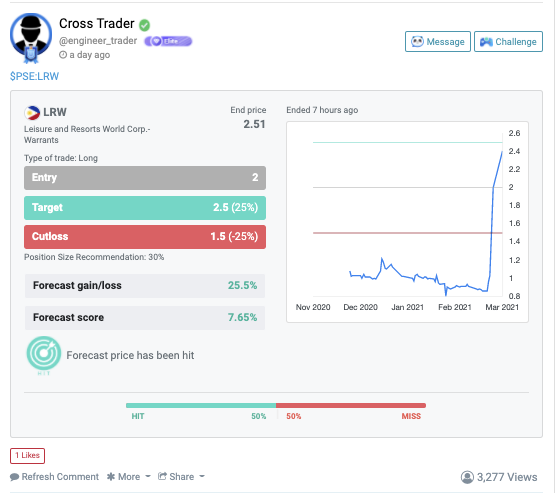
Cross Trader was able to fix his sights on $LRW, bagging a 25.5% gain, entering at 2 and exiting at yesterday’s wick at 2.5. Cross Trader is able to maximize his profits by setting his take profit level as high as possible, impressively hitting peaks on a consistent basis.
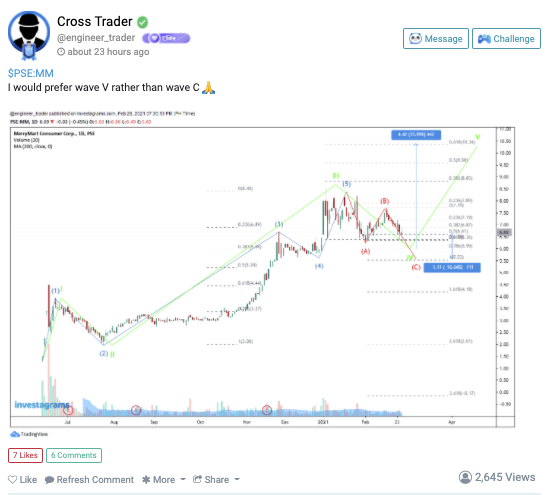
Cross Trader is fond to use Elliott Wave Theory, with most of his technical analyses working around the technique. Cross Trader complements his style with the Fibonacci Retracement Tool to pinpoint corrective waves and identify possible entries. Contrary to most traders, Cross Trader rarely uses any Moving Averages in his sentiments. Instead, Cross Trader uses historical price action to plot key support and resistance levels. Cross Trader also keeps an eye on RSI and MACD indicators in his sentiments to further support his predictions.
Once again, let us congratulate this week’s featured trader: CrossTrader a.k.a @engineer_trader for spotting $LRW and showing the Technical Analysis masterclass of TeamPrime! Your FREE 1-Month InvestaPro access is on its way. Kudos ka-Investa!
Self enrichment is as important as wealth accumulation
Body
Read a book
Pay attention to your Health and Wellness
Push yourself to something new
Business / Side Hustle
Learn a skill
Expand your network
Hire a business or career coach
Conclusion
Improvements will feel just as good, if not better, as clinching that 50% gain in the stock market
Don’t overlook yourself, you are more important than your wealth
In our persistent attempts to get out of the rat race, we become fixated on businesses, the stock market, our careers, and many other things. We often overlook investing on the most important asset there is, ourselves.
Stocks, bonds, and real estate aren’t the only things that appreciate over time. Furthermore, money isn’t the only thing that we invest, time and effort are also things that we invest to generate more of a particular something. Self enrichment is just as important as wealth accumulation, but how exactly does one invest in his/her self?
One of the best things that you can do to invest on yourself is to push yourself to new experiences. Perhaps something that you’ve never done before, a fear that you haven’t conquered, making a side hustle, or even as simple as attending a workshop for a particular skill. Pushing yourself to these new experiences and learning makes you feel more in control of your life, and makes you more equipped in your career or business. Not everything can be learned in school or in the workplace. Sometimes you just learn useful things in the most unexpected sources.
Another self investment that could really pay off is expanding your network. Attend networking events, get to know people and make a connection with a variety of professionals in different industries. A lot of business opportunities and jobs never make it to LinkedIn or even on the internet, that is why it is vital that you connect yourself to these people. Maybe you’ll land an awesome managerial position or take part in a startup with the cool people you’ve met. You’ll never know.
If you already have a large network and a wide arsenal of skills and experiences, then maybe the next thing that you can do is to hire a business or career coach. Even the greatest athletes and businessmen have coaches or mentors. Coaches can be useful in identifying more areas of improvement and further increasing the quality of your work. Remember that there is always room for improvement.
Lastly, and perhaps the most important investment on yourself is paying attention to your health and wellness. Miller (2014) mentioned in her article for the National Career Development Association that healthy individuals are more productive and tend to be better in the workplace. After all, you do want to live long enough to spend the money you’ve earned and enjoy the rewards that you worked so hard for.
In sum, investments aren’t just about stocks or the like. Investing in yourself is just as rewarding, if not more, as clinching that 50% gain in the stock market. To put it in investment terms, don’t put all your eggs in one basket, diversify your investments in stocks, bonds, real estate, and most importantly, yourself.
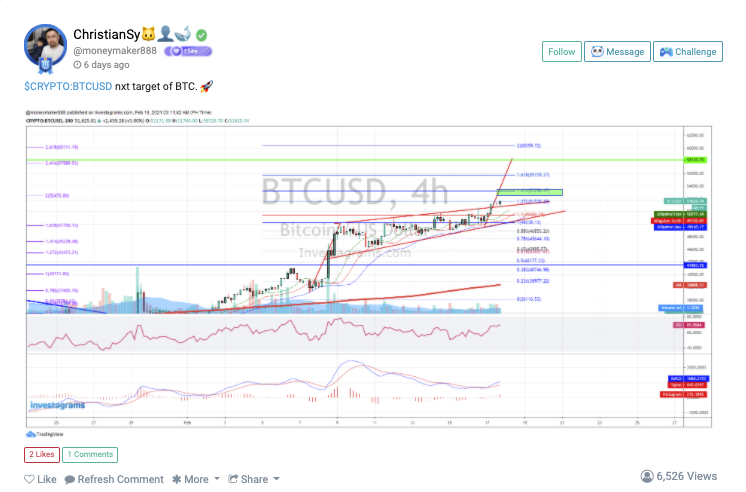
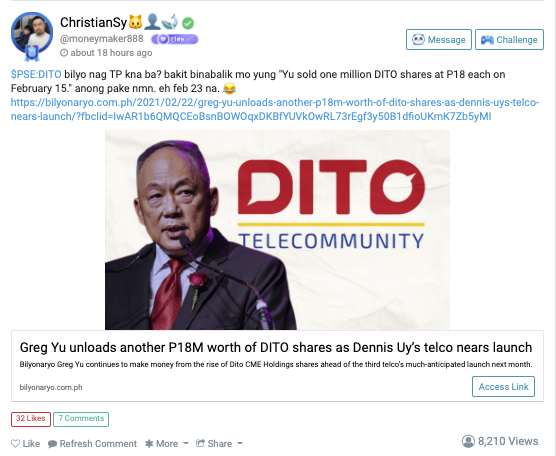
Despite the markets taking an unexpected dip, ChristianSy was still able to keep his composure and continue sharing his sentiments to the investa community. ChristianSy showed his Technical Analysis prowess after managing to spot $CRYPTO:BTCUSD last February 18.
ChristianSy has precisely predicted Bitcoin’s high at the $58 000 levels. More interestingly, he was also able to plot key support levels using the fibonacci retracement tool to which Bitcoin bounced at the .65 mark around the $44 000 levels during this week’s reds.
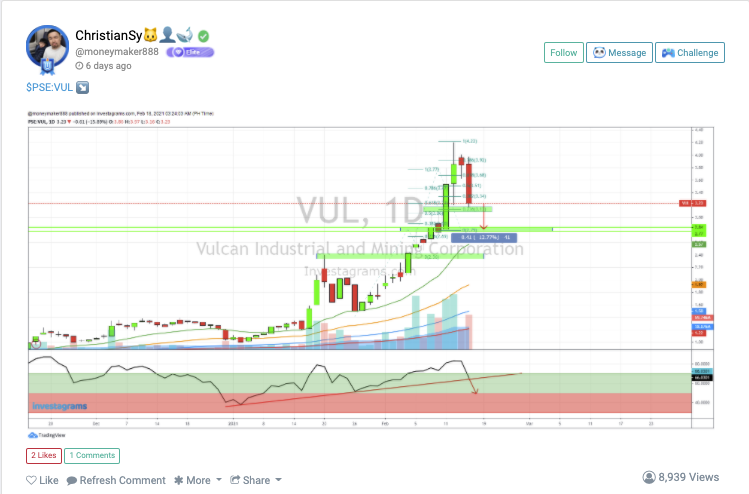
ChristianSy seems to be comfortable with position trading and has an eye for trend reversals. ChristianSy also plotted retracement charts and buy zones for $PSE:TBGI, $PSE:VUL and many others. ChristianSy is adept at using EMAs, trend channels, and plotting trendlines to accurately catch trend reversals and get the maximum profit at the safest positions.
While other traders shut off their phones and laptops to distance themselves from the stress of bear markets, ChristianSy continues his trading hustle by charting pullbacks and possible entries after the bear market. ChristianSy isn’t just showcasing trend reversal insights, he also has a good share of fundamental analysis.
Once again, let us congratulate this week’s featured trader: ChristianSy @moneymaker888 for being a prime example of how to continue the trading hustle even during bear markets. Your 1-Month InvestaPRO access is on its way. Kudos!
Everyone is talking about cryptocurrency nowadays. Most investors have bad things to say about cryptos, yet a handful of investors still invest thousands upon thousands of pesos on them. The stigma about cryptos being unstable, too volatile, and widely used by criminals all contribute to why a lot of people stay away from them completely.
Although cryptos are relatively new, the intent behind it is actually revolutionary. In essence, cryptocurrencies are digital currencies that are meant to be a medium of exchange just like the US Dollar and Philippine Peso.
What makes cryptos unique is the technology behind it, blockchain technology. Blockchain technology is innovative because it doesn’t require a centralized authority to regulate a specific cryptocurrency. In blockchain technology, everyone has their own ledger that updates automatically.
What’s more interesting about this technology is that it is being recorded with powerful cryptography that makes it very difficult to counterfeit the digital currency.
So basically, cryptos are digital currencies. But why is there such hype about them if they’re just like normal currencies such as USD, PHP, and EUR? Cryptocurrencies are hyped due to their high gains (and losses). To put it in perspective, Bitcoin, the most famous cryptocurrency, was valued at $15 in 2012.
Now in 2021, Bitcoin is valued at around $30,500, that’s about 1.46 Million pesos per bitcoin. Early investors and cryptocurrency miners got rich quickly with Cryptocurrencies. In 2020 alone, Bitcoin from $7200 in January up to $28000 in December.
There are many more cryptocurrencies out there besides Bitcoin, which are called “Altcoins”. Some famous altcoins are: Ethereum (ETH), Ripple (XRP), Litecoin (LTC). Some of these even have greater daily gains than bitcoin itself. Investors with very high risk appetite seem to enjoy the volatility of cryptocurrencies, many of which are Filipino investors. In 2020, the telegram group Binance Filipino was recognized as one of the most active telegram groups around the world.
The simplicity of getting intro cryptos makes it very enticing. Unlike stock trading, which requires a bunch of documents and government IDs, getting into the crypto game only requires an app, an email address, and money. No more banks, no more documents, no more valid IDs. Since many Filipinos don’t have bank accounts, this makes cryptos very convenient, since apps such as Coins.ph, GCash, and PayMaya are enough to be able to cash in and start trading.
However, cryptos aren’t just like casino chips that increase in value greatly. Advancements in technology and familiarity with these digital currencies allow some businesses to already accept payments in cryptocurrencies. Only time will tell if cryptocurrencies will push through to their main purpose as mediums of exchange, and not just cash farms for the hardened trader and cash burners for the newbie trader.
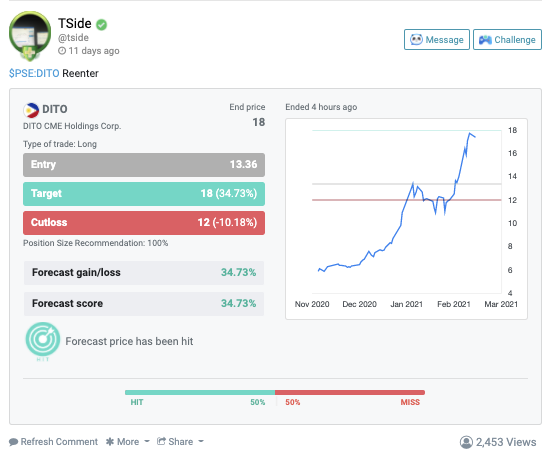
We would like to congratulate our featured trader for this week: TSide
TSide was able to spot the $DITO, entering at 13.36 and targeting 18 in his forecast, taking home a 34.73% gain. TSide was able to eye the peak of the wave, exiting perfectly to maximize his profits before $DITO closed at 17.4.
TSide likes to keep his charts clean, utilizing only the EMAs, Volume, and the Price Action of the stock in his Technical Analysis. He uses the 10, 20, 50, and 100 day EMA in his charts to spot juicy trend reversals and enter trades with minimal risk and high upside potential.
TSide also has his eyes on $APL, $BSC, $PHA, and $AR, cycling between these stocks and finding the right opportunity to enter trades. TSide has his fair share of fundamental analysis, always sharing news about his favorite stocks in his timeline. TSide shows the Investa Community that trading doesn’t require complex systems and hundreds of indicators. TSide’s simple and effective trading style proves that traders can still be profitable with the simplest of techniques.
Congratulations once again to TSide for being the featured trader of the week, and kudos to his forecasts, fundamental analyses, and trading advice! Your Free 1-Month InvestaPRO access is on its way!
WELCOME TO THE INVESTAPRIME MILLIONAIRE’S CUP – STOCK MARKET COMPETITION!
This competition is open to everyone who is part of #TeamPrime. All you have to do is be an InvestaPrime+ or InvestaPrime Elite Annual Subscriber to become an automatic participant in the newest Millionaire’s Cup with a chance to win PHP 1,400,000.00 in total prizes without an entry fee!
1. Registration.MCup Circuit #3 will begin on June 21 and will end on July 30. To become an automatic participant in all MCUP circuits, all you have to do is subscribe to either the InvestaPrime+ or InvestaPrime Elite. You can be part of #TeamPrime here:Click here to join the competition.
Take note:
You can change your Display Name, Username, and Profile Picture until THE DAY BEFORE the competition starts. Once the Trading Cup begins, the system will not allow you to change the above-mentioned anymore.
If you are an annual subscriber of InvestaPrime+ or InvestaPrime Elite, your account will automatically be added to the competition room. You will NOT be allowed to add a secondary account to use in the competition unless you pay for the registration fee for the non-prime participants.
2. Platform.The participants of the PRIME Millionaire’s Cup will use the Virtual Trading Platform of Investagrams which tracks the real-time stock price movements in the Philippine Stock Exchange (PSE). The system automatically calculates transaction fees to make it more realistic.
3. Goal.The goal of the game is simple — trade your InvestaPrime account for the whole competition period and aim for the highest profits. The participants with the highest rankings while playing within the rules will be recognized as winners.
4. Starting Capital.Each participant will start with PHP 1,000,000.00 virtual money to trade.
5. Trading Hours.Weekdays from 9:30AM – 1:00PM. This is the current Philippine trading hours and will be changed once the enhanced community quarantine is lifted. Meaning, you can’t trade during off-hours and on weekends.
6. Tradable Stocks.Participants can only trade the listed tradable stocks for this competition. The tradable stocks are filtered by our system and qualify as liquid and actively traded stocks. The initial tradable stocks list will be posted over the weekend before the competition begins.
You will be able to access the whole stock list once you are added to the Competition Room.
7. Diversification.To promote diversification and risk management, maximum exposure in a single stock can only be 1/3 or 33.33% of the portfolio. This requires the participants to buy at least 3 different stocks should they want to fully invest their portfolio. The system won’t allow you to allocate more than 33.33% in a single stock.
8. Buying and Selling Conditions. (For LONG positions). Participants now have two options when transacting. The first option is to transact using the current price of the stock and use market orders to buy and sell specific stocks at their real-time prices. The second option is to transact using our CONDITIONAL ORDERS. By using Conditional Orders, you won’t need to watch the market the whole day in order to transact in the market, you can now set AUTO CUT LOSS, AUTO TAKE PROFIT, and AUTO BUY ON BREAKOUT. You can also set these orders to GOOD TILL CANCELLED so that you order will remain active until your buy/sell price is hit. Watch this tutorial.
Buy – You can buy the same stock multiple times within a day. Sell – YOU CAN SELL THE SAME STOCK SIX (6) TIMES PER DAY.
In one stock per day you can sell TWO TIMES (2) at a PROFIT.
In one stock per day you can sell FOUR TIMES (4) at a LOSS. (cutloss)
9. Buying and Selling Conditions (For SHORT positions). SHORTING is now available for this competition. The same thing applies if you want to short a stock, you can transact using the current price or set conditional orders if you can’t keep an eye on the market. We understand that many may not know the concept of shorting which is why we created a video tutorial you can watch here: LINK TO VIDEO
Sell – You can open a short position on the same stock multiple times within a day. Buy – YOU CAN COVER YOUR SHORT POSITION ON THE SAME STOCK SIX (6) TIMES PER DAY.In one stock per day you can cover your short position TWO TIMES (2) at a PROFIT.
In one stock per day you can cover your short position FOUR TIMES (4) at a LOSS. (cutloss) FEES / COMMISSIONS – Same as long positions. COMPUTATION OF PROFITS – (Sell price – cover price)*shares – fees
For those who are not familiar on how to trade SHORT POSITIONS, here’s a STEP-BY-STEP guide to short selling stocks for this competition:
1. Choose your position from the market order type (long or short).
2. Upon choosing the short position, input the initial number of shares you want to sell.
Note: To short a stock, you have to SELL it first. Then to cover your position, you will need to BUY the shares back. To learn more please watch the tutorial: LINK
3. For closing the short position, select the short option in the market order type and input the number of shares you want to buy to close your short position.
10. Holding period for all stocks (For both LONG and SHORT positions).
We will be applying the twenty (20) minute time lock for taking profits to ALL STOCKS to avoid widespread and rinse-repeat trades.
There will be no time lock or restrictions when selling at a loss.
11. Revision of Tradable Stocks.Investa has the right to remove any stock from the list should it suddenly become too illiquid, abusable and/or delisted. Furthermore, Investagrams may also add new stocks on the tradable list as new stocks become more active and tradable in the market. All changes will be announced before implementation.
In such cases that a stock is to be removed, we will follow this process:
Investa shall notify all the participants via the Investa Platform’s notifications and group posts before the market opens.
If you still have the stock in your portfolio, you can sell it at any point in time at your discretion.
12. Initial Public Offering (IPO).All upcoming IPOs that will happen while the PRIME Millionaire’s Cup is on-going will be added on its SECOND (2nd) trading day.
13. On Dividends that will be given during the PRIME Millionaire’s Cup.
Stock Dividends that will be released by a company will be credited at the END OF THE DAY of the ex-date. Please note that stock dividends will cause price adjustments, so be aware if a stock you’re holding will release stock dividends.
Cash Dividends that will be released by a company will NOT be credited to your total equity as the current system is still not able to credit cash divs.
14. On SRO that may happen during the PRIME Millionaire’s Cup.
Stock Rights Offerings (or SRO) is offered to existing shareholders of a specific stock to purchase additional shares at a price lower than the current market price in addition to their current shares at hand.
SRO’s can be deemed good for longer-term investors. However, in the short term, may POTENTIALLY lead to a possible decline or gap down in the stock. So it’s important to always be aware of this.
Participants in the PRIME Millionaire’s Cup will not have an option to purchase additional shares from the SRO.
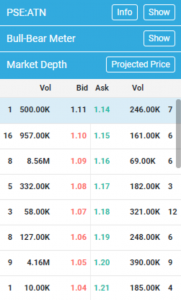
15. For stocks that will be detected by our WIDE-SPREAD DETECTION SYSTEM (WSDS). The Wide-Spread Detection System’s main condition is that the first (1st) best bid and ask should never be more than 2% at any moment during the open market session.
Fig 1. Real-time Market Depth / Orderbook showing the first (1st) best bid-ask data.
Example: $ATN (Refer to Fig. 1)
Given:
1st best bid = 1.11
1st best ask = 1.14
Formula:
X = (1st best ask – 1st best bid) / 1st best bid
Condition:
If X is greater than 2% then WSDS detects that the stock is wide-spread and can be abused.
Solution:
X = (1.14 – 1.11) / 1.11 = 0.02700 x 100% = 2.70%
Verdict:
Since X is greater than 2% then the stock is wide-spread as computed by the system.
The participant will be given a prompt that the detected stock is not tradable upon executing a buy or sell transaction.
The stock will again be tradable once the system detects that the spread of the 1st best bids/asks are below 2%.
16. On Trading Abuses.
Day trading opportunities on natural market moves are normal, but please take note that Investagrams will be on full-guard against participants that abuse illiquid opportunities. We want our winners to show real trading skills that are applicable in the PSE. Abuse of intraday spread trades will NOT BE TOLERATED. These rules are set to protect against the usual ‘rinse-and-repeat’ abuses that are mostly used in virtual trading competitions like this.
Any participant that has more than 10% of their profits from rinse-and-repeat wide spread, illiquid and other abusive trades will be penalized or DISQUALIFIED depending on the severity of their offenses. We will be able to validate this through our data and algorithms that verify the historical transactions of each participant.
Any form of hacks, cheats, and abuses shall not be tolerated and will have corresponding repercussions. Suspicious behavior that may not be specified in the rules may also be flagged as ‘abusive’ trading behavior. A warning shall be sent after Investa has reviewed and confirmed that the actions are against the integrity of the competition. All trade records shall be verified and those who fail to follow the rules will be disqualified.
Participants will only be given ONE (1) warning, any participant who has constantly repeated any abusive trading behaviors (whether illiquid stocks, system abuses, loophole abuses) will instantly be DISQUALIFIED. Investa has the right to review any suspicious activity, and if the behavior is deemed inconsistent with real-life trading then the said participant shall be disqualified.
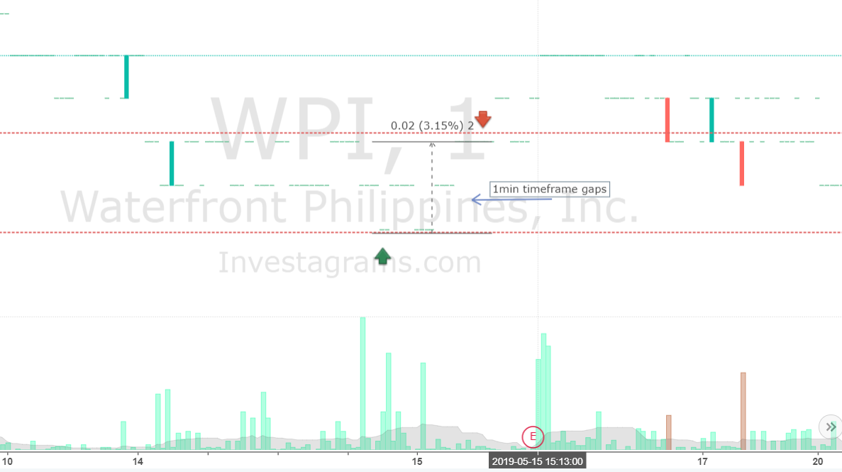
Questionable Transactions. Questionable transactions will be cross-checked through the buy and sell transaction time and the traded stock. Stocks that have more than 2% consistent gaps in the one (1) minute timeframe within the transaction period shall be deemed invalid and Investagrams has the right to deduct the profits from the said transactions. It is normal to trade natural intraday moves and gaps can really happen, but if a participant is constantly trading stocks that have gaps within one (1) minute timeframe and their profits from these kinds of scenarios make up more than 10% of their total profits, then he/she will be automatically disqualified.
Fig 2. Example 1 for one (1) minute time frame gaps with buy (green arrow) and sell (red arrow) transactions
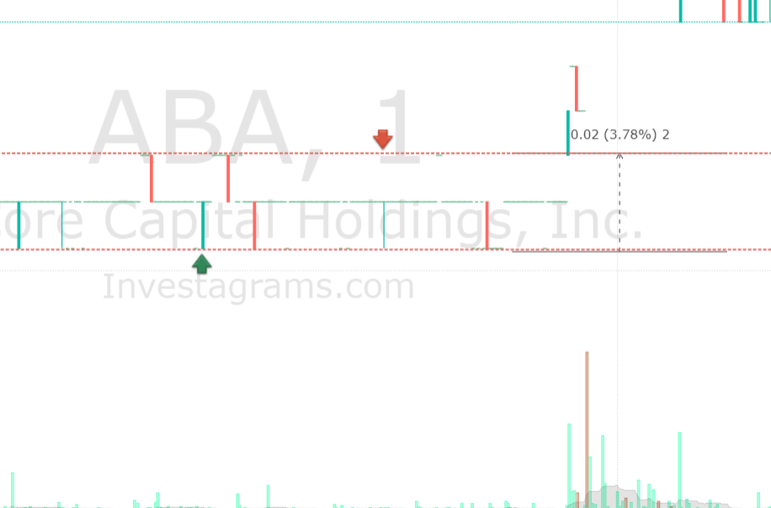
Fig 3. Example 2 for one (1) min. time frame abusable 2% gaps
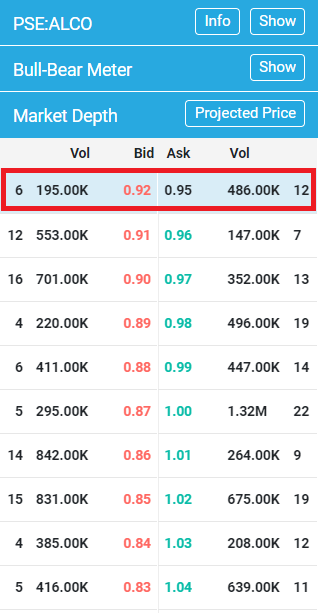
Fig 4. Example 3 for one (1) min. time frame abusable 2% gaps
Investa will warn the participant that is proven to be constantly transacting with illiquid stocks with 2% one (1) minute gaps. Basically, any stock that has 2% spreads and do not really have a trend is included in this definition. After the first warning, any participant that is proven to repeat this kind of behavior shall be disqualified.
17. Trading halt.Stocks that are on a trading halt will not be tradable during the halt and will be tradable again during the announced lifting time.
18. Participant rankings. This is constantly updated every 10-minutes and automatically ranked by Investa system according to net profit gain/loss.
19. Deliberation period and the announcement of winners.At the end of the competition, at least one (1) week deliberation period shall be given to Investa team of moderators to verify trades and the confirmation of winners. The participants with the highest net profits will win. The resulting Top 3 participants after deliberation will be announced as the official winners.
19. Total prizes. Here’s the breakdown of PRIME Millionaire’s Cup Circuit 1 prizes:
Top 1 = PHP 50,000 // Lifetime Elite Access // Trading Cup Access // Hall of Fame
Top 2 = PHP 30,000 // Trading Cup Access
Top 3 = PHP 20,000 // Trading Cup Access
20. Unexpected events. In the case of an unexpected event that interrupts the operations of PSE or the system of Investagrams, the competition shall be frozen and paused. Further notice shall be given and trading will resume once everything is back to normal.
21. Modification and adding of rules. Investa has the right to modify the rules of the competition and add protective measures against any future abuses that may arise to ensure the integrity of the PRIME Millionaire’s Cup. Announcements shall be made if there are any changes. Rest assured, we prioritize keeping the competition as FAIR as possible to all participants.
22. Ignorance of the rules is no excuse.All participants are expected to have read and understood the rules and mechanics of the PRIME Millionaire’s Cup. These are published for the participants’ information and protection. Ignorance of these rules and mechanics is not an acceptable excuse for violation.
23. If you are part of the Top 3 winners, the FINAL DEADLINE to claim your cash prize is on APRIL 30, 2021. The cash prize will not be given anymore past this date.
24. Sponsors. Apple is not involved in any way in this competition. The sponsor(s) is/are solely responsible for providing the prize(s) listed herein. The prize(s) won are not apple products, nor are they related to apple in any way. The responsibility of organizing this competition and distributing the prize(s) are the sponsors’ responsibilities. Apple does not sponsor this competition in any way.
25. Joining thePRIME Millionaire’s Cup means that you agree with all the clauses mentioned above.
Cost averaging is the method of investing where a certain amount of money is invested in a specific interval over time.
Advantages
Mitigates Risk
Very Smart way of investing in the long term
Conclusion
It is asset accumulation
Additional Ideas:
Investing long term without the anxiety
Not everyone can time the market as well as the top traders in Investagrams, and not everyone can handle the pressure red candle sticks bring during dumps. Even though there is no absolute risk free method of investing, there are methods smart investors use to minimize risk.
Cost averaging is perhaps the simplest and least stressful approach to investing, wherein the main objective is to accumulate as many shares as possible and stay above the average price to gain profit.
Cost averaging is a very long term and conservative investing strategy. Instead of investing a lump sum and risking everything all at once with a single pump or dump ready to make you rich or penniless, implementing cost averaging regularly takes portions of your lump sum and invests it in a preset schedule.
Being able to accumulate shares over time at different price points protects your portfolio from the painful losses of sharp dumps. Since Cost averaging is very conservative in nature, it doesn’t benefit as much as other methods from breakouts. It, however, does a very excellent job of preserving your wealth.
To put cost averaging into perspective, suppose that you want to invest 1M in Jollibee Foods Corp., which is currently 4 pesos per share. If you invest everything in a single price, and that price drops to 3 pesos per share in the following week, you would have already lost a quarter of your capital if you were to close the trade.
Now, if you were to invest your 1M evenly in a span of 8 months, you wouldn’t have to commit to a singular price that can dictate your capital the next day or so. Investing 125 000 per month, and purchasing as many shares as your monthly budget can afford mitigates your risk and prevents a single price to lift or crush your capital.
Yes, you would sometimes buy an overpriced share, sometimes an underpriced share, but as you accumulate shares over the months, time will do its part and grow your capital. No more FOMO, no more complicated Technical Analysis, no more stress.
It is important to note that like everything in investing, there is still risk involved in this approach, and that cost averaging isn’t the one size fits all answer for getting rich. Declining markets can still be a threat to your capital even if you follow this approach.
The cost averaging approach is not for everyone though. Investors who are really thinking long term will find this strategy stress free, easy, and effective. It eliminates confusion during entry and exit, and gives clarity to investing in the stock market by keeping things simple.
Traders with higher risk appetites however, may find this method a bit slow and boring for their liking as they are used to riding trends, anticipating pumps and dumps, and getting in and out fast. Even as such, cost averaging shouldn’t be completely overlooked by traders as this can still be a useful approach to preserving the wealth that they have accumulated over time.
Click the photo to join for FREE!
Subscribe to our Newsletter
Join our mailing list for investing tips and stock market advice to help you reach your first million.